. 2021 Feb;27(2):174-185.
doi: 10.1111/cns.13454. Epub 2020 Sep 22.

Neuron-specific deletion of presenilin enhancer2 causes progressive astrogliosis and age-related neurodegeneration in the cortex independent of the Notch signaling

Affiliations

Neuron-specific deletion of presenilin enhancer2 causes progressive astrogliosis and age-related neurodegeneration in the cortex independent of the Notch signaling

Hui-Ru Bi et al. CNS Neurosci Ther. 2021 Feb.

Abstract

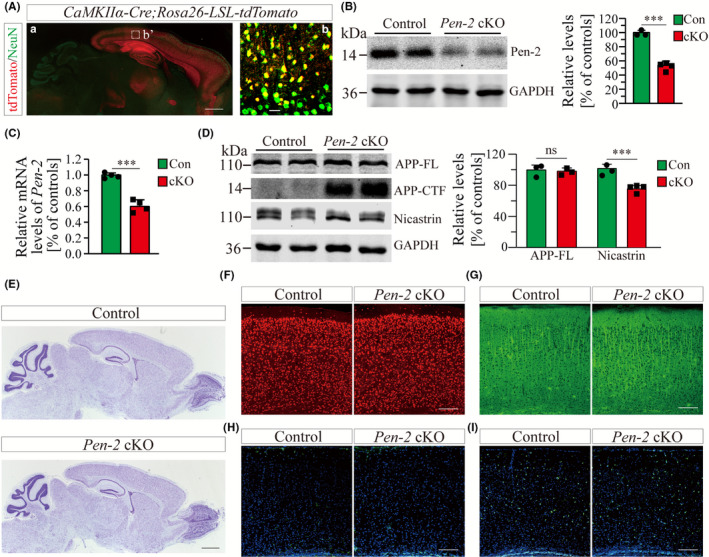
Introduction: Presenilin enhancer2 (Pen-2) is an essential subunit of γ-secretase, which is a key protease responsible for the cleavage of amyloid precursor protein (APP) and Notch. Mutations on Pen-2 cause familial Alzheimer disease (AD). However, it remains unknown whether Pen-2 regulates neuronal survival and neuroinflammation in the adult brain.

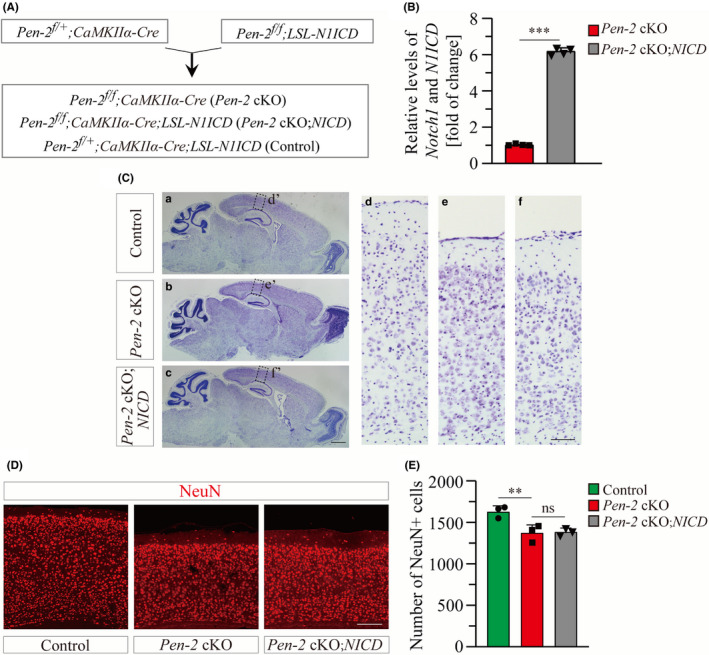
Methods: Forebrain neuron-specific Pen-2 conditional knockout (Pen-2 cKO) mice were generated for this study. Pen-2 cKO mice expressing Notch1 intracellular domain (NICD) conditionally in cortical neurons were also generated.

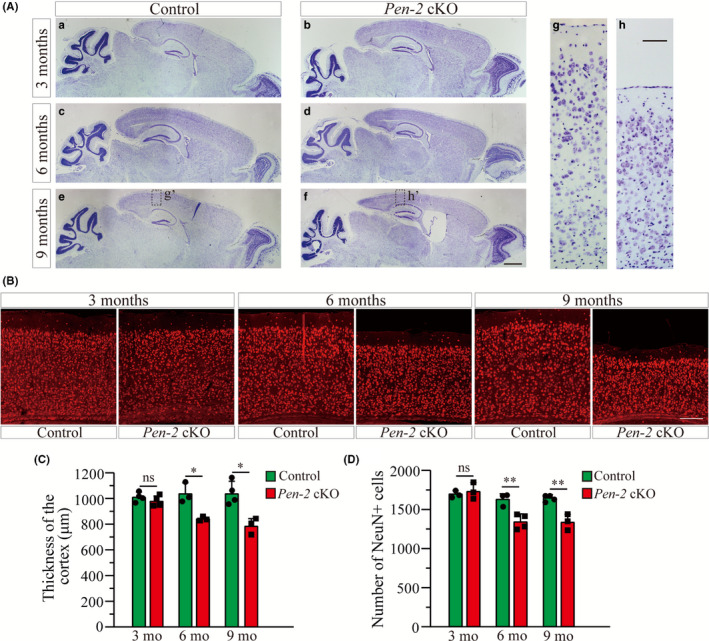
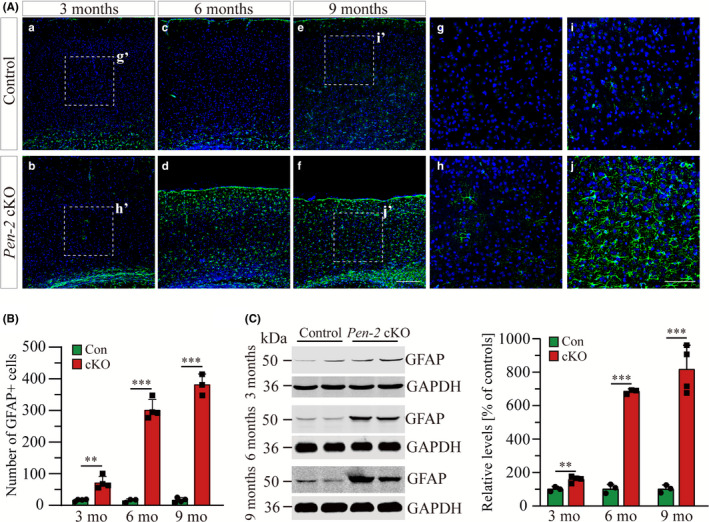
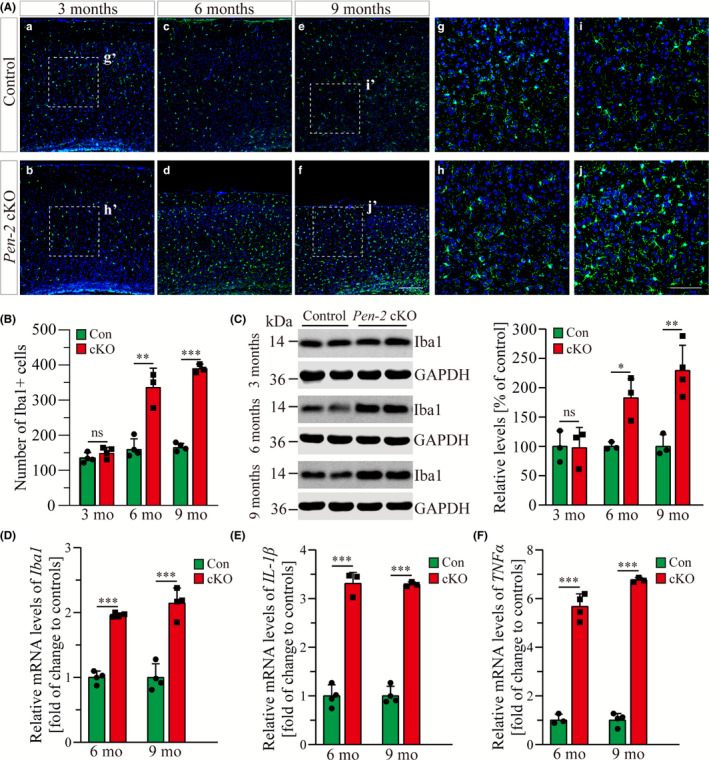
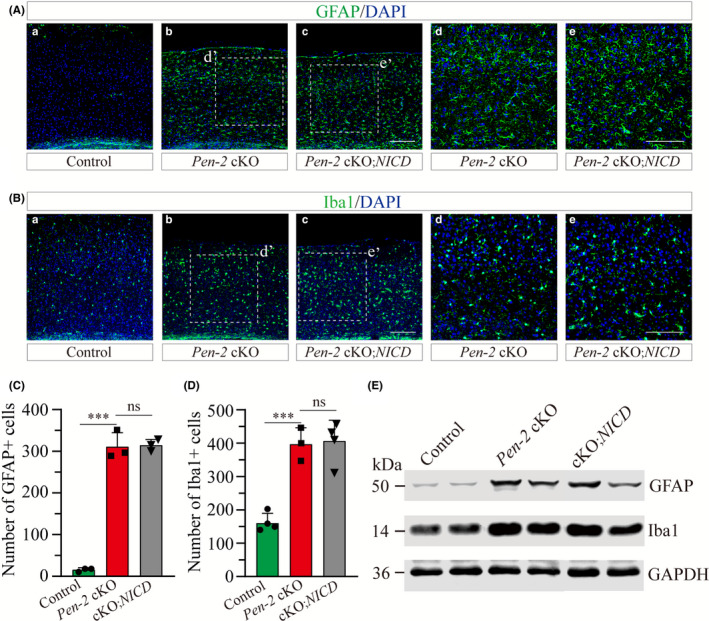
Results: Loss of Pen-2 causes astrogliosis followed by age-dependent cortical atrophy and neuronal loss. Loss of Pen-2 results in microgliosis and enhanced inflammatory responses in the cortex. Expression of NICD in Pen-2 cKO cortices ameliorates neither neurodegeneration nor neuroinflammation.

Conclusions: Pen-2 is required for neuronal survival in the adult cerebral cortex. The Notch signaling may not be involved in neurodegeneration caused by loss of Pen-2.

Keywords: Alzheimer disease; astrogliosis; microgliosis; neurodegeneration; presenilin enhancer2.


Conflict of interest statement

The authors declare no conflict of interest.

Figures

Figure 1
Figure 1
Molecular characterization of forebrain neuron‐specific Pen‐2 cKO mice. A, Co‐staining for NeuN and tdTomato. CaMKIIα‐Cre;Rosa26‐LSL‐tdTomato mice were used to collect brain sections. There was wide expression of tdTomato in the cortex, the hippocampus, the olfactory bulb, and the striatum but not the cerebellum. Most NeuN+ cells were positive for tdTomato. The boxed area in (a) was enlarged as (b). Scale bar is 500 μm in (a) but 25 μm in (b). B, Western analysis on Pen‐2. Cortical protein samples for control (Con) and Pen‐2 cKO (cKO) mice at 3 mo were used. There was significant difference on Pen‐2 levels between control and Pen‐2 cKO mice (***P < 0.001; n = 3‐4 mice per group). C, Relative Pen‐2 mRNA levels. There was significant difference between control (Con) and Pen‐2 cKO (cKO) mice (***P < 0.001; n = 4 per group). D, Western analyses for APP‐FL, APP‐CTF and nicastrin. Cortical samples at 3 mo were used. There was no significant difference on protein levels of APP‐FL between control (Con) and Pen‐2 cKO (cKO) mice (P > 0.6; n = 3 per group). There was significant difference on protein levels of nicastrin between control and Pen‐2 cKO mice (***P < 0.001; n = 3‐4 per group). E, Nissl staining. There was comparable brain size in control and Pen‐2 cKO mice at 2 mo. Scale bar is 1 mm. F‐I, Representative fluorescence IHC images for NeuN (F), MAP2 (G), GFAP (H) and Iba1 (I). Images were taken from cortices of control and Pen‐2 cKO mice at 2 mo. Scale bar is 200 μm
Figure 2
Figure 2
Age‐dependent neurodegeneration in Pen‐2 cKO mice. A, Nissl staining. Brain sections of mice at 3, 6, and 9 mo were used. There was cortical atrophy and enlarged lateral ventricle in Pen‐2 cKO mice at 6 and 9 mo compared with controls. Boxed areas in (e) or (f) were enlarged as (g) and (h), respectively. Scale bar is 1 mm for (a‐f) or 100 μm for (g‐h). B. Representative fluorescence images for NeuN IHC taken from cortices. Brain sections from mice at 3, 6, and 9 mo were used. Scale bar is 200 μm. C, Cortical thickness. There was no significant difference on the size of the cortex between control and Pen‐2 cKO mice at 3 mo. There was significant decrease in Pen‐2 cKO mice at 6 (*P < 0.05; n = 3 mice per group) or 9 mo (*P < 0.05; n = 3‐4 per group). D, Averaged number of NeuN+ cells. There were significant decreases on NeuN+ cells in Pen‐2 cKO mice at 6 (**P < 0.01; n = 3‐4 per group) and 9 (**P < 0.01; n = 3‐4 per group)
Figure 3
Figure 3
Progressive astrogliosis in Pen‐2 cKO mice. A, Representative images for fluorescence IHC on GFAP in the cortex. Brain sections of mice at 3, 6, and 9 mo were used. The immuno‐reactivity of GFAP was increased in Pen‐2 cKO mice since 3 mo of age compared with controls. Boxed areas in (a), (b), (e), and (f) were enlarged as (g), (h), (i), and (j), respectively. Scale bar is 200 μm for (a‐f) or 100 μm for (g‐j). B. Averaged number of GFAP+ cells in the cortex. There was significant difference between control (Con) and Pen‐2 cKO (cKO) mice at each age (3 mo: **P < 0.01; 6 mo: ***P < 0.001; 9 mo: ***P < 0.001; n = 3‐4 mice per group). Analysis of variance (ANOVA) revealed significant Age (F = 115.3, df2/16, P < 0.001) and Age × Genotype effects (F = 116.5, df2/16, P < 0.001), suggesting progressive astroglial activation. C, Western analysis on GFAP. Cortical samples at 3, 6, and 9 mo were used. GFAP levels in Pen‐2 cKO (cKO) mice differed from those in controls (Con) at each age (P < 0.05; n = 3‐4 per group). The increase in GFAP levels was above 6‐fold in Pen‐2 cKO cortices compared with controls at 6 or 9 mo
Figure 4
Figure 4
Age‐related microgliosis in Pen‐2 cKO mice. A, Representative images for fluorescence IHC on Iba1 in the cortex. Mice at 3, 6, and 9 mo were examined. Note that the immuno‐reactivity of Iba1 was not increased in Pen‐2 cKO mice at 3 mo compared with controls. Boxed areas in (a), (b), (e), and (f) were enlarged as (g), (h), (i), and (j), respectively. Scale bar is 200 μm for (a‐f) or 100 μm for (g‐j). B, Averaged number of Iba1+ cells in the cortex. There was significant difference between control (Con) and Pen‐2 cKO (cKO) mice at each age (3 mo: P > 0.2; 6 mo: **P < 0.01; 9 mo: ***P < 0.001; n = 3‐4 mice per group). C, Western analysis on Iba1. Note that Iba1 levels in Pen‐2 cKO (cKO) mice did not differ from those in controls (Con) at 3 mo of age but were increased at 6 and 9 mo (3 mo: not significant; 6 mo: *, P < 0.05; 9 mo: **P < 0.01; n = 3‐4 per group). D‐F, qPCR analyses for Iba1 (D), IL‐1β (E), and TNFα (F). Data for 6 and 9 mo were presented. There was significant increase on levels for Iba1 (D), IL‐1β (E), and TNFα (F) in Pen‐2 cKO (cKO) mice compared with controls (Con) at either age (***P < 0.001; n = 3‐4 per group)
Figure 5
Figure 5
NICD does not ameliorate neuronal loss in Pen‐2 cKO mice. A, Experimental plan for the generation of Pen‐2 cKO mice expressing N1ICD conditionally in a Cre‐dependent manner. B, qPCR analysis on Notch1 and N1ICD. Relative mRNA levels of Notch1 and N1ICD were highly significantly increased in the cortex of Pen‐2 cKO;NICD mice as compared to Pen‐2 cKOs (***P < 0.001; n = 4 mice per group). C, Nissl staining. Brain sections of control, Pen‐2 cKO, and Pen‐2 cKO;NICD mice at 5‐7 mo were used. Note that there was decreased cortical thickness in Pen‐2 cKO mice with and without NICD expression compared with controls. Boxed areas in (a‐c) were enlarged as (d‐f). Scale bar is 1 mm in (a‐c) or 100 μm in (d‐f). D, Representative images for fluorescence IHC on NeuN. Images were taken from the cortex. Note that there was decreased cortical thickness in Pen‐2 cKO and Pen‐2 cKO;NICD mice compared with controls. Scale bar is 200 μm. E, Averaged number of NeuN+ cells in the cortex. There was no significant difference between Pen‐2 cKO and Pen‐2 cKO;NICD mice. There was significant difference between Pen‐2 cKO and control mice (ns, not significant; **P < 0.01; n = 3 per group)
Figure 6
Figure 6
NICD does not reduce gliosis in Pen‐2 cKO mice. A‐B, Representative images for fluorescence IHC on GFAP (A) and Iba1 (B). Images were taken from the cortex of control, Pen‐2 cKO or Pen‐2 cKO;NICD mice. Boxed areas in (b,c) were enlarged as (d,e). Scale bar is 200 μm in (a‐c) or 100 μm in (d‐e). C, Averaged number of GFAP+ cells in the cortex. There was no significant difference between Pen‐2 cKO and Pen‐2 cKO;NICD mice. There was significant difference between Pen‐2 cKO and control mice (ns, not significant; ***P < 0.001; n = 3 mice per group). D, Averaged number of Iba1+ cells in the cortex. There was no significant difference between Pen‐2 cKO and Pen‐2 cKO;NICD mice. There was significant difference between Pen‐2 cKO and control mice (ns, not significant; ***P < 0.001; n = 3‐4 per group). E, Western blotting on GFAP and Iba1. Cortical samples of control, Pen‐2 cKO and Pen‐2 cKO;NICD mice were used. Blots for GFAP or Iba1 were comparable between Pen‐2 cKO and Pen‐2 cKO;NICD mice

References

    1. Ballard C, Gauthier S, Corbett A, et al. Alzheimer's disease. Lancet. 2011;377(9770):1019‐1031. - PubMed
    1. Palmer AM. Neurochemical studies of Alzheimer's disease. Neurodegeneration. 1996;5(4):381‐391. - PubMed
    1. Levylahad E, Wasco W, Poorkaj P, et al. Candidate gene for the chromosome‐1 familial Alzheimers‐disease locus. Science. 1995;269(5226):973‐977. - PubMed
    1. Schellenberg GD, Bird TD, Wijsman EM, et al. Genetic‐linkage evidence for a familial Alzheimers‐disease locus on chromosome‐14. Science. 1992;258(5082):668‐671. - PubMed
    1. Goate A, Chartierharlin MC, Mullan M, et al. Segregation of a missense mutation in the amyloid precursor protein gene with familial Alzheimers‐disease. Nature. 1991;349(6311):704‐706. - PubMed

Publication types

MeSH terms

Substances