. 2020 Nov 25;108(4):623-639.e10.
doi: 10.1016/j.neuron.2020.08.024. Epub 2020 Sep 21.

Tracking Calcium Dynamics and Immune Surveillance at the Choroid Plexus Blood-Cerebrospinal Fluid Interface

Affiliations

Tracking Calcium Dynamics and Immune Surveillance at the Choroid Plexus Blood-Cerebrospinal Fluid Interface

Frederick B Shipley et al. Neuron. .

Abstract

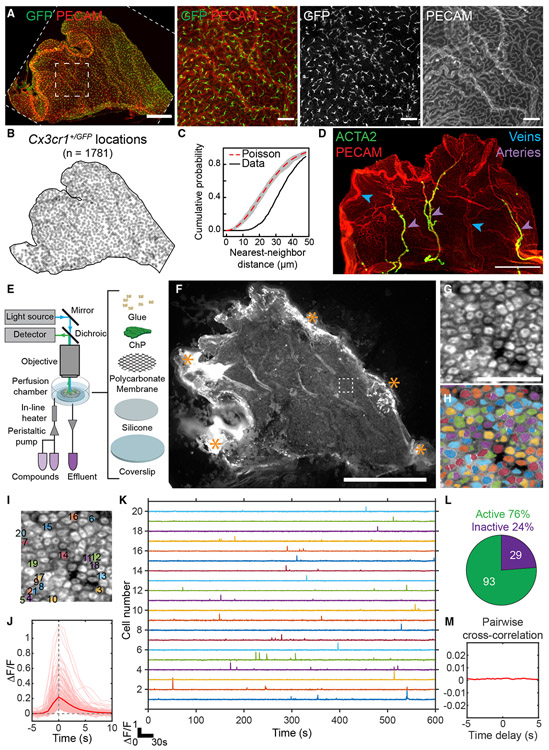
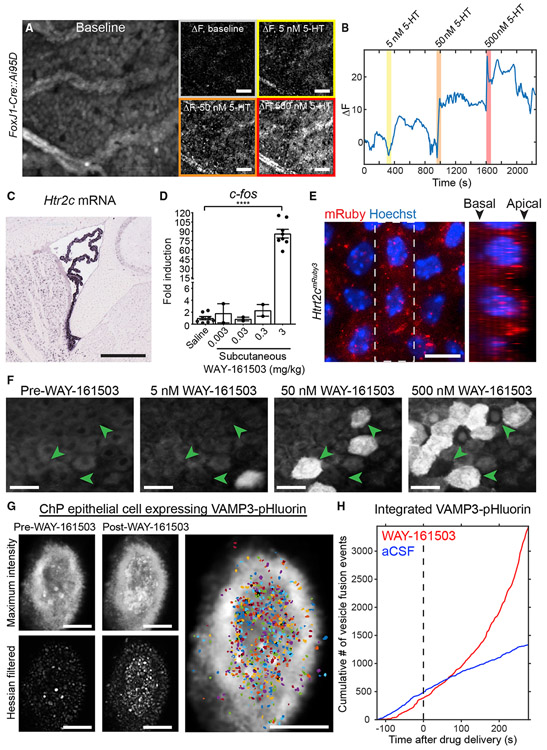
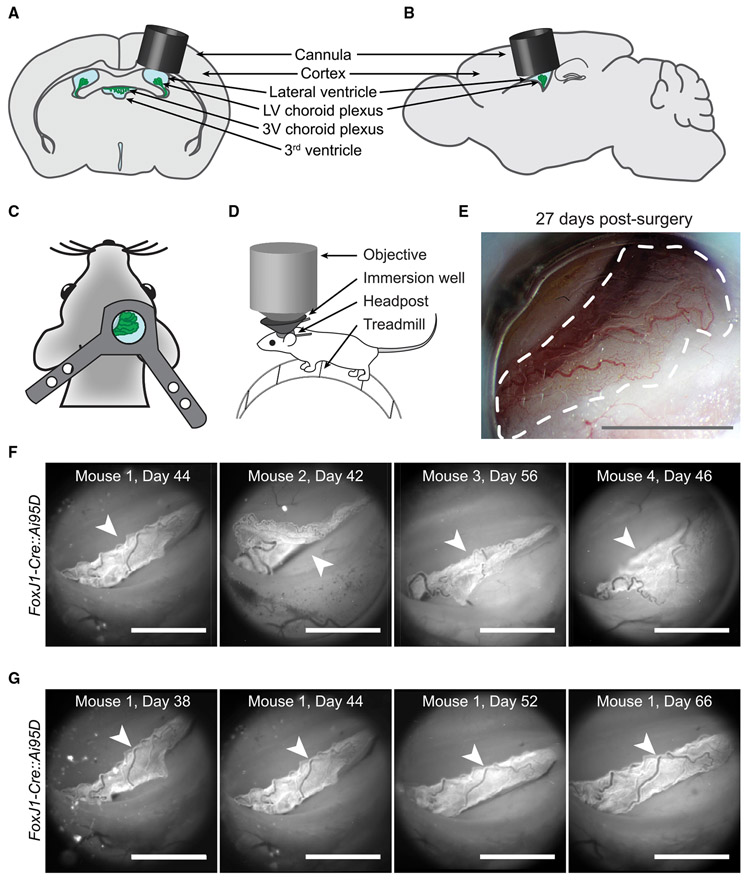
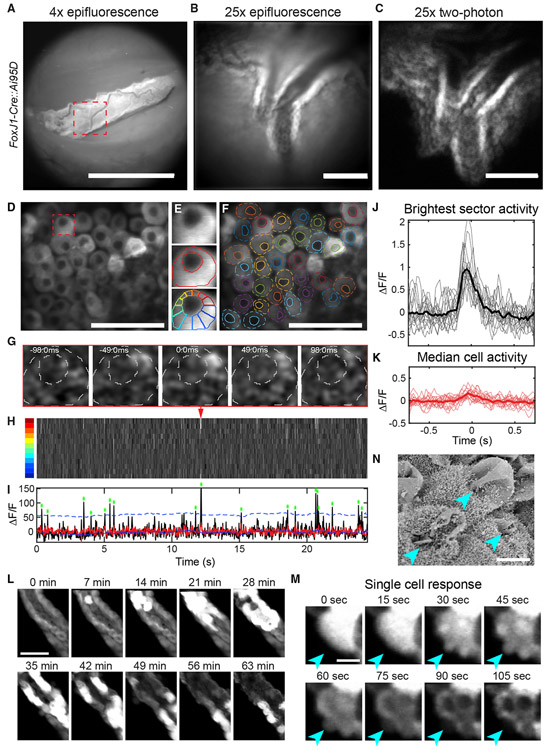
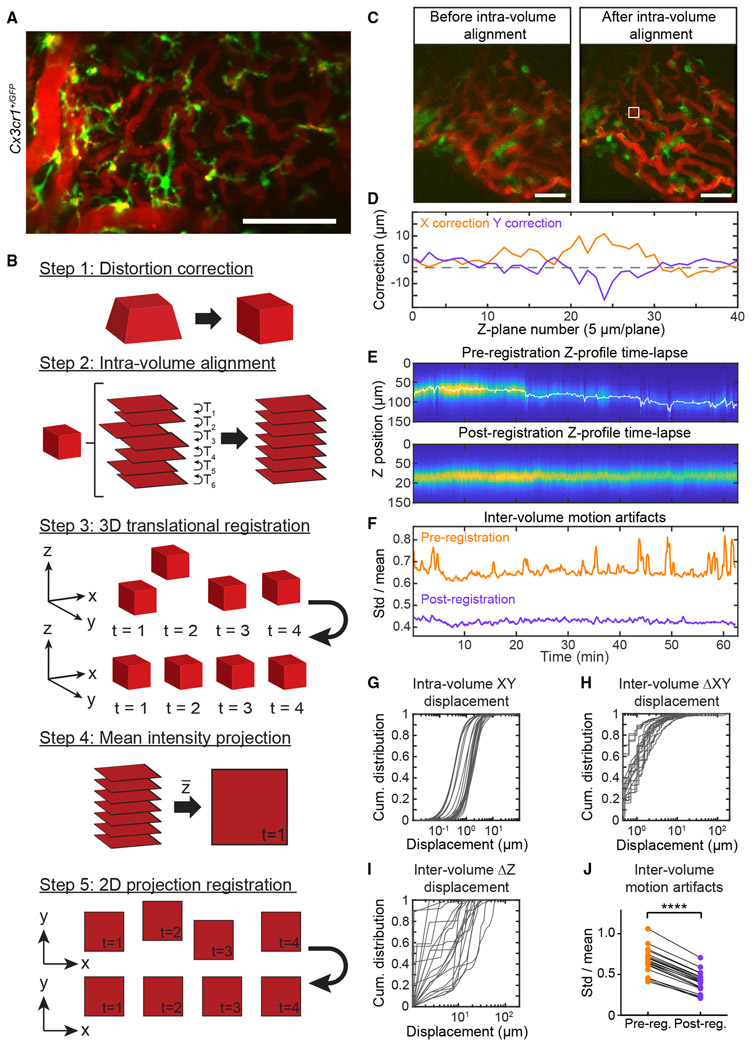
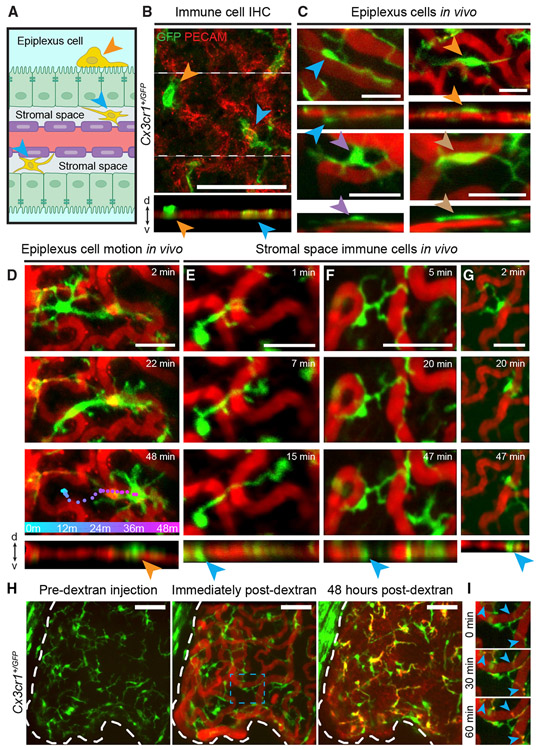
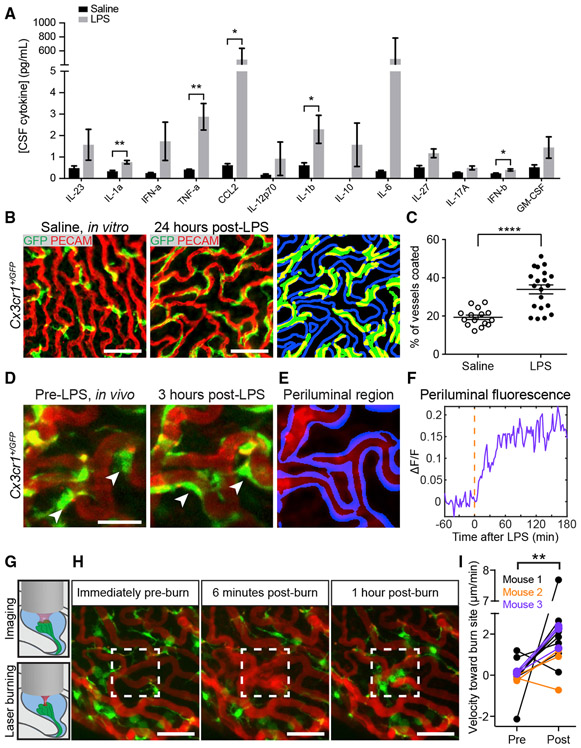
The choroid plexus (ChP) epithelium is a source of secreted signaling factors in cerebrospinal fluid (CSF) and a key barrier between blood and brain. Here, we develop imaging tools to interrogate these functions in adult lateral ventricle ChP in whole-mount explants and in awake mice. By imaging epithelial cells in intact ChP explants, we observed calcium activity and secretory events that increased in frequency following delivery of serotonergic agonists. Using chronic two-photon imaging in awake mice, we observed spontaneous subcellular calcium events as well as strong agonist-evoked calcium activation and cytoplasmic secretion into CSF. Three-dimensional imaging of motility and mobility of multiple types of ChP immune cells at baseline and following immune challenge or focal injury revealed a range of surveillance and defensive behaviors. Together, these tools should help illuminate the diverse functions of this understudied body-brain interface.

Keywords: calcium activity; cerebrospinal fluid; choroid plexus; epithelial cells; immune cells; secretion; serotonin; two-photon imaging.


Conflict of interest statement

Declaration of Interests The authors declare no competing interests.

Figures

Figure 1.
Figure 1.. Isolation, Immunostaining, and Calcium Imaging of Lateral Ventricle ChP Explants
(A) Left: large leaf of LV ChP from a Cx3cr1+/GFP mouse immunostained with anti-GFP (green, immune cells) and PECAM (red, vasculature). Scale bar, 500 μm. Right: zoom-in of small dashed box. Scale bar, 100 μm. Cx3cr1+/GFP cells tile the ChP (confirmed in eight other mice). (B) Positions of 1,781 Cx3cr1+/GFP cells from (A). (C) Cumulative distribution of nearest-neighbor distances of each Cx3cr1+/GFP cell. Immune cells showed regular spacing (~30 μm) relative to random Poisson spacing (red trace; gray envelope, 1% acceptance interval). (D) PECAM (red) and ACTA2 (green) immunostains demarcate stereotyped LV ChP regions (confirmed in three other mice). Purple arrowheads, arteries. Blue arrowheads, veins. Scale bar, 500 μm. (E) Light path and setup for imaging LV ChP. (F) Epifluorescence image containing a FoxJ1-Cre::Ai95D LV ChP explant expressing GCaMP6f in multiciliated ChP epithelial cells. Cells near stabilizing glue attachments at explant borders (asterisks) showed elevated GCaMP6f fluorescence (indicating unhealthy cells) and were excluded from subsequent analyses. Scale bar, 1 mm. (G) Zoom-in of 122 epithelial cells (dashed box in F). Scale bar, 50 μm. (H) Cell masks (see STAR Methods). (I) Twenty labeled cells corresponding to traces in (K). (J) Pink, traces surrounding each calcium transient with a fractional change in fluorescence, ΔF/F > 5σ (235 events across 122 cells from H). Red, mean calcium transient across traces. (K) Five-minute time courses from cells in (I). (L) Seventy-six percent of cells (93 of 122) in (H) exhibited calcium events. (M) Average of all cross-correlations between binarized event time courses of all pairs of cells from (H) (computed at delays from −5 to +5 s), demonstrating that spontaneous events were uncorrelated across cells. We observed qualitatively similar results as in (G)–(M) in 25 other mice (not shown). See also Figure S1; Video S1.
Figure 2.
Figure 2.. Evoked Calcium Activity and Exocrine Secretion in ChP Epithelial Cells
(A) Epifluorescence calcium imaging of ChP epithelial cells from FoxJ1-Cre::Ai95D LV ChP explant. Mean baseline fluorescence (left) and changes in fluorescence from baseline in response to 0, 5, 50, and 500 nM 5-HT. Scale bar, 100 μm. (B) Time course of changes from baseline, averaged across the explant. Responses to at least one dose of 5-HT were observed in 18 of 19 mice and to all three doses in 10 of 19 mice (not shown). (C) Htr2c expression in LV ChP (from Allen Brain Atlas; Lein et al., 2007). Scale bar, 500 μm. (D) c-fos induction following injection of 5-HT2C agonist WAY-161503 (****p < 0.0001, t test, saline versus 3 mg/kg s.c.; left to right, n = 8, 2, 2, 2 and 8). (E) Htr2cmRuby3 LV ChP labels 5-HT2C receptors in epithelial cells. Axial (left) and side-on (right; from dashed box at left) maximum projections show preferential apical (apposed to the CSF) versus basal (closer to vessels) localization. Scale bar, 10 μm. (F) Two-photon imaging of FoxJ1-Cre::Ai95D explants. Higher concentrations of WAY-161503 activated more cells (green arrowheads), and cells activated at lower concentrations are not reactivated later. Responses were observed in 7 of 7 mice and to each dose in 5 of 7 mice (not shown). Scale bar, 10 μm. (G) Confocal imaging of vesicle release from an example LV ChP epithelial cell following viral expression of VAMP3-pHluorin. Top left: maximum-intensity projection across baseline period shows fluorescent vesicle release (white punctae). Bottom left: similar projection following Hessian-based filtering. Middle panels: same as left but following application of WAY-161503 (500 nM). Right: vesicle release event masks segmented from the filtered movie. Scale bar, 5 μm. (H) Cumulative number of VAMP3-pHluorin vesicle release events following application of WAY-161503 (red) or aCSF (blue). See also Figure S2; Videos S2, S3, S4, and S5.
Figure 3.
Figure 3.. Imaging Lateral Ventricle ChP in Awake Mice
(A and B) Schematic of cannula (gray cylinder) with glass bottom, implanted above the LV ChP (green). (C) Headpost placement. (D) Head-fixed mouse on a trackball. An immersion well attached to the headpost allowed imaging using a high numerical aperture objective. (E) Bright-field image of ChP through the cannula 27 days post-surgery. Dotted line outlines ChP. Scale bar, 1 mm. (F) Epifluorescence images of ChP (arrowheads) from FoxJ1-Cre::Ai95D mice, 42–56 days after surgery. Scale bar, 1 mm. (G) Tracking the same ChP (arrowheads) through a clear window across many days following surgery (similar results observed in nine other mice, not shown). Scale bar, 1 mm. See also Figure S3; Video S6.
Figure 4.
Figure 4.. Two-Photon Calcium Imaging of Epithelial Cells in Awake Mice
(A) Epifluorescence image of GCaMP6f-expressing ChP epithelial cells (diagonal vascularized sheet; FoxJ1-Cre::Ai95D mouse). Scale bar, 1 mm. (B) Zoomed-in image (dashed red square in A). Scale bar, 100 μm. (C) Maximum projection of two-photon imaging volume encompassing the ChP region in (B). Scale bar, 100 μm. (D) Average of images at a single plane. Scale bar, 50 μm. (E) Individual epithelial cell (red square in D), annotation of cell outline and nucleus, and division into 12 sectors. (F) Annotation of all cell outlines and nuclei in (D). (G) Time-lapse of a single subcellular calcium event. (H) Kymograph of activity across all 12 sectors of cell in (E) and (G). Red arrowhead, event from (G). (I) Time course of brightest-sector activity (black, maximum across sectors in H) and median activity (red). Asterisks, peaks of subcellular events exceeding 3 SDs (dashed blue line) above a running mean. (J and K) Brightest-sector (J) and median-sector (K) activity surrounding peak (t = 0) of all events for cell in (E). Thicker lines, mean traces. Similar results were observed in three other mice (not shown). (L) Images of cross-sections of two sheets of GCaMP6-expressing epithelial cells separated by stromal space, beginning 25 min after injection of WAY-161503 (3 mg/kg, s.c.; similar results observed in two other mice, not shown). Scale bar, 50 μm. (M) Zoom-in of a single epithelial cell reveals release of subcellular plumes (arrowheads) of intracellular contents including GCaMP6f into CSF. The basal side of the epithelium remained intact, consistent with apocrine secretion. Scale bar, 10 μm. Similar events were observed in a second mouse (not shown). See also Figure S4; Videos S7, S8, S9, and S10. (N) Scanning EM of ChP 15 min following WAY-161503 (3 mg/kg, s.c.) reveals apocrine blebs (arrowheads). Scale bar, 5 μm.
Figure 5.
Figure 5.. Three-Dimensional Imaging and Registration of ChP in Awake Mice
(A) Maximum projections across a time-averaged two-photon imaging volume of Cx3cr1+/GFP immune cells (green) and Texas red dextran-labeled vasculature (red; i.p. injection). Projections from two mice are shown (similar results in 13 other mice, not shown). Scale bar, 100 μm. (B) Registration algorithm (see STAR Methods). Step 1: correct for depth-dependent magnification due to tunable lens. Step 2: intra-volume alignment of each plane to its neighbor. Step 3: 3D translation of each volume to a local target. Steps 4 and 5: Z projection and X-Y alignment. (C) Mean Z projection of a single volume before versus after step 2. Scale bar, 50 μm. (D) Estimated X and Y corrections for each plane of volume in (C). (E) Z-profile time lapse of vasculature before and after 3D registration. Columns, 600 volumes spanning ~63 min; rows, average fluorescence in the white box in (C) at each Z plane. White trace, estimated Z correction. (F) Index of motion artifact (sliding estimate of SD/mean vasculature fluorescence across volumes; see STAR Methods). Registration reduced both large, transient motion artifacts (peaks in orange trace) and persistent, higher frequency motion (see J). (G–I) Cumulative distributions of X and Y displacements of planes within each volume (G) and XY displacements (H) and Z displacements (I) across consecutive volumes. Data in (G)–(J) are from 20 sessions from 13 mice. (J) Mean motion artifact (see F) per session, pre- versus post-registration. ****p < 0.0001, paired t test.
Figure 6.
Figure 6.. ChP Immune Cells Perform Local Surveillance and Housekeeping In Vivo
(A) Cross-section of ChP. Epiplexus immune cells (orange arrowhead) are located on apical (CSF-sensing) surface of epithelium (green sheet). Stromal immune cells (blue arrowheads) are located in stromal space between vasculature (red with purple endothelial cells) and epithelium. (B) Top: axial mean projection of Cx3cr1+/GFP cells in LV ChP explant ex vivo. Bottom: side-on view. Arrowheads indicate stromal (blue) and epiplexus (orange) immune cells. Scale bar, 100 μm. (C–G) Similar to (B) but from in vivo two-photon imaging (see also Videos S11 and S13). Scale bar, 25 μm. (C) Example epiplexus cells from four mice. Side-on views (bottom) indicate locations outside vascular plane (likely outside the epithelium). (D) Example epiplexus cell pausing, then traveling across the ChP surface (colored dots, cell location at 1 min intervals). (E–G) Example stromal immune cells showed either stationary cell bodies with processes that survey nearby vessels (E and F) and that retract following upon contacting a different immune cell (F) or, occasionally, cell body movement constrained by surrounding vessels (G). (H) Left, middle: i.p.-injected red dextran (70 kDa) fills the ChP vasculature. Right: 2 days later, dextran has leaked into stromal space and accumulated within immune cells. Scale bar, 50 μm. (I) Snapshots of dextran punctae accumulating within immune cell processes (arrowheads) in blue dashed box in (H). See also Figure S5; Video S14.
Figure 7.
Figure 7.. ChP Immune Cells Respond to Systemic and Local Insults
(A) Higher CSF cytokine levels 1 h after i.p. injection of LPS versus saline (mean ± SEM; n = 3 samples, each consisting of 25 μL pooled across three to six mice; IL-1α, **p = 0.0017; TNF-α, **p = 0.0072; CCL2, *p = 0.0260; IL1β, *p = 0.0451; and IFN-β, *p = 0.0212 [unpaired t tests]). (B–D) Following LPS, immune cells flatten along vessels. (B) LV ChP explants from Cx3cr1+/GFP mice that received i.p. saline (left) or LPS (middle). Segmentation of immune cells (right panel, green), and periluminal region surrounding vasculature (blue; Figures S6B and S6C; STAR Methods) allowed assessment of overlap (yellow). Scale bar, 50 μm. (C) Percentage of periluminal region occupied by immune cell processes following i.p. saline (n = 15 explants, nine mice) or LPS (n = 20 explants, ten mice). ****p < 0.0001, Welch’s t test. Mean ± SEM. (D) In vivo imaging of immune cells (green) and vasculature (red) pre-LPS (left) and 3 h following i.p. LPS (right). Scale bar, 25 μm. Arrowheads, transitions of cell bodies to splayed morphology (see Video S16). (E) Segmentation of periluminal region (STAR Methods). (F) Fractional change in immune cell fluorescence (ΔF/F) in periluminal region across 4 h, relative to pre-LPS baseline (red line). (G) Schematic of focal injury via brief, high-power focusing of a laser on a small region of ChP during in vivo imaging. (H) Maximum projections of immune cells and vasculature before, 6 min after, and 1 h after a local burn of the region within the white box. At 6 min, dextran leaks out of damaged vessels (see Video S17). Immune cell bodies then migrate to the injury site. Scale bar, 50 μm. (I) Average pre- and post-injury velocity of immune cells toward (positive) or away from (negative) the injury site (n = 15 cells, three mice). **p = 0.0075, paired t test.

References

    1. Agnew WF, Yuen TG, and Achtyl TR (1980). Ultrastructural observations suggesting apocrine secretion in the choroid plexus: a comparative study. Neurol. Res 1, 313–332. - PubMed
    1. Ambudkar IS (2016). Calcium signalling in salivary gland physiology and dysfunction. J. Physiol 594, 2813–2824. - PMC - PubMed
    1. Ambudkar I (2018). Calcium signaling defects underlying salivary gland dysfunction. Biochim. Biophys. Acta Mol. Cell Res 1865 (11 Pt B), 1771–1777. - PubMed
    1. Audhya T, Adams JB, and Johansen L (2012). Correlation of serotonin levels in CSF, platelets, plasma, and urine. Biochim. Biophys. Acta 1820, 1496–1501. - PubMed
    1. Baddedy A, Rubak E, and Turner R (2015). Spatial Point Patterns: Methodology and Applications with R (Boca Raton, FL: Chapman and Hall/ CRC Press; ).

Publication types