. 2020 Oct 1;183(1):126-142.e17.
doi: 10.1016/j.cell.2020.08.022. Epub 2020 Sep 21.

Single-Cell Analyses Identify Brain Mural Cells Expressing CD19 as Potential Off-Tumor Targets for CAR-T Immunotherapies

Affiliations

Single-Cell Analyses Identify Brain Mural Cells Expressing CD19 as Potential Off-Tumor Targets for CAR-T Immunotherapies

Kevin R Parker et al. Cell. .

Abstract

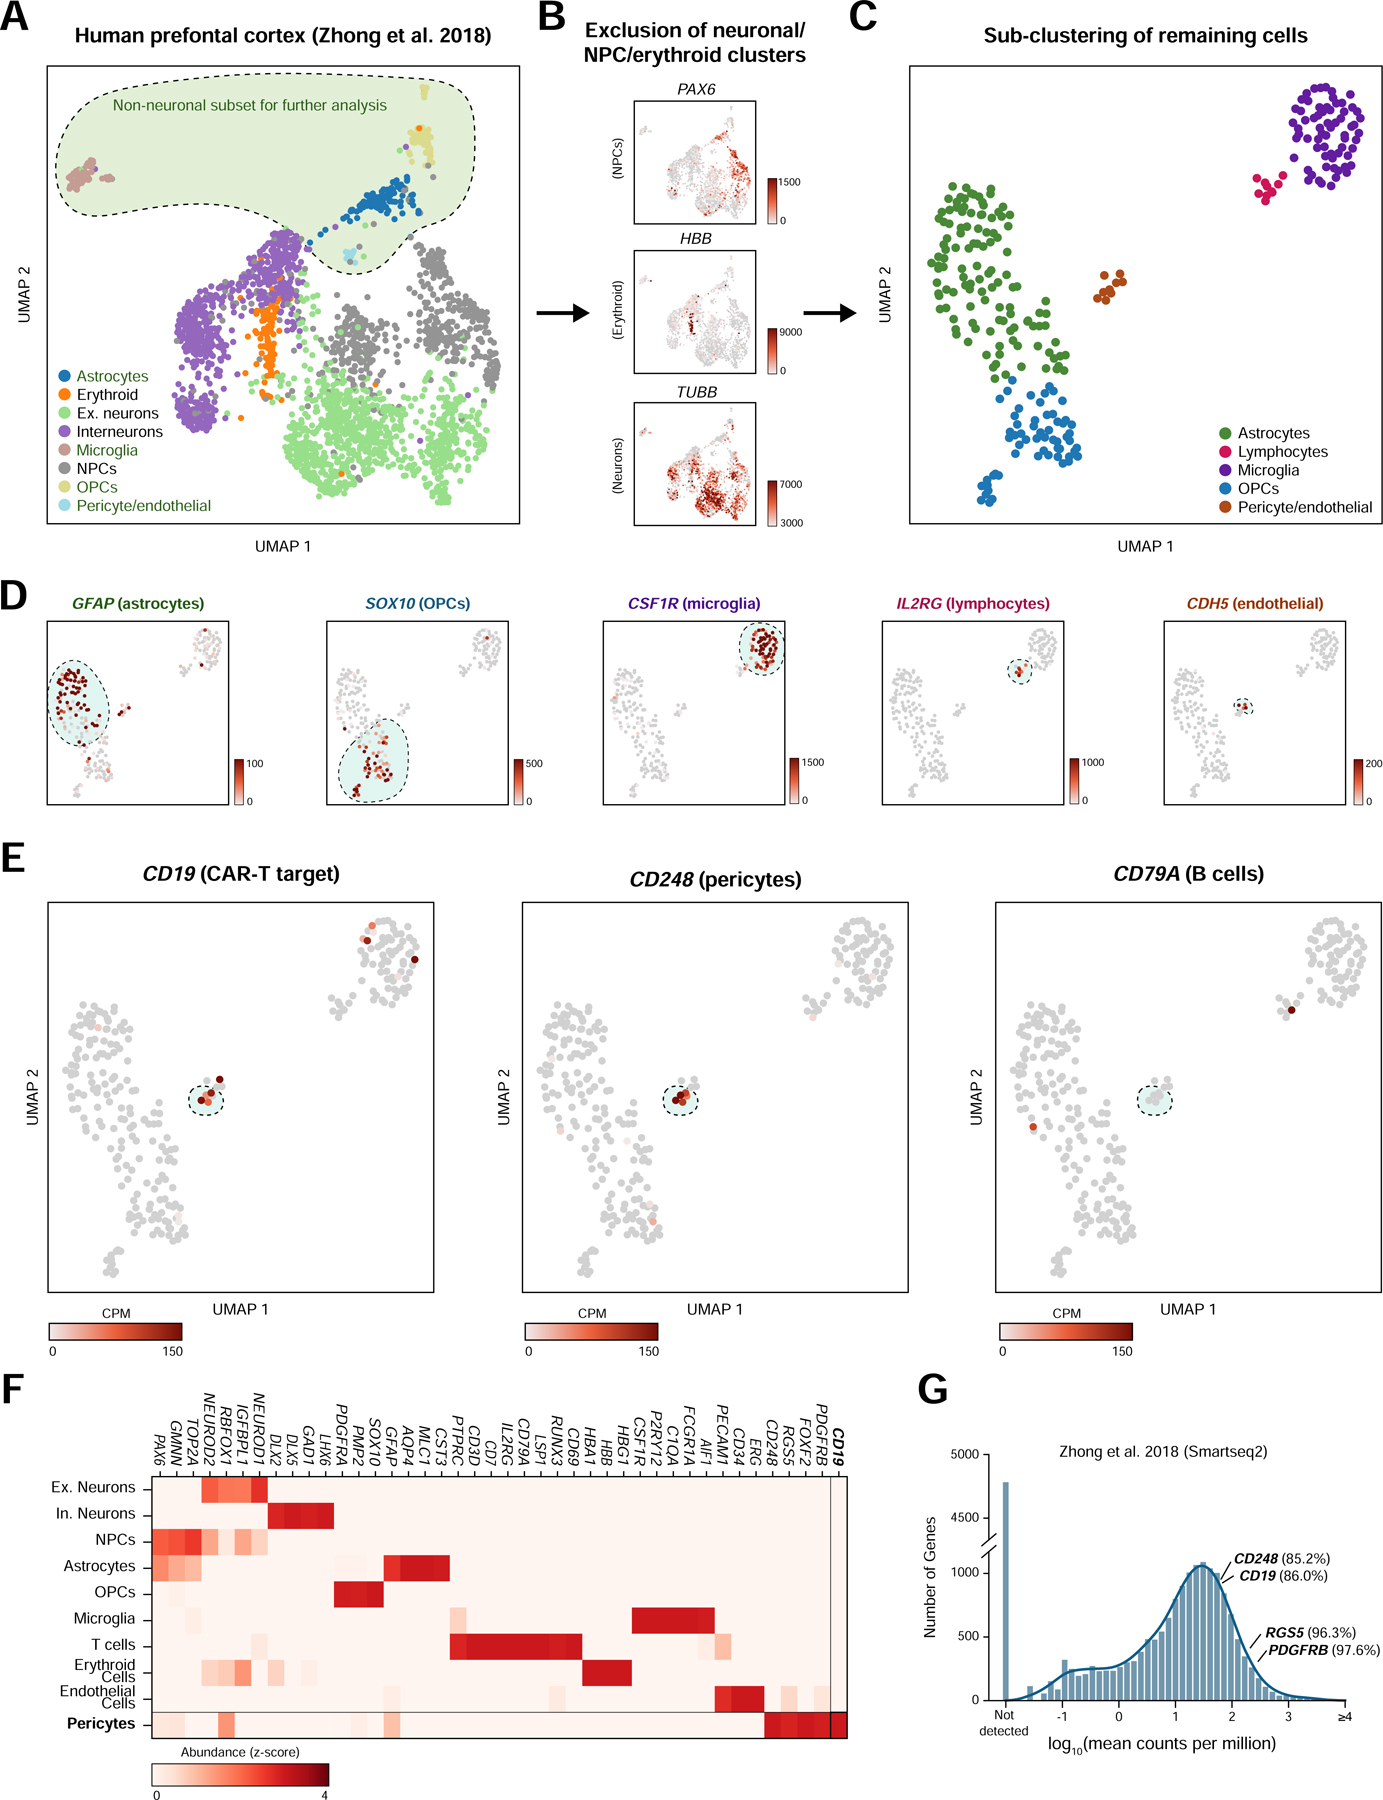
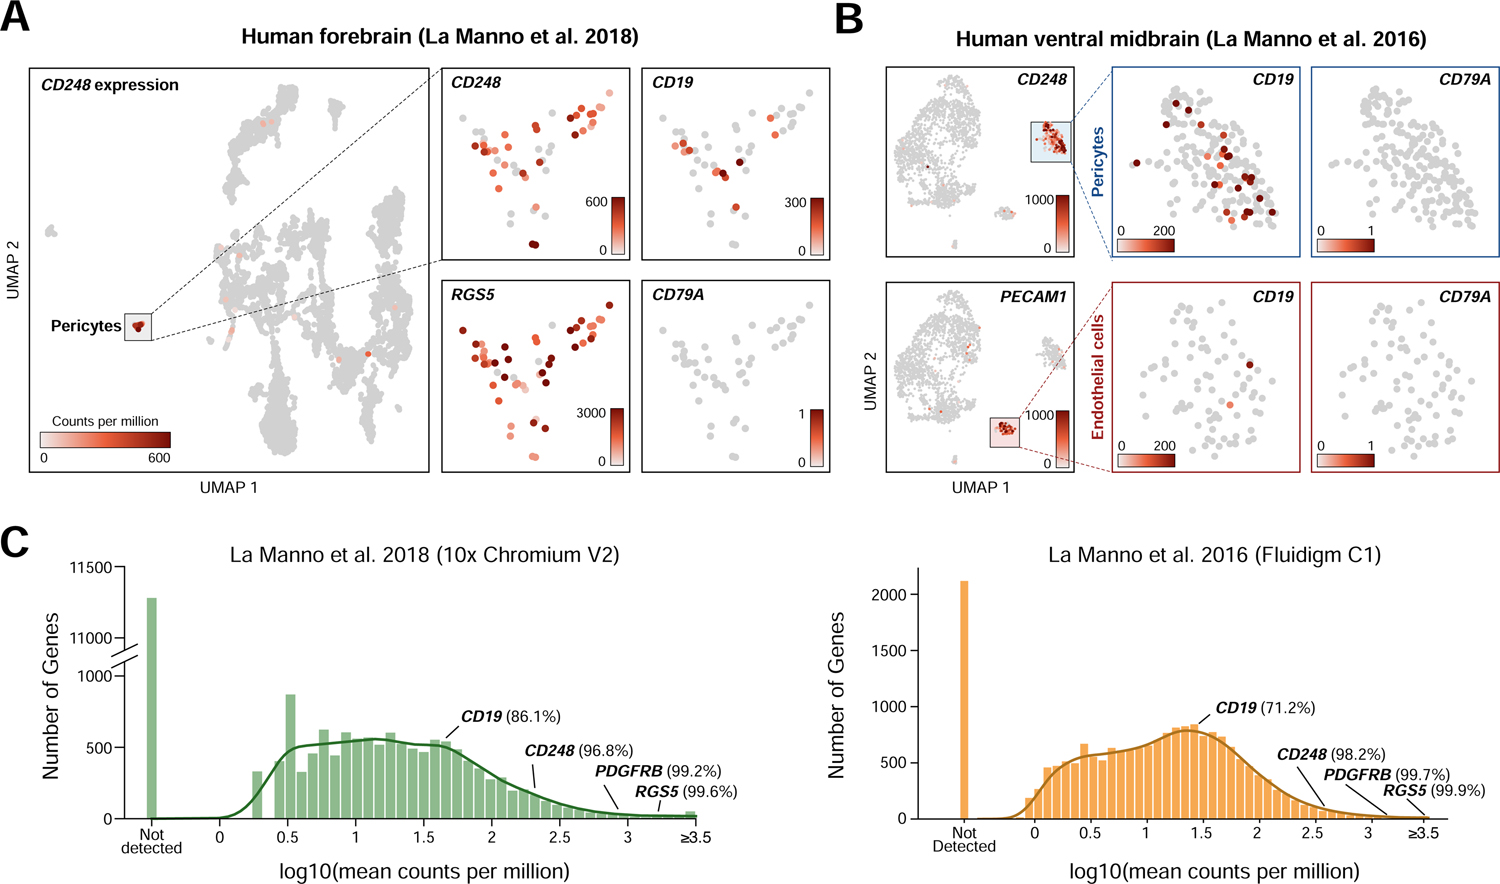
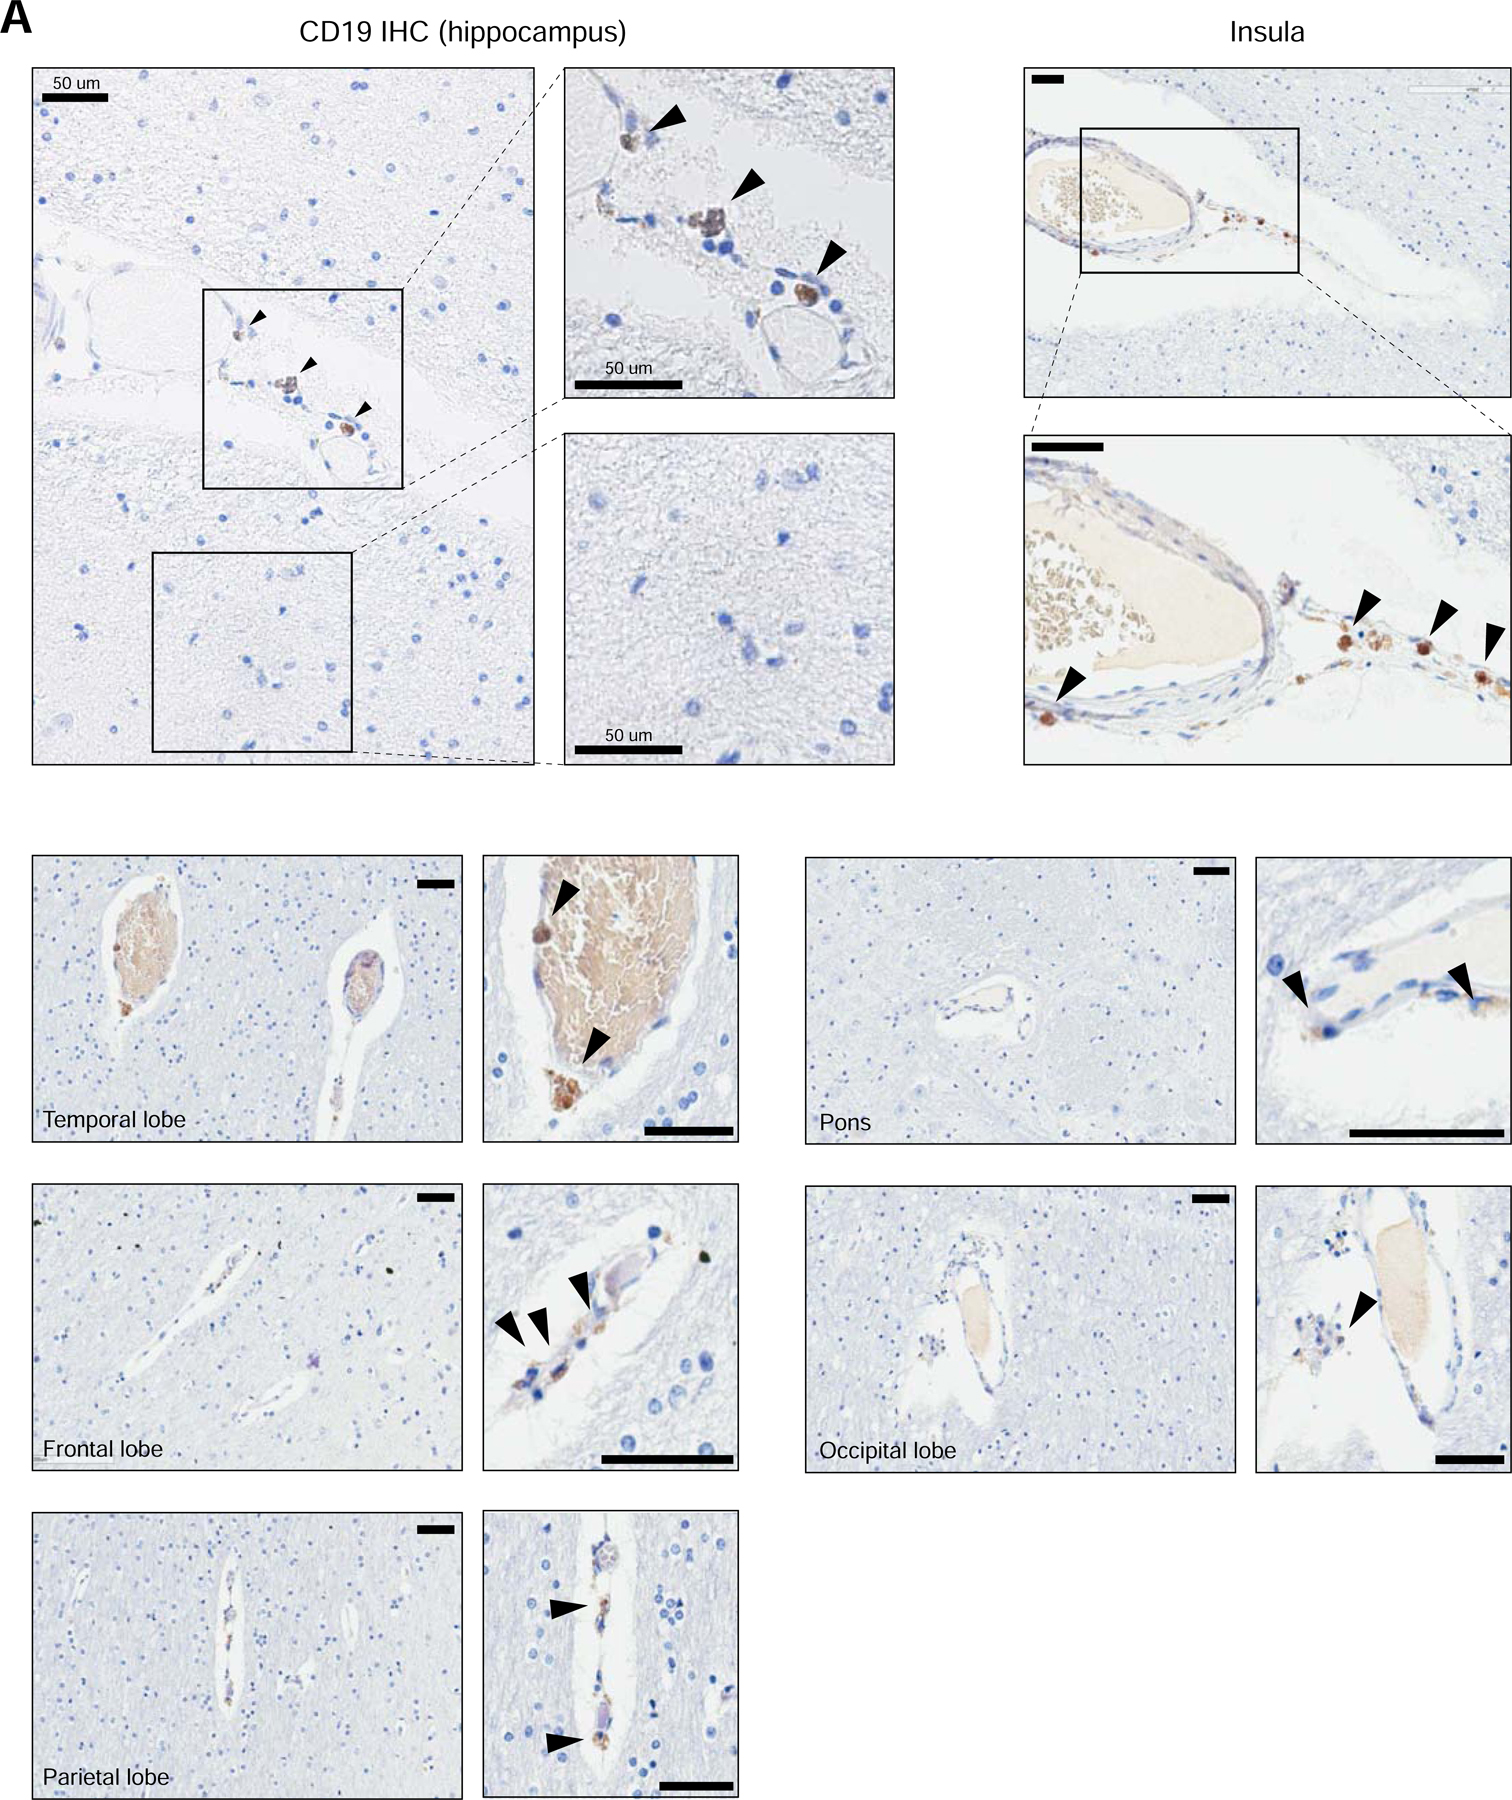
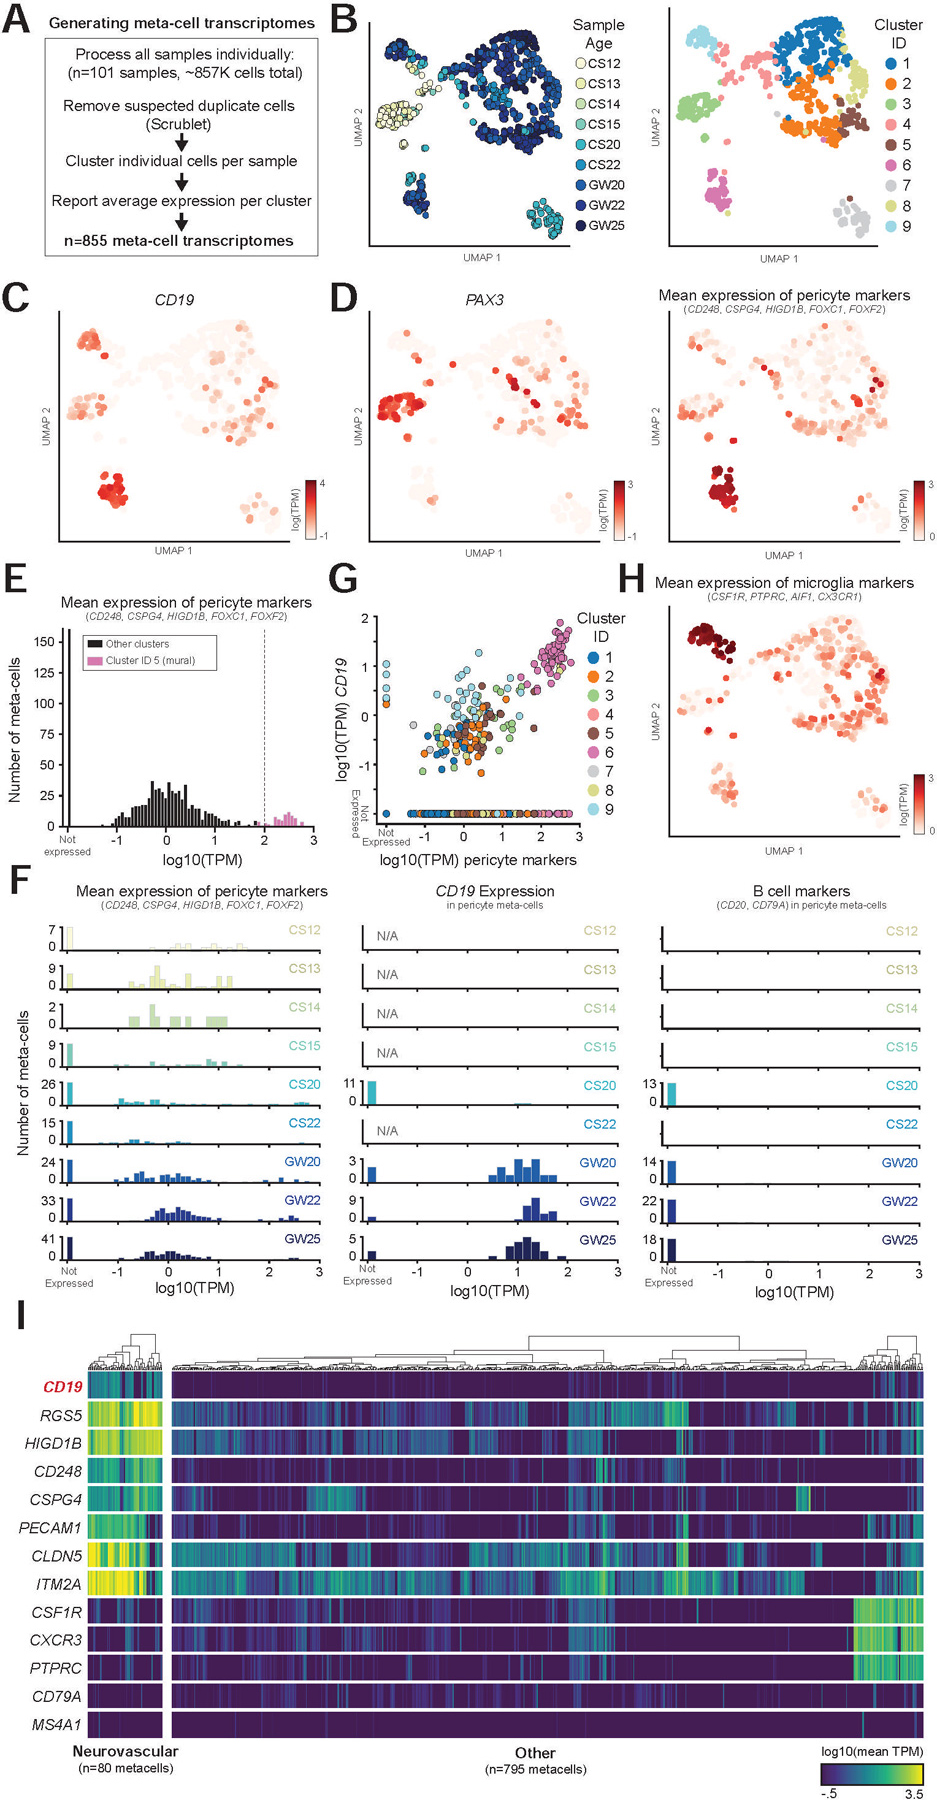
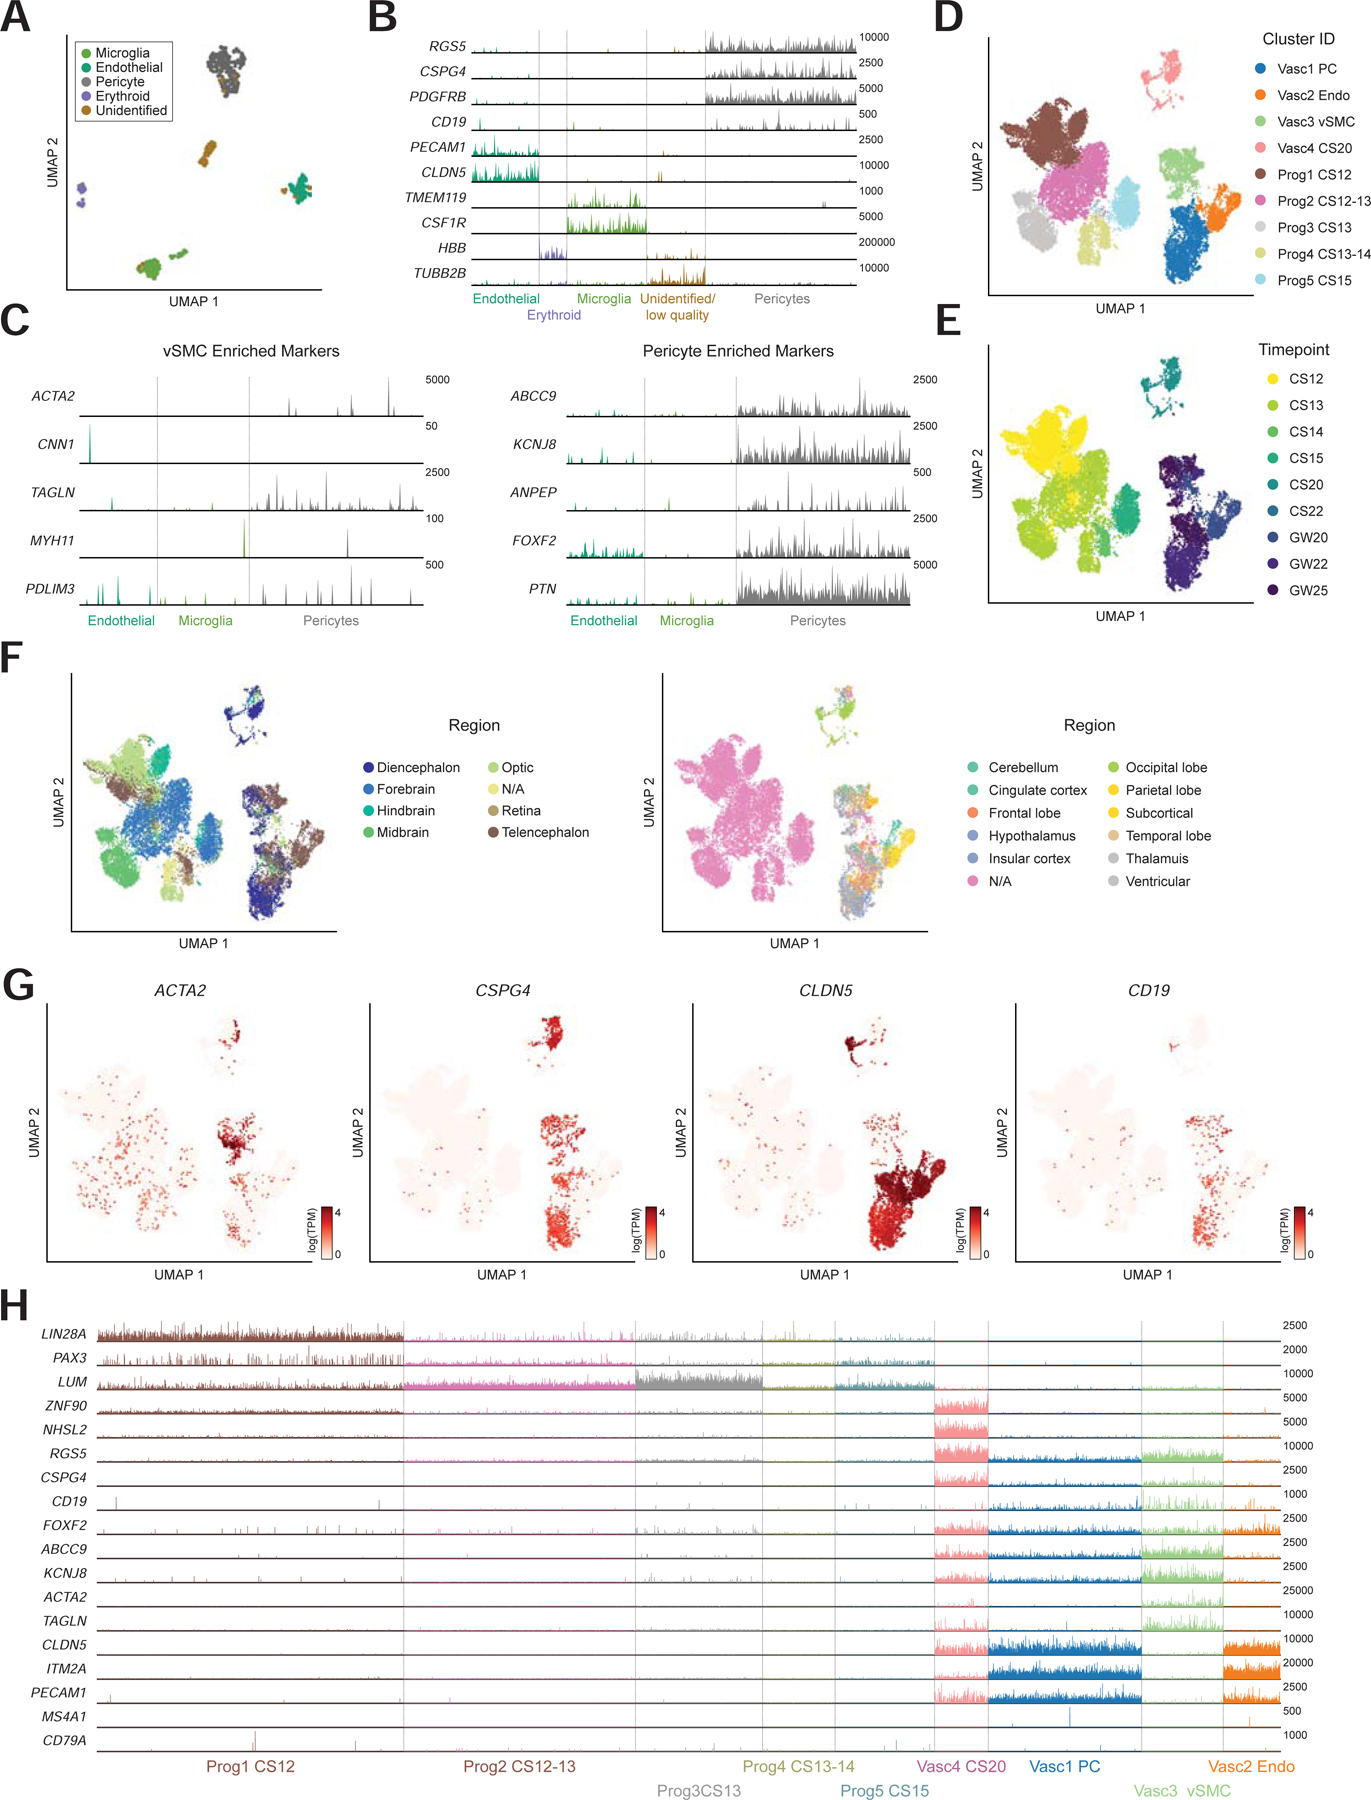
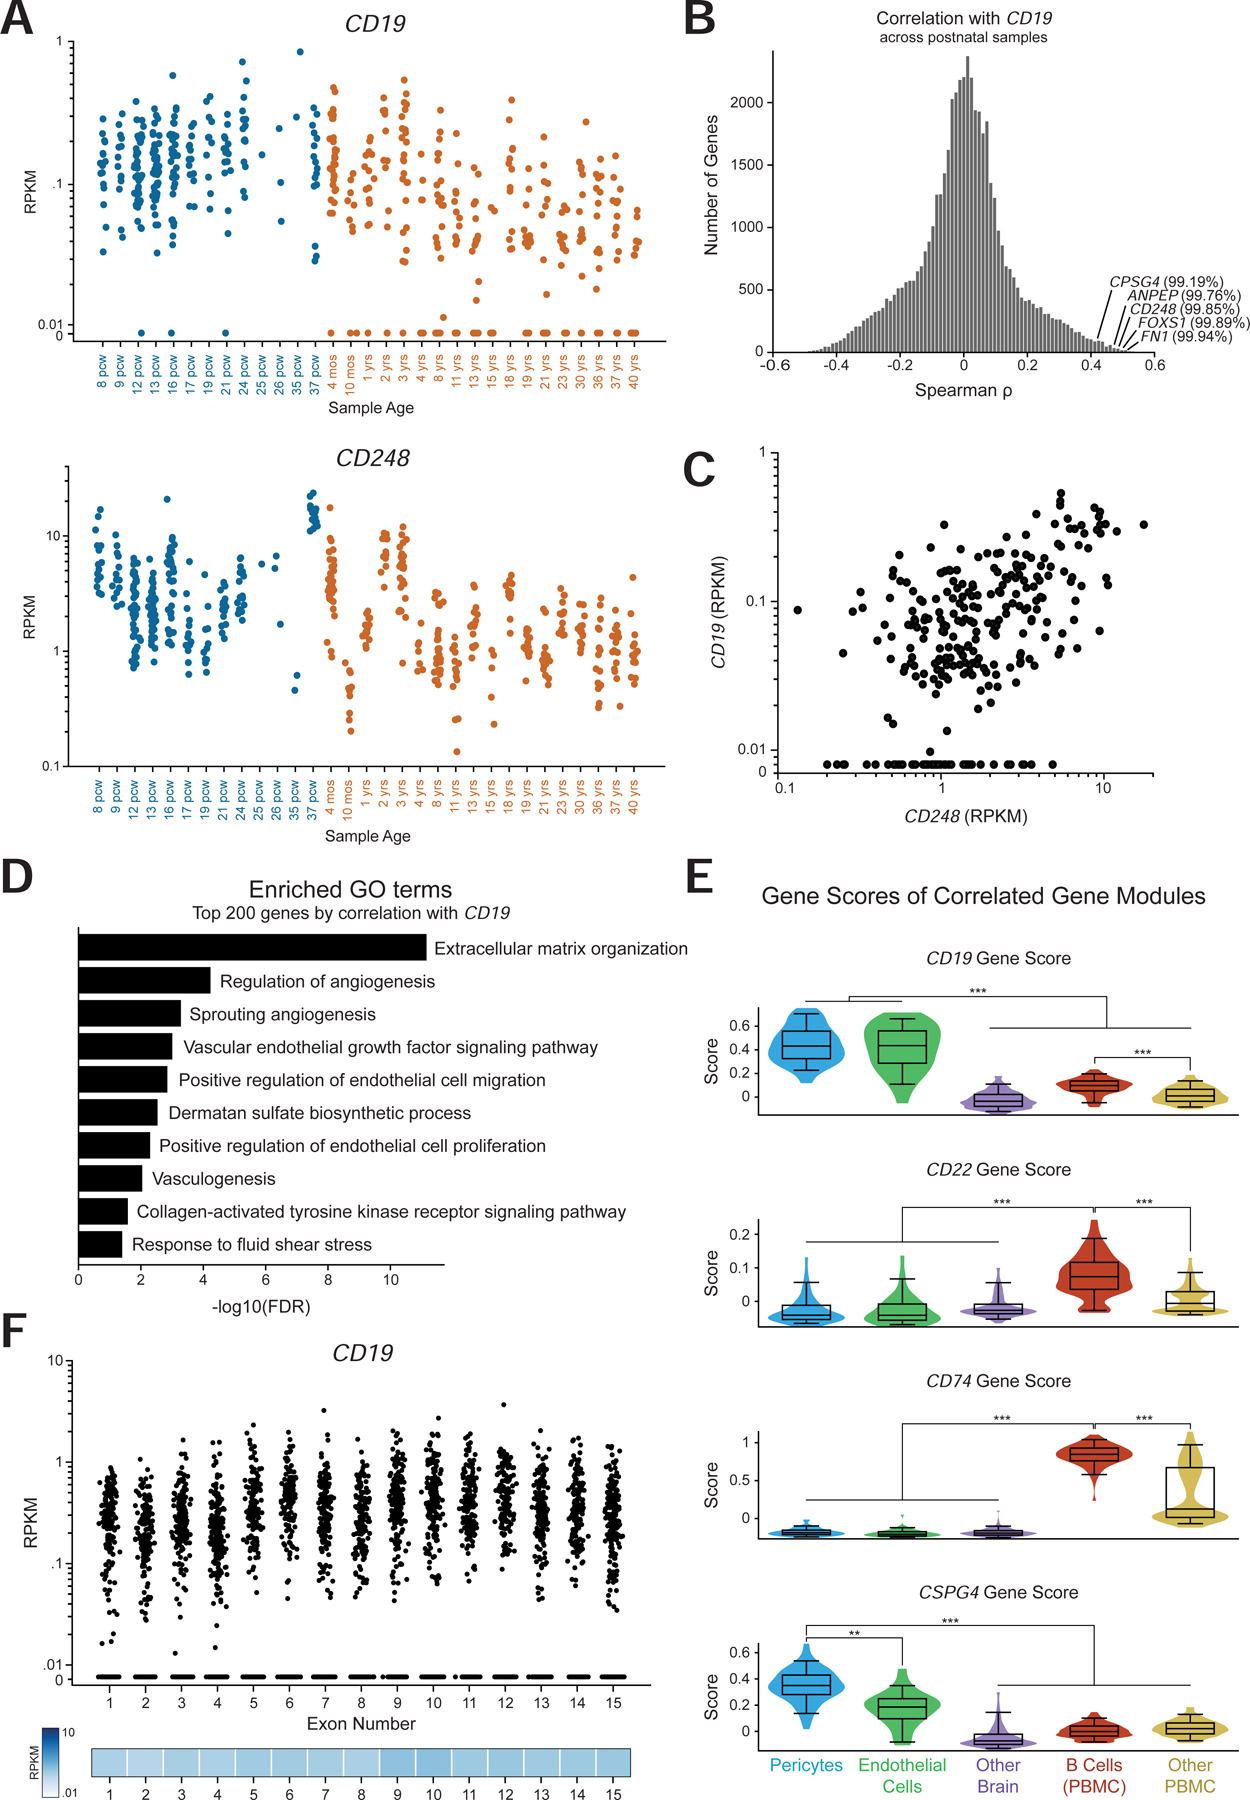
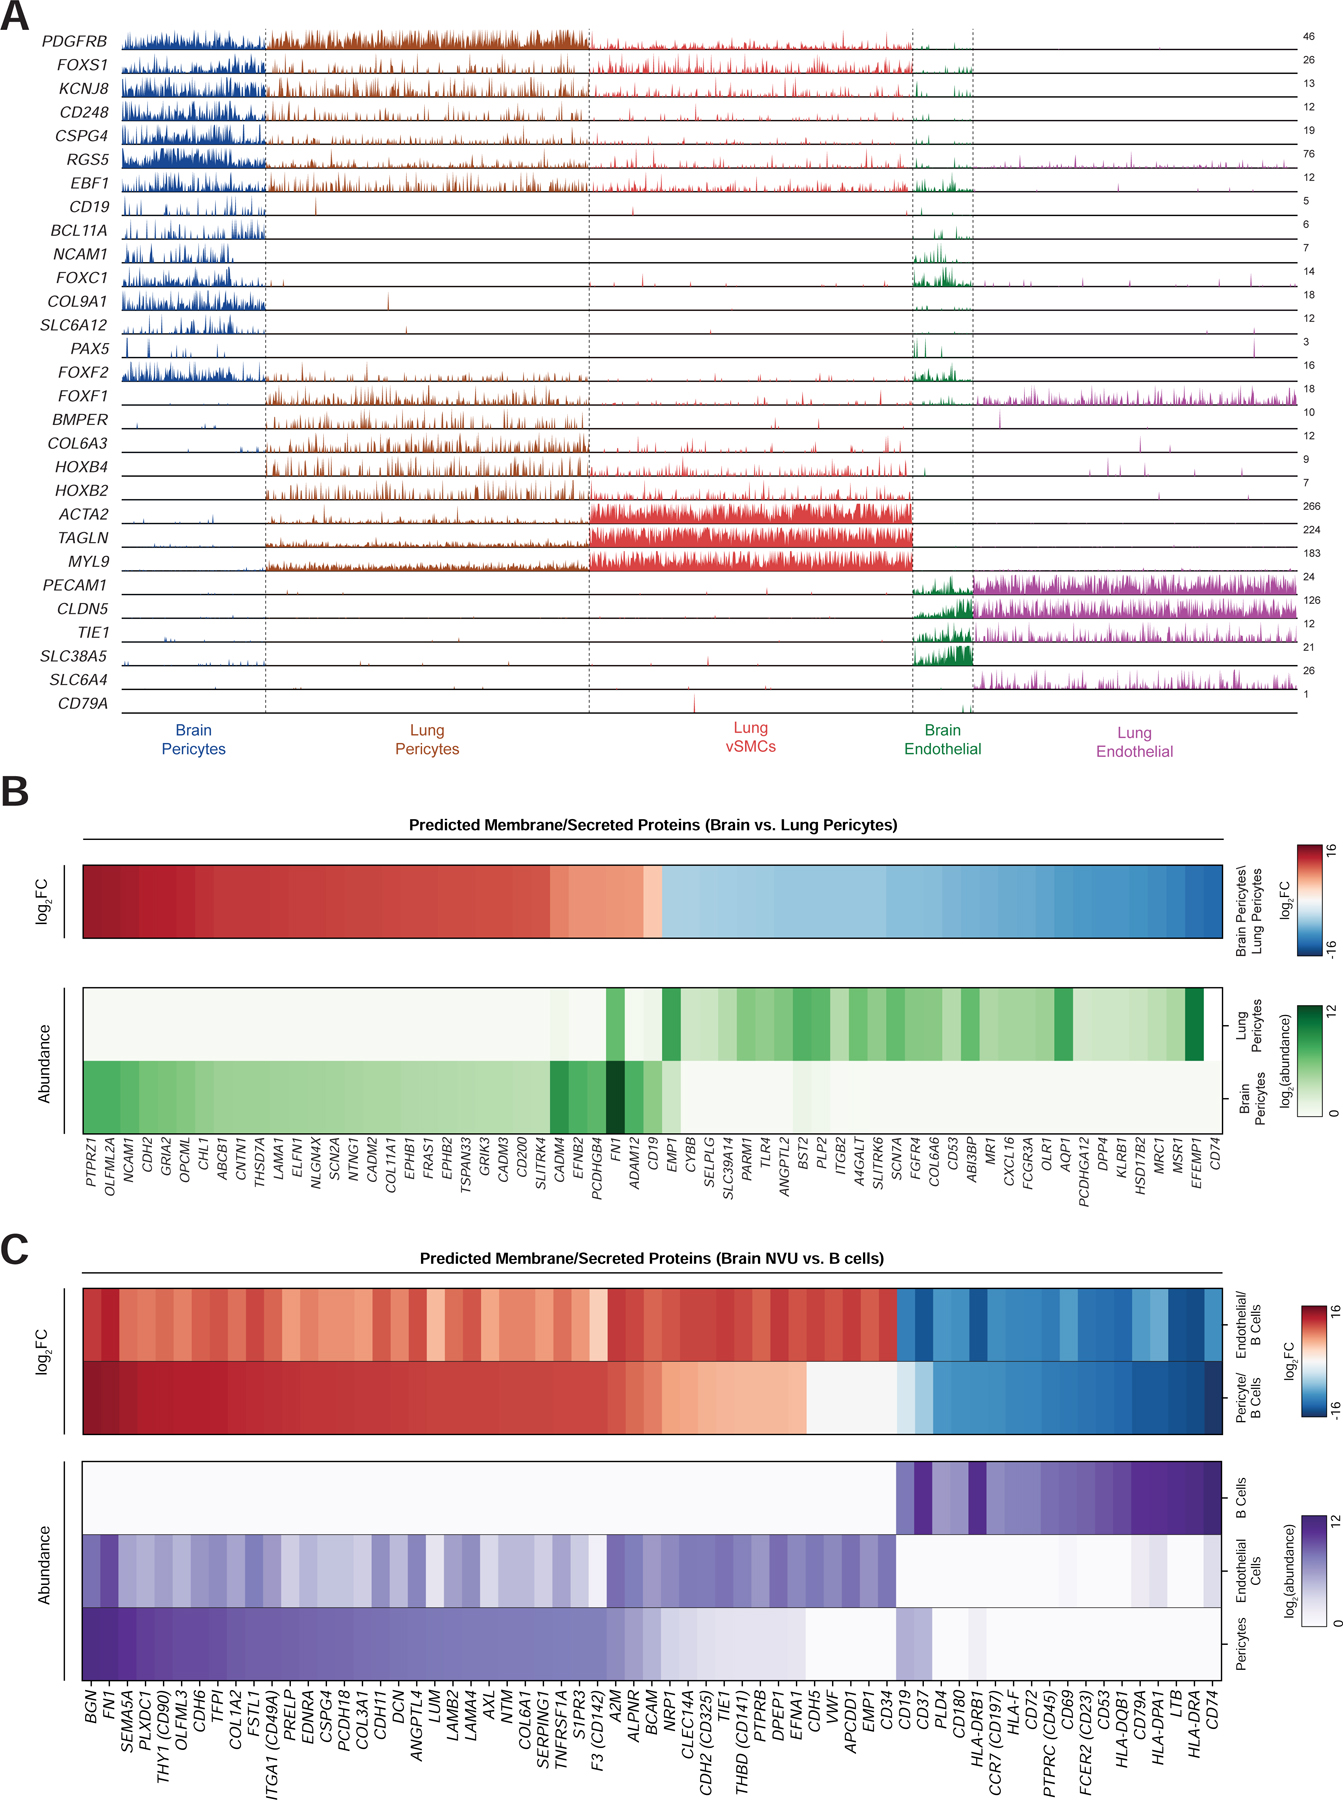
CD19-directed immunotherapies are clinically effective for treating B cell malignancies but also cause a high incidence of neurotoxicity. A subset of patients treated with chimeric antigen receptor (CAR) T cells or bispecific T cell engager (BiTE) antibodies display severe neurotoxicity, including fatal cerebral edema associated with T cell infiltration into the brain. Here, we report that mural cells, which surround the endothelium and are critical for blood-brain-barrier integrity, express CD19. We identify CD19 expression in brain mural cells using single-cell RNA sequencing data and confirm perivascular staining at the protein level. CD19 expression in the brain begins early in development alongside the emergence of mural cell lineages and persists throughout adulthood across brain regions. Mouse mural cells demonstrate lower levels of Cd19 expression, suggesting limitations in preclinical animal models of neurotoxicity. These data suggest an on-target mechanism for neurotoxicity in CD19-directed therapies and highlight the utility of human single-cell atlases for designing immunotherapies.


Conflict of interest statement

Declaration of Interests C.H.J. and A.D.P. report intellectual property licensed to Novartis and Tmunity Therapeutics related to CAR-T cells. K.R.P., A.T.S., H.Y.C., D.M., A.D.P., and C.H.J. are listed as inventors on patent applications filed by Stanford University and the University of Pennsylvania. K.R.P. is a consultant for Maze Therapeutics. A.T.S. is a scientific founder of Immunai and receives research funding from Arsenal Biosciences. H.Y.C. is a co-founder of Accent Therapeutics and Boundless Bio and an advisor to 10x Genomics, Arsenal Biosciences, and Spring Discovery.

Figures

Figure 1.
Figure 1.. Identification of CD19 expressing pericytes in single-cell RNA-sequencing data.
(A) UMAP projection of single-cell prefrontal cortex RNA-seq data. (B) The neuronal, neural progenitor cell, and erythroid clusters were identified as shown and subsequently excluded from further analysis. Unit, counts per million (CPM). (C) Non-neuronal cells are re-clustered and embedded using UMAP to more clearly distinguish populations. (D) Cell populations are identified by shown marker genes. Note that pericytes and endothelial cells are called as a single cluster but identifiable as separate populations by marker gene expression. Scale bar indicates CPM. (E) CD248-positive pericytes are also positive for the CAR-T target CD19 but negative for the B cell marker CD79A. (F) Heatmap showing relative gene abundances for specific marker genes across identified cell clusters. Pericytes are identified by PDGFRB, CD248, RGS5, and FOXF2 expression, and specifically express CD19. (G) Histogram of mean abundance of all genes in the human prefrontal cortex. Percentiles indicate the expression rank of a particular relative to all detected genes.
Figure 2.
Figure 2.. Confirmation of mural cell CD19 expression in two independent datasets.
(A–B) UMAP plots showing single cell RNA-seq data from (a) human forebrain (La Manno et al., 2018) and (b) human ventral midbrain (La Manno et al., 2016), colored by gene expression value, showing CD19 expression in pericytes. (C) Histogram of mean gene expression values (log10 counts per million) in identified pericyte cells in La Manno et al. 2018 and La Manno et al. 2016. Relative gene expression percentiles are shown for indicated genes.
Figure 3.
Figure 3.. Perivascular staining of CD19 in human brain.
Representative immunohistochemistry staining for CD19 in human brain tissue. FFPE samples were stained for CD19 with a clinical protocol. Representative staining is shown for the hippocampus, insula, temporal lobe, frontal lobe, parietal lobe, pons, and occipital lobe. Scale bar = 50 µm. 5 slides were stained for the hippocampus, and 10 slides were stained for other brain regions.
Figure 4.
Figure 4.. Meta-cell clustering identifies CD19 expression in human neurovascular meta-cells.
(A) Schematic showing how samples were processed (see Figure S2 for an example of a single dataset). (B) UMAP projection of meta-cells, colored by either sample age or cluster. (C–D) Expression of (c) CD19, (d) PAX3, marking undifferentiated progenitors, and mean expression of indicated pericyte marker genes. (E) Histogram of mean mural cell marker expression across all samples, showing separation of the identified neurovascular cell cluster. (F) Histogram as in (e), but separated by sample age, showing (left) pericyte marker gene expression, (middle) CD19 expression, (right) B cell marker gene expression. Note that CD19, but not B cell markers, are expressed in neurovascular meta-cells. (G) Scatter plot showing the correlation of pericyte marker genes with CD19 expression. Note the separation of the neurovascular cluster. (H) UMAP projection of meta-cells, colored by mean expression of microglia markers. (I) Heatmap showing log10 average TPM values for selected genes across meta-cells. Dendrograms indicate Ward’s hierarchical clustering of each of the two populations shown.
Figure 5.
Figure 5.. CD19 is expressed in both pericytes and vSMCs.
(A) Subset of non-neuronal cells from Zhong 2018, La Manno 2016, La Manno 2018. (B) expression of marker genes used for clustering. Max TPM per gene (y-axis) is indicated. (C) (left) low expression of vSMC marker genes and (right) high expression of pericyte marker genes. Y-axis labels indicate maximum TPM value shown. (D–F) Neurovascular and progenitor subset of BICCN data annotated by (d) cluster ID, (e) timepoint, or (f) region. Note that samples were annotated different levels of regional granularity, so resulting annotations are sometimes overlapping. (G) Expression of vSMC marker (ACTA2) as well as CSPG4 (pericyte) and CLDN5 (endothelial) markers. CD19 is expressed primarily in the vSMC and pericyte clusters. (H) Track plot showing lack of early developmental marker expression and distinguishing markers between vSMC and pericyte clusters. Y-axis labels indicate maximum TPM value shown.
Figure 6.
Figure 6.. The CAR-T recognized CD19 isoform is expressed in the adult human brain.
(A) Expression of CD19 (top) and CD248 (bottom) in data. Colors indicate prenatal and postnatal samples, and the different samples from distinct regions but the same age are plotted on the same x coordinate. (B) Histogram of the distribution of spearman correlation values for all genes with CD19 expression in only postnatal samples. The indicated percentiles indicate the percentile of that gene’s correlation. (C) Scatter plot of CD248 against CD19 RPKM values in only postnatal samples. (D) Enriched GO terms in the top 200 genes by spearman correlation with CD19. (E) Gene score distribution in single cells belonging to pericyte or endothelial clusters, as well as other brain cells; along with B cells and other PBMCs. Gene score was calculated with the top 30 genes by spearman correlation. (F) RPKM values per exon of CD19 in the Brainspan data, showing expression of the key exons 2 and 4 for CAR-T cell recognition.
Figure 7.
Figure 7.. Brain pericyte-specific expression of CD19.
(A) Track plot showing expression of selected marker genes for each population. Note that CD19 expression is limited to brain pericytes, but not lung pericytes. Additionally, brain pericytes express certain transcription factors, such as BCL11A, that are enriched in B cells. Y-axis labels indicate maximum TPM value. (B) (top) heatmap of log2 fold-change in gene expression of surface/secreted genes between brain and lung pericytes. (bottom) heatmap of expression of the same genes. Abundance data has been quantile-normalized to improve comparison of relative expression between the two populations. (C) heatmaps showing (top) log2 fold-change and (bottom) quantile-normalized abundance, as in (b). Comparisons are made between brain pericytes, brain endothelial cells, and B cells (from PBMCs), and genes are ordered by log2 fold-change between pericytes and B cells.

Comment in

References

    1. Armulik A, Genové G, Mäe M, Nisancioglu MH, Wallgard E, Niaudet C, He L, Norlin J, Lindblom P, Strittmatter K, et al. (2010). Pericytes regulate the blood–brain barrier. Nature 468, 557–561. - PubMed
    1. Bausch-Fluck D, Hofmann A, Bock T, Frei AP, Cerciello F, Jacobs A, Moest H, Omasits U, Gundry RL, Yoon C, et al. (2015). A mass spectrometric-derived cell surface protein atlas. PloS One 10, e0121314. - PMC - PubMed
    1. Boroujerdi A, Tigges U, Welser-Alves JV, and Milner R (2014). Isolation and culture of primary pericytes from mouse brain. Methods Mol. Biol. Clifton NJ 1135, 383–392. - PubMed
    1. Braig F, Brandt A, Goebeler M, Tony H-P, Kurze A-K, Nollau P, Bumm T, Böttcher S, Bargou RC, and Binder M (2017). Resistance to anti-CD19/CD3 BiTE in acute lymphoblastic leukemia may be mediated by disrupted CD19 membrane trafficking. Blood 129, 100–104. - PubMed
    1. Brentjens RJ, Latouche J-B, Santos E, Marti F, Gong MC, Lyddane C, King PD, Larson S, Weiss M, Rivière I, et al. (2003). Eradication of systemic B-cell tumors by genetically targeted human T lymphocytes co-stimulated by CD80 and interleukin-15. Nat. Med 9, 279–286. - PubMed

Publication types

MeSH terms