. 2021 Jan 7;28(1):127-140.e9.
doi: 10.1016/j.stem.2020.08.015. Epub 2020 Sep 21.

Deconstructing Stepwise Fate Conversion of Human Fibroblasts to Neurons by MicroRNAs

Affiliations

Deconstructing Stepwise Fate Conversion of Human Fibroblasts to Neurons by MicroRNAs

Kitra Cates et al. Cell Stem Cell. .

Abstract

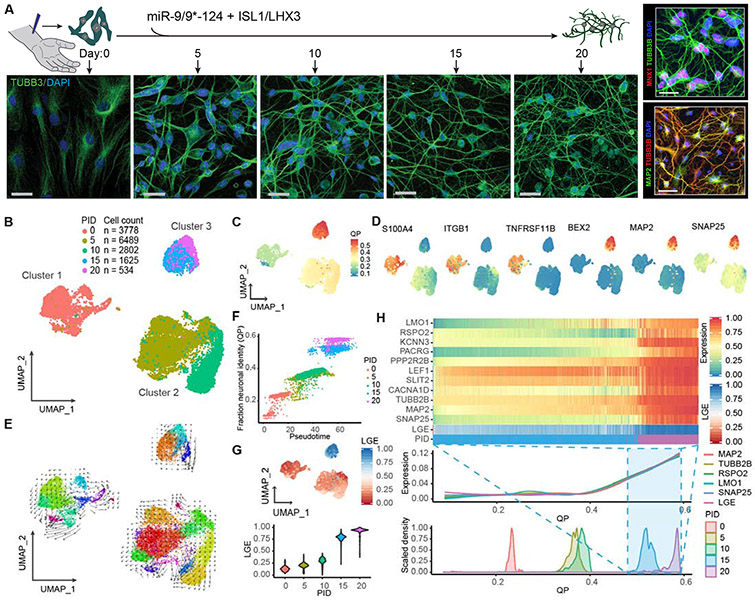
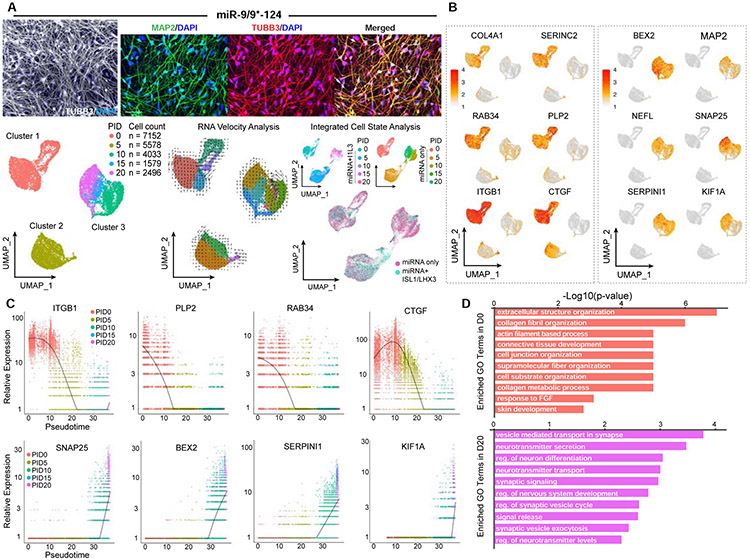
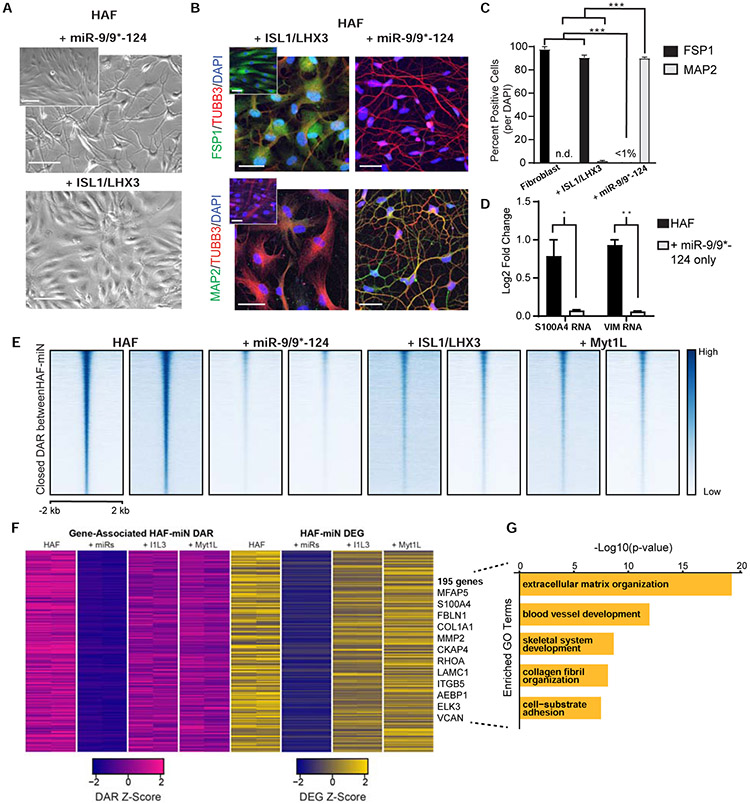
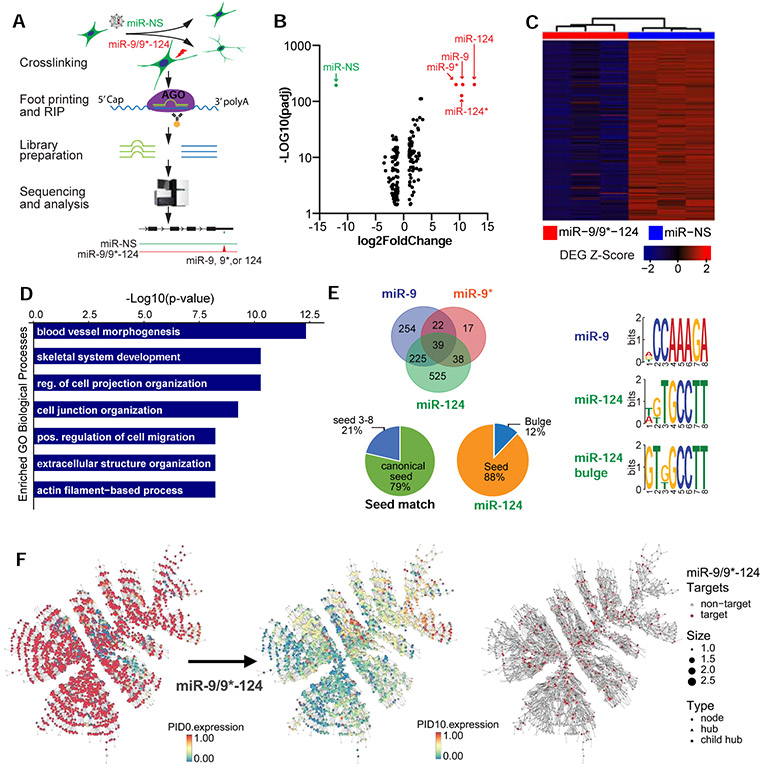
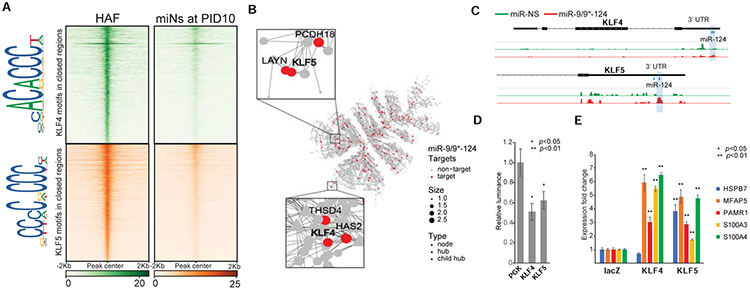
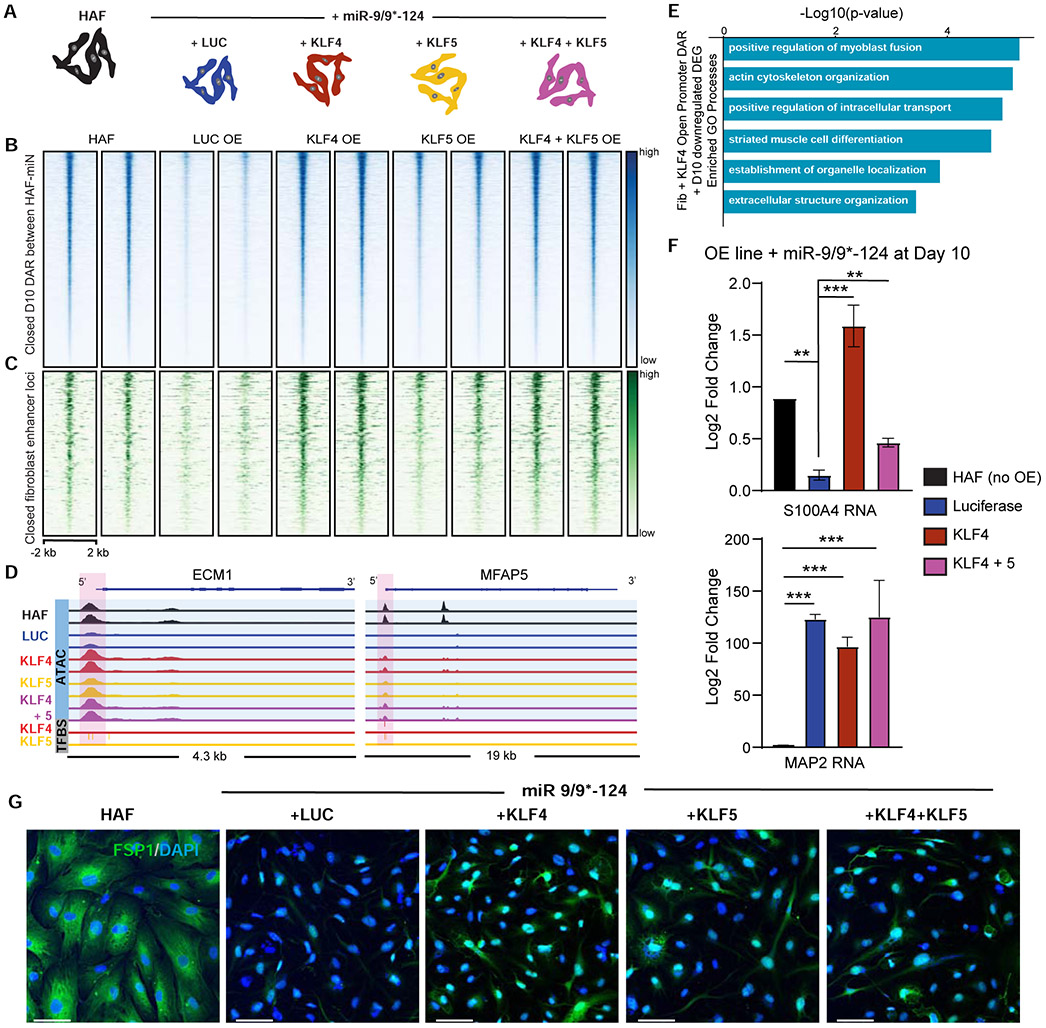
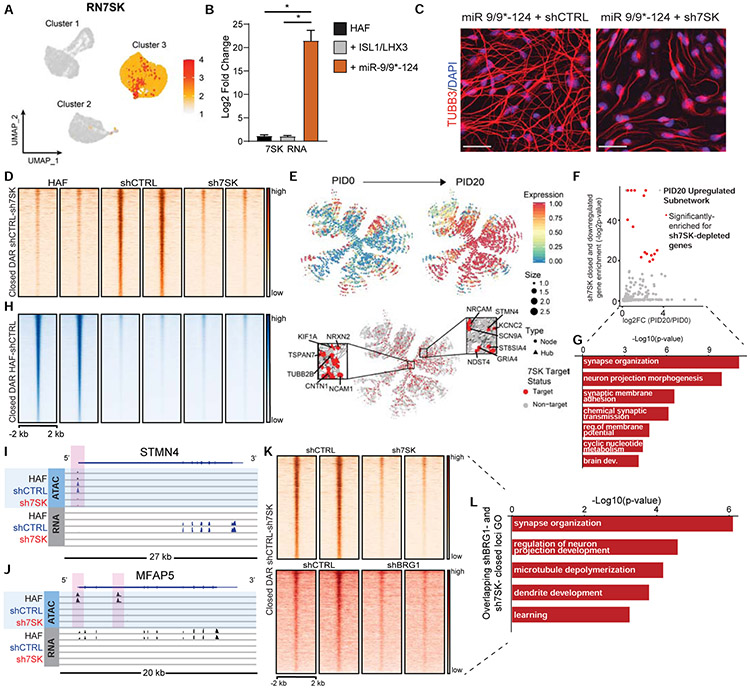
Cell-fate conversion generally requires reprogramming effectors to both introduce fate programs of the target cell type and erase the identity of starting cell population. Here, we reveal insights into the activity of microRNAs miR-9/9 and miR-124 (miR-9/9-124) as reprogramming agents that orchestrate direct conversion of human fibroblasts into motor neurons by first eradicating fibroblast identity and promoting uniform transition to a neuronal state in sequence. We identify KLF-family transcription factors as direct target genes for miR-9/9-124 and show their repression is critical for erasing fibroblast fate. Subsequent gain of neuronal identity requires upregulation of a small nuclear RNA, RN7SK, which induces accessibilities of chromatin regions and neuronal gene activation to push cells to a neuronal state. Our study defines deterministic components in the microRNA-mediated reprogramming cascade.

Keywords: cell fate; chromatin regulation; direct conversion; epigenetics; microRNA; neuronal reprogramming; non-coding RNA; single-cell RNA-sequencing.


Conflict of interest statement

Declaration of Interests The authors declare no competing interests.

Figures

Figure 1
Figure 1. Distinct reprogramming states of human fibroblasts to neurons by miR-9/9*-124 and ISL1/LHX3.
(A) Experimental scheme for studying cellular dynamics of neuronal reprogramming by miR-9/9*-124 and ISL1/LHX3. Human adult fibroblasts (HAFs) undergoing neuronal reprogramming were immunostained with TUBB3 to show morphological changes from day 0, 5, 10, 15, and 20. Scale bars, 20 μm. Right panel, top: Moto-miNs immunostained with motor neuron marker MNX1 and morphology marker TUBB3 at day 22. Scale bar, 23 μm. Right panel, bottom: Moto-miNs immunostained with neuronal marker MAP2 and TUBB3 at day 30. Scale bar, 45 μm. (B) UMAP projection of cells colored by time points (PID = post-induction day for microRNAs). (C) UMAP projection of cells colored by quadratic programing (QP) score. (D) UMAP projection of cells colored by expression of fibroblast-enriched genes (S100A4, ITGB1, TNFRSF11B) and neuronal genes (MAP2, BEX2, SNAP25). (E) RNA velocity analysis applied to the UMAP projection of cells, colored by sub-clusters. (F) Biplot showing the correlation between cell orders based on principle curve analysis (pseudotime) and fraction neuronal identity (QP). Cells are colored by time points. Pearson correlation coefficient = 0.94. (G) UMAP projection of cells colored by the median expression for the top 5% longest genes (LGE = long gene expression), and LGE violin plot of cells grouped by time point during reprogramming. (H) Heatmap showing expression (scaled 0-1 for each gene) of mature motor neuron markers and LGE scores (scaled 0-1) between PID 15 and 20. Cells are ordered from left to right by increasing QP scores. Aligned below are two plots also organized left to right by increasing QP scores: a Loess regression of neuronal gene expression, including total LGE, and a scaled density plot of QP scores grouped by time points.
Figure 2
Figure 2. miR-9/9*-124 alone are sufficient to induce homogenous fibroblast identity erasure and neuronal fate activation.
(A) Examples of conversion of HAFs cells with miR-9/9*-124-only. Left: A representative picture showing the morphologies of converted cells immunostained for TUBB3 (in gray). Scale bar, 20 μm. Top: Zoomed in pictures of converted cells stained for TUBB3 (left), MAP2 (middle), and merged (right). Scale bar, 50 μm. Bottom, left: Visualization of scRNA-seq data. UMAP projection of cells colored by time points. Bottom, center: RNA velocity analysis applied to the UMAP projection colored by sub-clusters. Bottom, right: Integrated cell state analysis plots of full time-course miN cell populations onto the full time-course moto-miN UMAP. (B) UMAP projection of cells colored by expression of fibroblast-enriched genes (COL4A1, SERINC2, RAB34, PLP2, ITGB1, CTGF) and neuronal genes (BEX2, MAP2, NEFL, SNAP25, SERPINI1, KIF1A). (C) Scatter plots showing the correlation between cell orders based on Monocle (pseudotime) and relative gene expression analyses. Cells are colored by time points. Top: Expression of fibroblast-enriched gene examples (ITGB1, PLP2, RAB34, CTGF) over pseudotime. Bottom: Expression of neuronal gene examples (SNAP25, BEX2, SERPINI1, KIF1A). D) Top Gene Ontology (GO) terms for biological processes of DEGs enriched in Day 0 compared to Day 20 (top, salmon) or Day 20 compared to Day 0 (bottom, purple).
Figure 3
Figure 3. miR-9/9*-124 alone induce early fibroblast gene program erasure.
(A) Phase contrast images of HAFs expressing either miR-9/9*-124 or ISL1/LHX3 alone at PID 7. Inset shows HAF controls. Scale bars, 130 μm. (B) Representative images of HAFs expressing ISL1/LHX3 or miR-9/9*-124 alone at PID 22. Top: Cells immunostained for fibroblast identity marker FSP1 (green) and morphology marker TUBB3 (red) over DAPI (blue). Bottom: Cells immunostained for neuronal marker MAP2 (green) and TUBB3 (red) over DAPI (blue). Both: Insets shows control HAFs. Scale bars, 45 μm. (C) Quantification of FSP1- and MAP2-positive cells over the total number of cells (DAPI) (*p < 0.05, ** p <0.01, *** p < 0.001). D) qPCR results for fibroblast gene expression (S100A4 and VIM) for HAF + miR-9/9*-124-only and control HAFs at PID 13 (* p < 0.05, ** p <0.01). Error bars represent s.e.m. (E) Heatmaps of ATAC-seq signal intensity for each sample mapped to differentially accessible regions (DAR) closed between HAFs and miR-9/9*-124 conditions (n = 20,869). Signals mapped within 2 kb of DAR peak center. (F) Heatmaps for gene expression levels for downregulated DEGs that positively-correlate with closed DAR signal intensity in promoter (± 2 kb transcriptional start site) or gene body regions. (G) Top GO terms for biological processes enriched in downregulated DEGs associated with closed DARs.
Figure 4
Figure 4. Targets of miR-9/9*-124 are enriched in non-neuronal gene networks.
(A) Overview of AGO-HITS-CLIP to identify targets of miR-9/9*-124 during neuronal conversion. (B) Aggregate analysis of miR-9/9*-124 and miR-NS conditions shows that miR-9, miR-9*, miR-124, and miR-124* (red) were enriched in RISC complex immunoprecipitated with AGO antibody relative to total input in contrast to the control miR-NS (green). (C) Heatmap of genes downregulated in miR-9/9*-124 condition over miR-NS at PID 7. Signal intensity is based on normalized CPM values, and data is shown as a z-score normalized log2CPM. (D) Top GO terms corresponding to downregulated miR-9/9*-124-target genes at PID 7. (E) RNAhybrid analysis of miR-9/9*-124 targets detected by AGO-HITS-CLIP (left). Various modes of seed positions on miRNAs were detected to pair with enriched peaks. Canonical seed = seed 1-6 or 2-7 of miRNAs. The miRNA binding motif analysis for miR-9, miR-124 seed-matches, and miR-124 bulge detected by MEME motif analysis. (F) Comparative gene expression analysis (scaled 0-1) of the top fibroblast-enriched network between days 0 and 10 of reprogramming. The fibroblast network is significantly enriched for targets of miR-9, miR-9*, and miR-124 as identified by AGO-HITS-CLIP (red).
Figure 5
Figure 5. KLF4 and KLF5 are key miR-9/9*-124 targets in fibroblast.
(A) Heatmaps of KLF4 and KLF5 binding site density within chromatin loci that close between Days 0 and 10 of miR-9/9*-124 expression. Legend depicts representative motifs for KLF4 and KLF5 binding sites within closed loci. (B) The top fibroblast network targeted by miR-9, miR-9*, and miR-124 as identified by AGO-HITS-CLIP (red) contains KLF4 and KLF5 as hubs in the network. (C) Representative IGV snapshots showing peaks enriched with miR-9/9*-124 (red) over miR-NS (green) expression within the KLF4 and KLF5 3’ UTRs. (D) Luciferase assay validation of KLF4 and KLF5 3’UTRs as repressive targets of miR-9/9*-124 in comparison to PGK 3’UTR as a negative control. (E) qPCR quantification of fibroblast genes (HSPB7, MFAP5, PAMR1, S100A3, S100A4) with LacZ (control), microRNA-resistant-KLF4 or -KLF5 overexpression with miR-9/9*-124.
Figure 6
Figure 6. miR-9/9*-124 repression of KLF4 and KLF5 is required for complete erasure of fibroblast identity.
(A) Experimental conditions for studying the role of KLF4 and KLF5 in miR-9/9*-124 reprogramming. (B) Heatmaps of ATAC-seq signal intensity mapped to DAR closed between HAF and miR-9/9*-124 conditions by PID 10 of reprogramming (n = 9,854). (C) Heatmaps of ATAC-seq signal intensity mapped to DAR closed between HAF and miR-9/9*-124 conditions by day 10 of reprogramming that overlap with fibroblast enhancer loci (n = 469). D) IGV snapshot showing ATAC-seq read coverage (blue) and KLF4/KLF5 transcription factor binding sites (grey) for the fibroblast-associated genes ECM1 and MFAP5. The LUC compared to KLF4 DAR peaks are highlighted in pink. (E) Top GO biological processes associated with downregulated DEGs in response to miR-9/9*-124, containing DARs that fail to close with prolonged expression of KLF4 compared to LUC control expression in day 10 of miRNA expression. (F) qPCR results for fibroblast (S100A4) and neuronal (MAP2) gene expression for LUC or KLF overexpression with miR-9/9*-124 and HAF controls at PID 10 (**p <0.01, *** p < 0.001). Error bars are s.e.m. (G) Representative images of HAFs expressing miR-9/9*-124 with LUC, KLF4, KLF5, or KLF4 and KLF5 at Day 10 immunostained for FSP1 (red) and DAPI (blue). Scale bars, 60 μm.
Figure 7
Figure 7. 7SK is a critical determinant of neuronal identity during reprogramming.
(A) UMAP projection of cells for RN7SK in the miR-9/9*-124-only scRNA-seq. (B) qPCR analysis of 7SK in HAFs expressing ISL1/LHX3 or miR-9/9*-124 for 12 days normalized to GAPDH expression. Error bars represent s.e.m. (*p < 0.05). (C) Representative images of HAFs expressing miR-9/9*-124 with either shCTRL or sh7SK at Day 20 immunostained for TUBB3 (red) and DAPI (blue). Scale bars, 50 μm. (D) Heatmaps of ATAC-seq signal intensity mapped to DAR (log2FC ≤ −1.5, FDR-adj. p-value < 0.01) closed between shCTRL and sh7SK conditions (n = 2,693). (E) PID 20-enriched neuronal network over PID 20 (top) and overlay of genes differentially downregulated by 7SK identified by RNA-seq (red). Insets show critical neuronal genes as hubs in the network targeted by 7SK. (F) P-values for enrichment of sh7SK-downregulated genes in each subnetwork against the mean log2FC in expression of PID20/PID0 of that subnetwork (Bonferroni-adj. p-values < 0.1; red subnetworks FC > 0.5). (G) Top GO function annotations with differentially accessible sh7SK DEGs. (H) The genomic distribution of significant (log2FC ≥ 1.5, FDR-adj. p-value < 0.01) DAR open in HAFs vs shCTRL (n=48,723). (I) IGV snapshot for ATAC- and RNA-seq signal for the neuronal gene STMN4 (sh7SK TSS-proximal DAR highlighted in pink). (J) IGV snapshot for ATAC- and RNA-seq signal for the fibroblast gene MFAP5 (shCTRL and sh7SK TSS-proximal DAR highlighted in pink). (K) Heatmaps of ATAC-seq signal intensity for miR-9/9*-124 with shCTRL or sh7SK (left) compared to miR-9/9*-124 with shCTRL or shBRG1 (right) overlapping at DAR between shCTRL and sh7SK conditions (n = 2,693). (L) Top GO function annotations for DAR-associated genes that fail to open in shBRG1 and sh7SK conditions (both comparisons: log2FC ≤−1, FDR-adj. p-value < 0.01).

Comment in

References

    1. Abernathy DG, Kim WK, McCoy MJ, Lake AM, Ouwenga R, Lee SW, Xing X, Li D, Lee HJ, Heuckeroth RO, et al. (2017). MicroRNAs Induce a Permissive Chromatin Environment that Enables Neuronal Subtype-Specific Reprogramming of Adult Human Fibroblasts. Cell Stem Cell 21, 332–348.e9. - PMC - PubMed
    1. Babos KN, Galloway KE, Kisler K, Zitting M, Li Y, Shi Y, Quintino B, Chow RH, Zlokovic BV, and Ichida JK (2019). Mitigating Antagonism between Transcription and Proliferation Allows Near-Deterministic Cellular Reprogramming. Cell Stem Cell 25, 486–500.e9. - PMC - PubMed
    1. Bailey TL, Boden M, Buske FA, Frith M, Grant CE, Clementi L, Ren J, Li WW, and Noble WS (2009). MEME SUITE: tools for motif discovery and searching. Nucleic Acids Res. 37, W202–208. - PMC - PubMed
    1. Bazi Z, Bertacchi M, Abasi M, Mohammadi-Yeganeh S, Soleimani M, Wagner N, and Ghanbarian H (2018). Rn7SK small nuclear RNA is involved in neuronal differentiation. J. Cell. Biochem 119, 3174–3182. - PubMed
    1. Becht E, McInnes L, Healy J, Dutertre C-A, Kwok IWH, Ng LG, Ginhoux F, and Newell EW (2018). Dimensionality reduction for visualizing single-cell data using UMAP. Nat. Biotechnol - PubMed

Publication types