. 2020 Nov 12;136(20):2249-2262.
doi: 10.1182/blood.2020005488.

Machine learning demonstrates that somatic mutations imprint invariant morphologic features in myelodysplastic syndromes

Affiliations

Machine learning demonstrates that somatic mutations imprint invariant morphologic features in myelodysplastic syndromes

Yasunobu Nagata et al. Blood. .

Abstract

Morphologic interpretation is the standard in diagnosing myelodysplastic syndrome (MDS), but it has limitations, such as varying reliability in pathologic evaluation and lack of integration with genetic data. Somatic events shape morphologic features, but the complexity of morphologic and genetic changes makes clear associations challenging. This article interrogates novel clinical subtypes of MDS using a machine-learning technique devised to identify patterns of cooccurrence among morphologic features and genomic events. We sequenced 1079 MDS patients and analyzed bone marrow morphologic alterations and other clinical features. A total of 1929 somatic mutations were identified. Five distinct morphologic profiles with unique clinical characteristics were defined. Seventy-seven percent of higher-risk patients clustered in profile 1. All lower-risk (LR) patients clustered into the remaining 4 profiles: profile 2 was characterized by pancytopenia, profile 3 by monocytosis, profile 4 by elevated megakaryocytes, and profile 5 by erythroid dysplasia. These profiles could also separate patients with different prognoses. LR MDS patients were classified into 8 genetic signatures (eg, signature A had TET2 mutations, signature B had both TET2 and SRSF2 mutations, and signature G had SF3B1 mutations), demonstrating association with specific morphologic profiles. Six morphologic profiles/genetic signature associations were confirmed in a separate analysis of an independent cohort. Our study demonstrates that nonrandom or even pathognomonic relationships between morphology and genotype to define clinical features can be identified. This is the first comprehensive implementation of machine-learning algorithms to elucidate potential intrinsic interdependencies among genetic lesions, morphologies, and clinical prognostic in attributes of MDS.


Conflict of interest statement

Conflict-of-interest disclosure: B.P.H. reports research funds from Amgen and is a scientific advisor for Presagia. The remaining authors declare no competing financial interests.

Figures

None
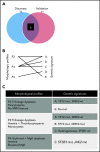
Graphical abstract
Figure 1.
Figure 1.
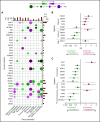
Associations between individual clinical features and somatic mutations. (A) Directions, magnitude, and strength of evidence of associations between pairs of selected morphologic features and genetic mutations are shown. Pairs shown have q values (P values corrected for multiple hypothesis testing) <0.1; larger dots represent stronger evidence. Color is used to depict the magnitude of pairwise odds ratios (OR): magenta represents cooccurring traits (positive association); green reflects mutually exclusive traits (negative association). (B-C) Estimated ORs and their confidence intervals for selected pairs of genetic mutations and dysplastic (B) or cytopenic (C) features. MgK, megakaryocyte.
Figure 2.
Figure 2.
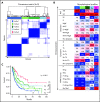
Morphologic profiles. (A) Consensus clustering applied to the discovery cohort reveals 5 morphologic profiles. (B) Distributions of each morphologic feature among the 5 morphologic profiles (P). Color is used to describe the prevalence of individual traits within each of the 5 profiles, with red depicting high and blue depicting low prevalence, respectively. (C) Kaplan-Meier curves for overall survival among patients identified by the 5 morphologic profiles. Survival differs significantly among the 5 profiles when evaluated using the log-rank test (*P < .05), demonstrating that the morphologic profiles confer prognostic utility. A, anemia; E, erythoroid dysplasia; Emg, elevated megakaryocytes; F, fibrosis; M, myeloid dysplasia; Mef, myelofibrosis; MgK, megakaryocytic dysplasia; Mnc, monocytosis; N, neutropenia; P, morphologic profiles; Th, thrombocytopenia.
Figure 3.
Figure 3.
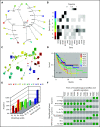
Genetic signatures in LR MDS demonstrate morphologic orientation. (A) Decision tree defining a genetic signature with 8 subtypes for LR MDS patients (LR-SA through LR-SH). The decision process initiates with SF3B1 (depicted with a square and orange arrow). Incidences of individual mutations are evaluated in a sequence to assign patients to the 8 subtypes. Plus and minus signs depict mutated and wild type, respectively. (B) Distributions of mutations within each genetic signature. Genes used in the decision tree are shown. (C) Network representation of the signature. Nodes define patients, color is used to describe their subtypes, and edges are drawn between neighboring patients with commensurate mutational patterns as defined by the statistical model. (D) Kaplan-Meier curves compare overall survival among patients assigned to the 8 genetic signatures; the P value is from the log-rank test. (E) Distribution of morphologic profiles among the genetic signatures. Frequent profiles (>30%) in each genetic signature are depicted. (F) The presence of specific morphologic features among morphologic profiles and genetic signatures. Morphologic parameters are ordered as rows; frequent pairs of morphologic profiles and genetic signature are displayed as columns.
Figure 4.
Figure 4.
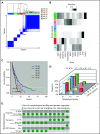
Genetic signatures in HR MDS. (A) Consensus clustering applied to genetic mutations identify a signature with 6 subtypes (HR-SA through HR-SF) among HR patients in the discovery cohort. (B) Distribution of mutations within each genetic signature. Frequently mutate genes (in ≥5% of patients) are shown. (C) Kaplan-Meier curves compare overall survival among patients identified by 6 genetic subtypes; the P value is from the log-rank test. (D) Distribution of morphologic profiles in each genetic signature. Frequent profiles (in >15% of patients) in each genetic signature are depicted. (E) The presence of specific morphologic features across morphologic profiles and genetic signatures. Representative morphologic features are shown in rows; frequent pairs of morphologic profiles and genetic signature are displayed as columns.
Figure 5.
Figure 5.
Validated morphologic profiles and genetic signatures. (A) Venn diagram depicts associations identified by LR patients for discovery and validation groups, respectively. After evaluating the significant pairs of morphologic profiles and genetic signatures in the discovery cohort for LR compared with those in the validation cohort for LR, 6 pairs (black box) were recapitulated in both. (B) Diagram depicting 6 validated morphologic and genetic associations. (C) Resultant validated associations between morphologic profiles and genetic signatures.

Comment in

References

    1. Vardiman JW, Thiele J, Arber DA, et al. . The 2008 revision of the World Health Organization (WHO) classification of myeloid neoplasms and acute leukemia: rationale and important changes. Blood. 2009;114(5):937-951. - PubMed
    1. Arber DA, Orazi A, Hasserjian R, et al. . The 2016 revision to the World Health Organization classification of myeloid neoplasms and acute leukemia [published correction appears in Blood. 2016;128(3):462-463]. Blood. 2016;127(20):2391-2405. - PubMed
    1. Stephenson J, Mufti GJ, Yoshida Y. Myelodysplastic syndromes: from morphology to molecular biology. Part II. The molecular genetics of myelodysplasia. Int J Hematol. 1993;57(2):99-112. - PubMed
    1. Cazzola M, Della Porta MG, Travaglino E, Malcovati L. Classification and prognostic evaluation of myelodysplastic syndromes. Semin Oncol. 2011;38(5):627-634. - PubMed
    1. Greenberg P, Cox C, LeBeau MM, et al. . International scoring system for evaluating prognosis in myelodysplastic syndromes. Blood. 1997;89(6):2079-2088. - PubMed

Publication types