

Towards Standardization of Data Normalization Strategies to Improve Urinary Metabolomics Studies by GC×GC-TOFMS
- PMID: 32961779
- PMCID: PMC7570207
- DOI: 10.3390/metabo10090376
Towards Standardization of Data Normalization Strategies to Improve Urinary Metabolomics Studies by GC×GC-TOFMS
Abstract
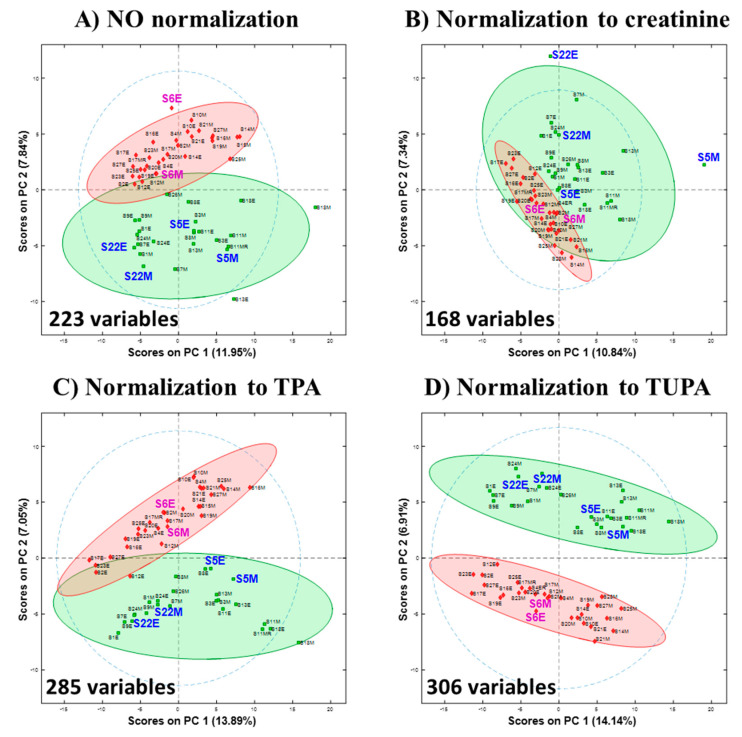
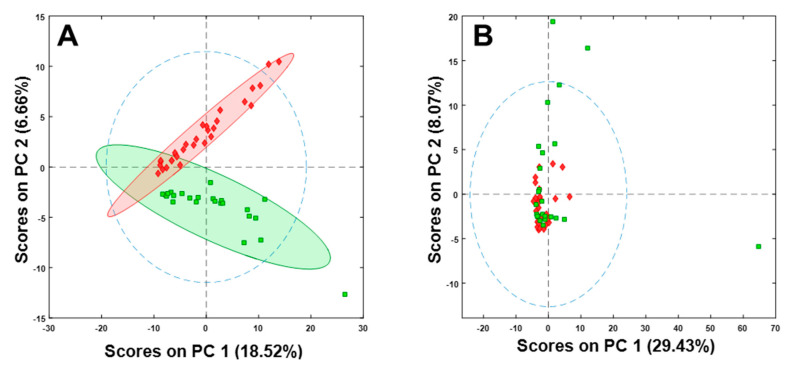
Urine is a popular biofluid for metabolomics studies due to its simple, non-invasive collection and its availability in large quantities, permitting frequent sampling, replicate analyses, and sample banking. The biggest disadvantage with using urine is that it exhibits significant variability in concentration and composition within an individual over relatively short periods of time (arising from various external factors and internal processes regulating the body's water and solute content). In treating the data from urinary metabolomics studies, one must account for the natural variability of urine concentrations to avoid erroneous data interpretation. Amongst various proposed approaches to account for broadly varying urine sample concentrations, normalization to creatinine has been widely accepted and is most commonly used. MS total useful signal (MSTUS) is another normalization method that has been recently reported for mass spectrometry (MS)-based metabolomics studies. Herein, we explored total useful peak area (TUPA), a modification of MSTUS that is applicable to GC×GC-TOFMS (and data from other separations platforms), for sample normalization in urinary metabolomics studies. Performance of TUPA was compared to the two most common normalization approaches, creatinine adjustment and Total Peak Area (TPA) normalization. Each normalized dataset was evaluated using Principal Component Analysis (PCA). The results showed that TUPA outperformed alternative normalization methods to overcome urine concentration variability. Results also conclusively demonstrate the risks in normalizing data to creatinine.
Keywords: GC×GC-TOFMS; creatinine; mass spectrometry; metabolomics; normalization; urine.
Conflict of interest statement
The authors declare no conflict of interest.
Figures
References
-
- Chen Y., Shen G., Zhang R., He J., Zhang Y., Xu J., Yang W., Chen X., Song Y., Abliz Z. Combination of Injection Volume Calibration by Creatinine and MS Signals’ Normalization to Overcome Urine Variability in LC-MS-Based Metabolomics Studies. Anal. Chem. 2013;85:7659–7665. doi: 10.1021/ac401400b. - DOI - PubMed
Grants and funding
LinkOut - more resources
Full Text Sources
