. 2020 Sep 18;9(9):884.
doi: 10.3390/antiox9090884.

The Transcriptomic Response of the Murine Thyroid Gland to Iodide Overload and the Role of the Nrf2 Antioxidant System

Affiliations

The Transcriptomic Response of the Murine Thyroid Gland to Iodide Overload and the Role of the Nrf2 Antioxidant System

Dionysios V Chartoumpekis et al. Antioxidants (Basel). .

Abstract

Background: Thyroid follicular cells have physiologically high levels of reactive oxygen species because oxidation of iodide is essential for the iodination of thyroglobulin (Tg) during thyroid hormone synthesis. Thyroid follicles (the functional units of the thyroid) also utilize incompletely understood autoregulatory mechanisms to defend against exposure to excess iodide. To date, no transcriptomic studies have investigated these phenomena in vivo. Nuclear erythroid factor 2 like 2 (Nrf2 or Nfe2l2) is a transcription factor that regulates the expression of numerous antioxidant and other cytoprotective genes. We showed previously that the Nrf2 pathway regulates the antioxidant defense of follicular cells, as well as Tg transcription and Tg iodination. We, thus, hypothesized that Nrf2 might be involved in the transcriptional response to iodide overload.

Methods: C57BL6/J wild-type (WT) or Nrf2 knockout (KO) male mice were administered regular water or water supplemented with 0.05% sodium iodide for seven days. RNA from their thyroids was prepared for next-generation RNA sequencing (RNA-Seq). Gene expression changes were assessed and pathway analyses were performed on the sets of differentially expressed genes.

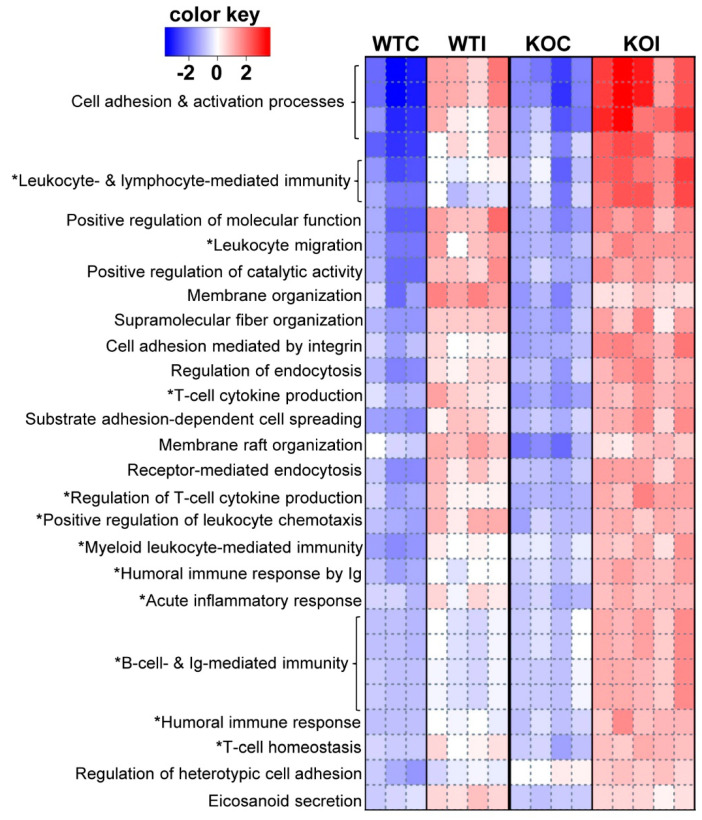
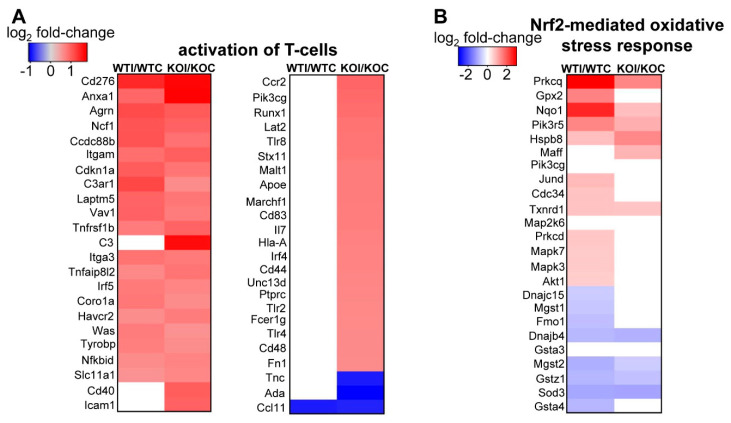
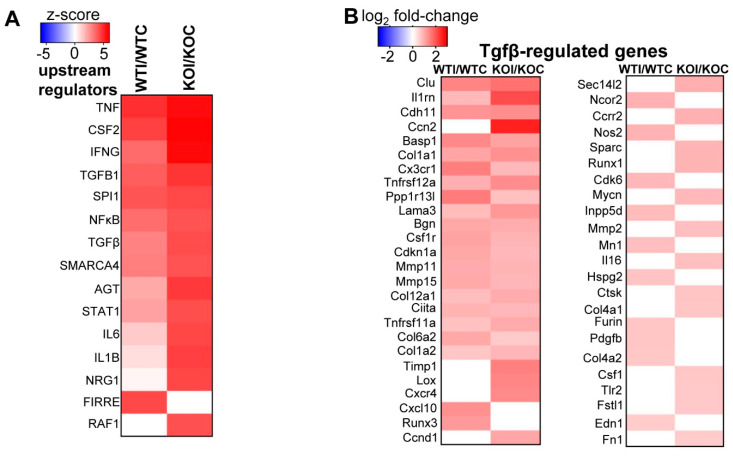
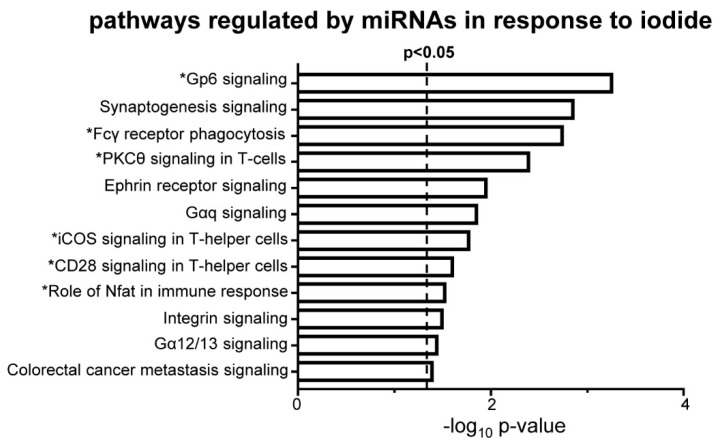
Results: Analysis of differentially expressed messenger RNAs (mRNAs) indicated that iodide overload upregulates inflammatory-, immune-, fibrosis- and oxidative stress-related pathways, including the Nrf2 pathway. Nrf2 KO mice showed a more pronounced inflammatory-autoimmune transcriptional response to iodide than WT mice. Compared to previously published datasets, the response patterns observed in WT mice had strong similarities with the patterns typical of Graves' disease and papillary thyroid carcinoma (PTC). Long non-coding RNAs (lncRNAs) and microRNAs (miRNAs) also responded to iodide overload, with the latter targeting mRNAs that participate mainly in inflammation pathways.

Conclusions: Iodide overload induces the Nrf2 cytoprotective response and upregulates inflammatory, immune, and fibrosis pathways similar to autoimmune hyperthyroidism (Graves' disease) and PTC.

Keywords: Kelch-like ECH-associated protein 1 (Keap1); Nfe2l2; RNA-Seq; fibrosis; immune response; inflammation; iodine; oxidative stress.


Conflict of interest statement

The authors declare no conflict of interest. The funders had no role in the design of the study; in the collection, analyses, or interpretation of data; in the writing of the manuscript, or in the decision to publish the results.

Figures

Figure 1
Figure 1
(A) Heatmap and clustering of the 1500 genes showing the most variable expression in the thyroids of the various cohorts of mice used for RNA sequencing (RNA-Seq). The heatmap was clustered by Euclidean distance and average linkage. Red color in the heatmap indicates higher expression and blue color indicates lower expression. (B) Principal component analysis (PCA) of RNA-Seq data. Of the total variance in gene expression, 29% can be attributed to PC1, which is correlated with treatment (p = 1.14 × 10⁻⁴), and 16% can be attributed to PC2, which is correlated with genotype (p = 3.74 × 10⁻⁵). (C) The 2000 most variable genes were clustered into groups using k-means clustering on the basis of their expression pattern across all samples followed by enrichment analysis for each cluster. The number of clusters was set to 4 following the “elbow method” (Figure S1B, Supplementary Materials). The enriched pathways for each cluster along with the p-values and genes in each pathway are shown in Table S1 (Supplementary Materials). Representative pathways for the largest clusters are indicated in the figure. Red color in the heatmap indicates higher expression while blue indicates lower expression. WTC: wild-type control mice (regular water); WTI: iodide-treated wild-type mice (0.05% NaI in water); KOC: nuclear erythroid factor 2 like 2 (Nrf2) knockout mice (regular water); KOI: iodide-treated Nrf2 knockout mice (0.05% NaI in water).
Figure 2
Figure 2
(A) Number of differentially expressed genes (DEGs) (messenger RNAs (mRNAs)) per comparison. The effect of iodide on wild-type (WT) mice (WTI/WTC) and on Nrf2 knockout (KO) mice (KOI/KO), as well as the effect of genotype (KOC/WTC) on gene expression, were assessed by the DESeq2 method, with a false discovery rate (FDR) set at 0.05 and the minimum gene expression fold change set at 1.5. Table S2 (Supplementary Materials) contains full lists of DEGs. (B) Venn diagrams with upregulated and downregulated genes (mRNAs) after iodide in WT and Nrf2 KO mice. (C) Volcano plots of genes that are differentially expressed (FDR < 0.05, fold change ≥ 1.5) in WT mice after iodide (WTI/WTC). (D) Volcano plots of genes that are differentially expressed (FDR < 0.05, fold change ≥ 1.5) in Nrf2 KO mice versus WT mice (KOC/WTC) without excess iodide. Some gene names are indicatively noted.
Figure 3
Figure 3
(A) RNA-Seq data validation by RT-PCR. Correlation of the expression fold changes between RNA-Seq and RT-PCR of 14 selected genes in WT mice after iodide treatment (WTI/WTC, circles and solid line, Pearson’s correlation coefficient r = 0.821, p = 0.0003), in Nrf2 KO mice after iodide (KOI/KOC, squares and dashed line, Pearson’s r = 0.858, p < 0.0001), and in Nrf2 KO versus WT without excess iodide (KOC/WTC, triangles and dashed line, Pearson’s r = 0.738, p = 0.0026). (B) Fold changes of each of the genes used for correlation analysis depicted according to the measurement method (black bars, RT-PCR; white bars, RNA-Seq) and the relevant comparison (WTI/WTC, KOI/KOC, or KOC/WTC). RT-PCR was performed in all study samples (WTC, n = 9; WTI, n = 12; KOC, n = 10; KOI, n = 10), while RNA-Seq was performed in 3/9, 4/12, 4/10, and 5/10 samples, respectively.
Figure 4
Figure 4
(A) Top canonical pathways enriched among DEGs (mRNAs) in Nrf2 KO mice compared to WT mice (KOC/WTC) ranked by p-value, as assessed by Ingenuity Pathway Analysis (IPA). The absolute z-score was set at ≥1.5. White bars indicate downregulation of the respective pathway (negative z-score), while black bars indicate upregulation of the respective pathway (positive z-score). The asterisk (*) before the pathway name indicates that it is relevant to Nrf2 signaling. (B) Top canonical pathways enriched in WT mice after iodide (WTI/WTC) ranked by p-value (as assessed by IPA). Absolute z-score was set at ≥2. Black bars indicate upregulation of the respective pathway (positive z-score). The asterisk (*) before the pathway name indicates that it is relevant to inflammatory/immune processes. Only pathways with −log10 p-value > 4 are depicted. Table S3 (Supplementary Materials) lists all enriched pathways with absolute z-score ≥ 2 and p < 0.05.
Figure 5
Figure 5
Pathway analysis of genes (mRNAs) that respond differentially to iodide among Nrf2 KO and WT mice using Parametric Gene Set Enrichment Analysis (PGSEA). The heatmap depicts the trend for each Gene Ontology (GO) biological process for each sample. Red squares indicate upregulation (positive z-score), while blue squares indicate downregulation (negative z-score). GO terms marked with an asterisk (*) refer to processes relevant to inflammation/autoimmunity. The top 30 pathways are shown, with FDR set at <0.05. Table S5 (Supplementary Materials) shows the z-score values for each pathway per sample and the respective p-values for each pathway.
Figure 6
Figure 6
(A) Heatmap of genes (mRNAs) that participate in the “activation of T-lymphocytes” process, which is enriched in Nrf2 KO mice after iodide as compared to WT mice after iodide. This process is upregulated in Nrf2 KO mice after iodide (z-score = 3.466, IPA algorithm), while, in WT mice, it is not enriched at all after iodide. Red color indicates upregulation by ≥1.5-fold, while blue color indicates downregulation by ≥1.5-fold (p < 0.05), and white color indicates gene expression change <1.5-fold and/or p ≥ 0.05. (B) Heatmap of genes (mRNAs) that participate in the “Nrf2-mediated oxidative stress response”, which is enriched in Nrf2 KO mice treated after iodide as compared to WT mice after iodide. This pathway is upregulated in WT mice after iodide (z-score = 2.333, IPA algorithm), while, in Nrf2 KO mice, it is not enriched at all after iodide. Color-coding in the heatmap is similar to that in panel A.
Figure 7
Figure 7
(A) Comparison of predicted upstream regulators of mRNAs differentially expressed after iodide treatment in WT mice as compared to Nrf2 KO mice (WTI/WTC vs. KOI/KOC, z-score ≥4 and p < 0.01). Red color indicates upregulation (positive z-score), while white color indicates absence of enrichment of the upstream regulator. The graph was generated by the comparison analysis of IPA. (B) Gene expression heatmap of genes that participate in the fibrosis pathway, which is predicted to be upregulated by the enriched upstream regulator TGFβ after iodide. Red color indicates ≥1.5-fold upregulation (p < 0.05), while white color indicates gene expression change <1.5-fold and/or p ≥ 0.05. The right column continues after the left one. Genes are presented from top to bottom from lower to higher p-value in either comparison (WTI/WTC, KOI/KOC).
Figure 8
Figure 8
(A) Heatmap and clustering of differentially expressed microRNAs (miRNAs) and long non-coding RNAs (lncRNAs) based on standardized expression values. Samples are in columns and lncRNAs or miRNAs are in rows. Red color in the heatmap indicates higher expression and blue color indicates lower expression. Symbols indicate the group to which each sample belongs: &, WTC; #, WTI; *, KOC; ~, KOI. (B) Volcano plot of lncRNAs that were differentially expressed after iodide (WTI/WTC). Red color indicates significant upregulation, while blue color indicates significant downregulation (≥2-fold, p < 0.05), and gray color indicates gene expression change < 2-fold and/or p ≥ 0.05.
Figure 9
Figure 9
Enriched canonical pathways of mRNAs that are differentially expressed after iodide treatment (WTI/WTC, ≥1.5-fold change and p < 0.05) and are regulated by miRNAs that are also differentially expressed in the same samples. Analysis was performed using IPA with absolute z-score set at ≥1.5 and p < 0.05. White bars indicate upregulated pathways. Pathways marked with an asterisk (*) refer to processes relevant to inflammation/autoimmunity.
Figure 10
Figure 10
Comparison analyses using IPA of the top 40 enriched canonical pathways (z-score ≥2 and p < 0.05) in the thyroid in different pathophysiological settings. (A) Comparison of WT iodide-treated vs. non-treated mice (WTI/WT) and a genetic mouse model of Graves’ disease vs. respective WT controls (publicly available at Gene Expression Omnibus GSM955426-GSM955427). (B) Comparison of WT iodide-treated vs. non-treated mice (WTI/WT) and of human papillary thyroid carcinoma (PTC) vs. non-cancerous thyroid tissue from the same patient (publicly available at Gene Expression Omnibus GSM77362-GSM77379).

References

    1. Leoni S.G., Kimura E.T., Santisteban P., De la Vieja A. Regulation of thyroid oxidative state by thioredoxin reductase has a crucial role in thyroid responses to iodide excess. Mol. Endocrinol. 2011;25:1924–1935. doi: 10.1210/me.2011-0038. - DOI - PMC - PubMed
    1. Ziros P.G., Habeos I.G., Chartoumpekis D.V., Ntalampyra E., Somm E., Renaud C.O., Bongiovanni M., Trougakos I.P., Yamamoto M., Kensler T.W., et al. NFE2-Related Transcription Factor 2 Coordinates Antioxidant Defense with Thyroglobulin Production and Iodination in the Thyroid Gland. Thyroid. 2018;28:780–798. doi: 10.1089/thy.2018.0018. - DOI - PMC - PubMed
    1. Vitale M., Di Matola T., D’Ascoli F., Salzano S., Bogazzi F., Fenzi G., Martino E., Rossi G. Iodide excess induces apoptosis in thyroid cells through a p53-independent mechanism involving oxidative stress. Endocrinology. 2000;141:598–605. doi: 10.1210/endo.141.2.7291. - DOI - PubMed
    1. Yamamoto M., Kensler T.W., Motohashi H. The KEAP1-NRF2 System: A Thiol-Based Sensor-Effector Apparatus for Maintaining Redox Homeostasis. Physiol. Rev. 2018;98:1169–1203. doi: 10.1152/physrev.00023.2017. - DOI - PMC - PubMed
    1. Sihvola V., Levonen A.L. Keap1 as the redox sensor of the antioxidant response. Arch Biochem. Biophys. 2017;617:94–100. doi: 10.1016/j.abb.2016.10.010. - DOI - PubMed

LinkOut - more resources