. 2020 Sep 18;21(18):6858.
doi: 10.3390/ijms21186858.

Preventive Triple Gene Therapy Reduces the Negative Consequences of Ischemia-Induced Brain Injury after Modelling Stroke in a Rat

Affiliations

Preventive Triple Gene Therapy Reduces the Negative Consequences of Ischemia-Induced Brain Injury after Modelling Stroke in a Rat

Vage Markosyan et al. Int J Mol Sci. .

Abstract

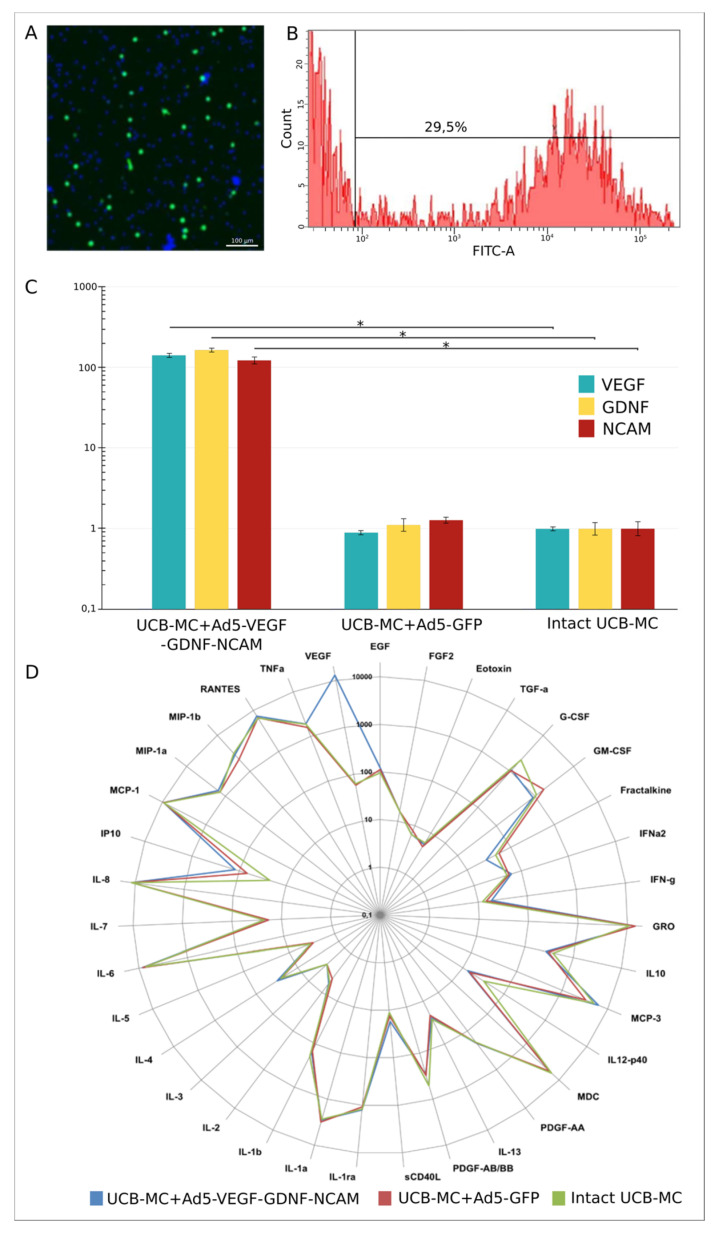
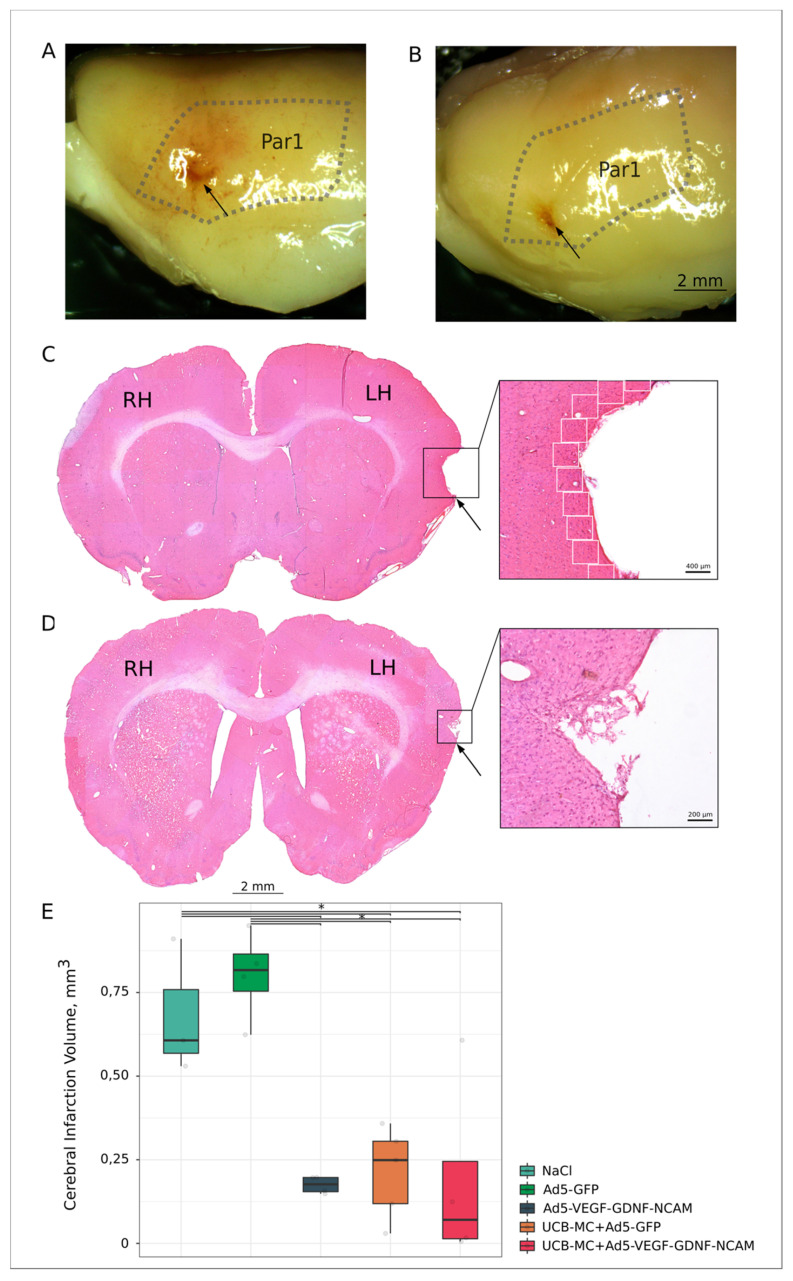
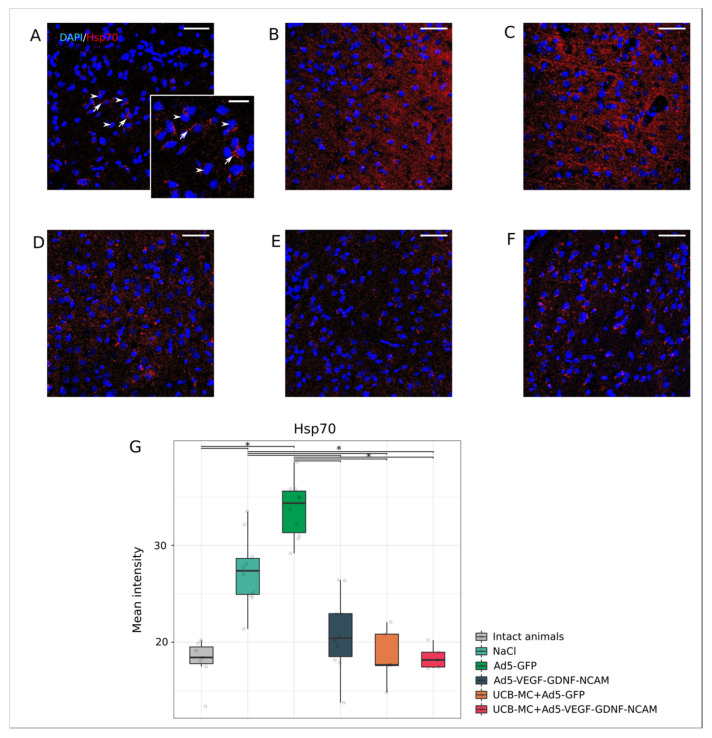
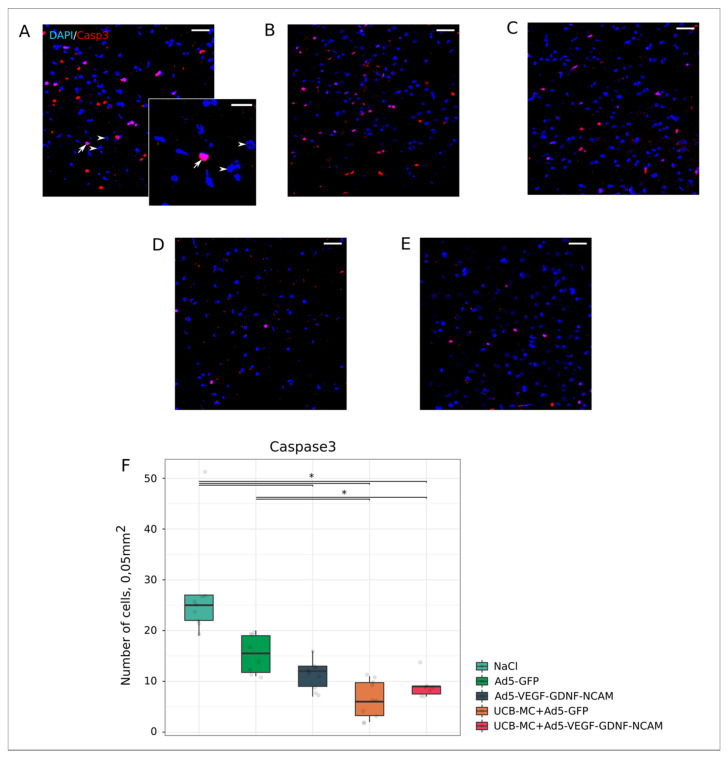
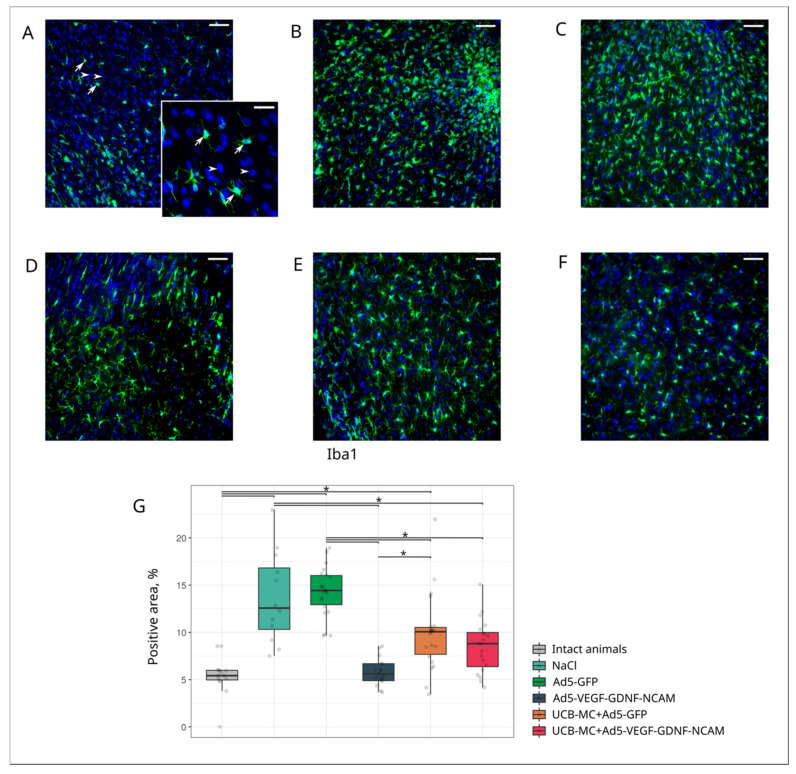
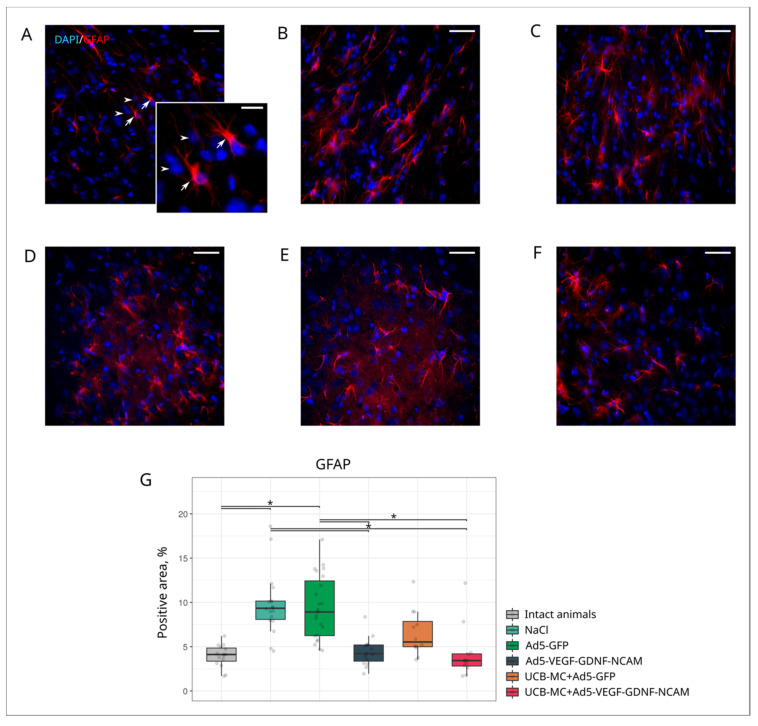
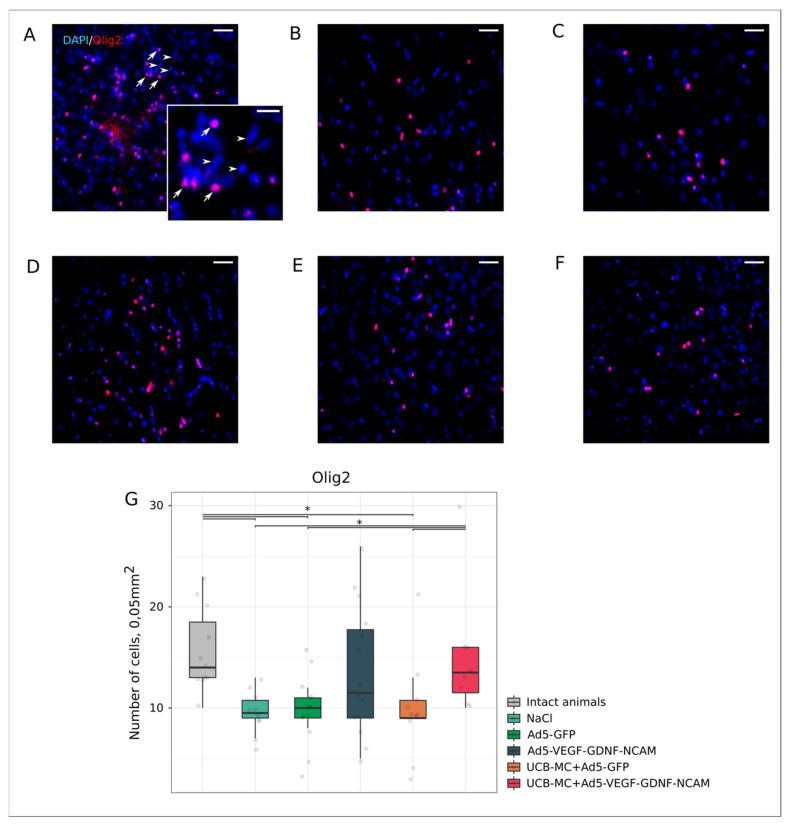
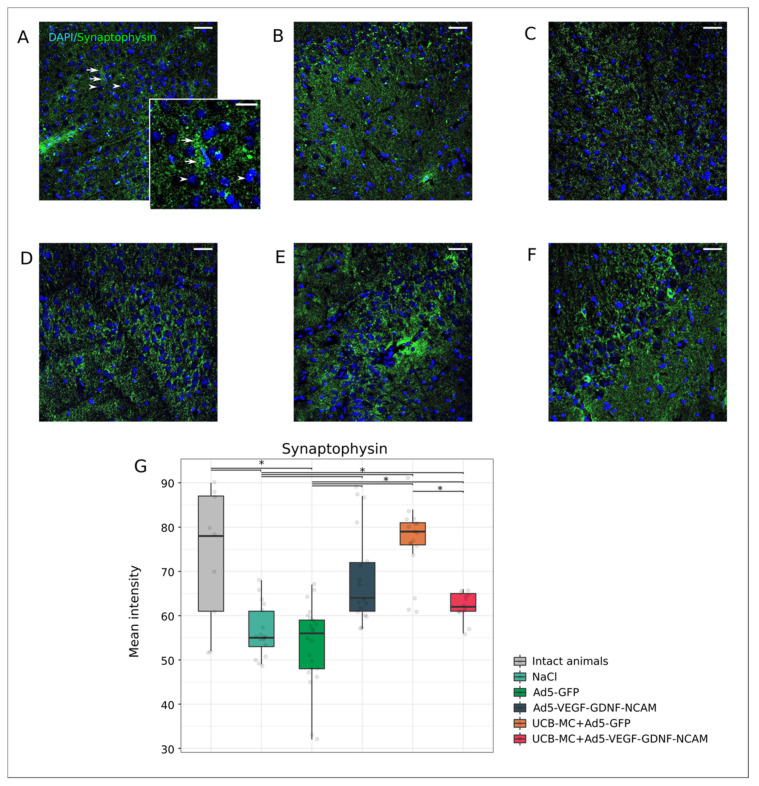
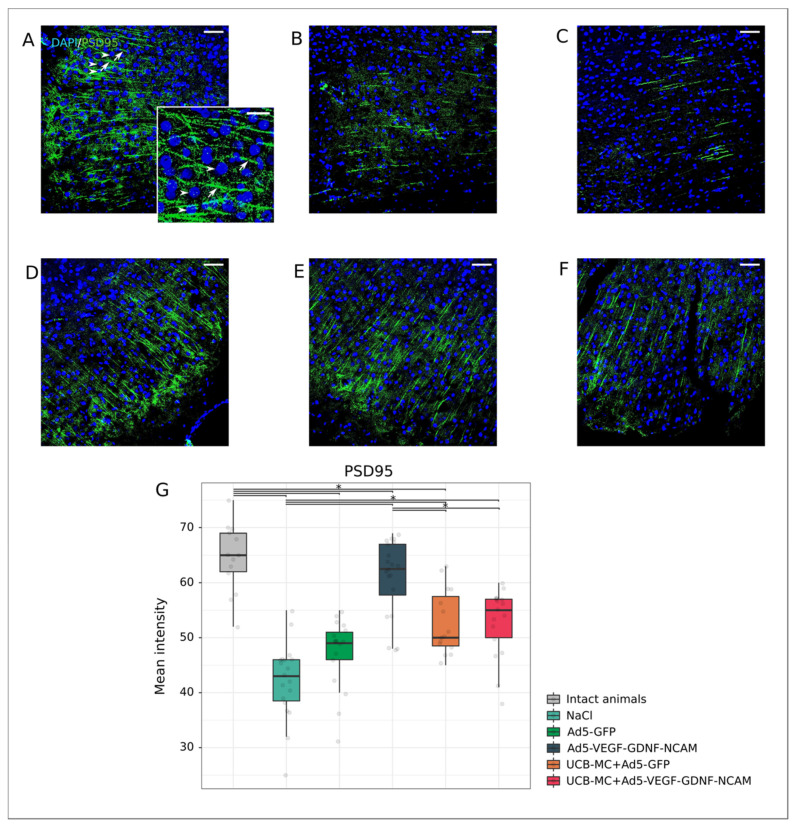
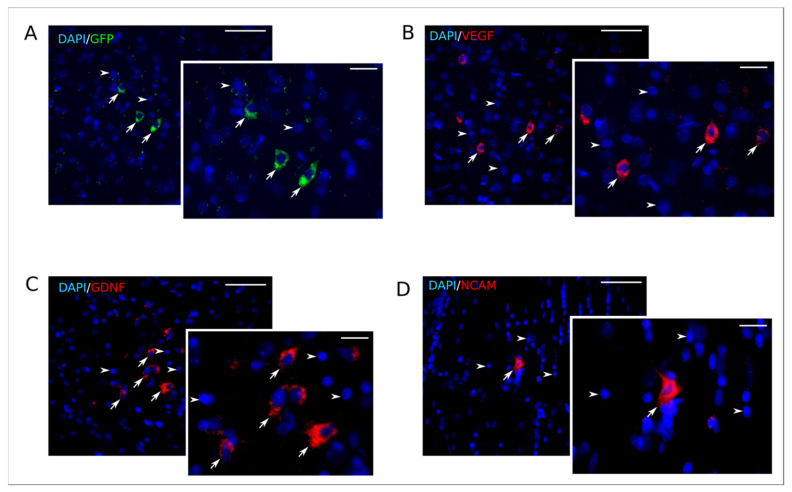
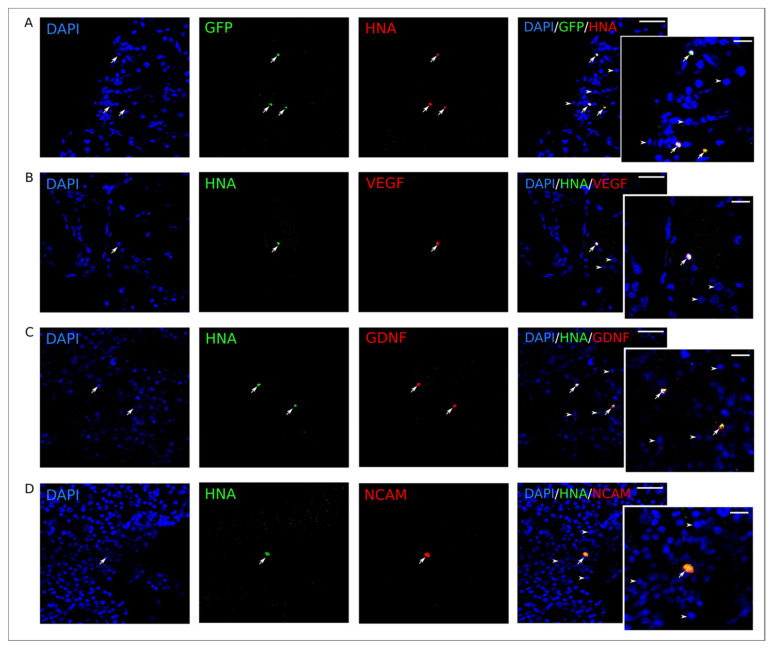
Currently, the main fundamental and clinical interest for stroke therapy is focused on developing a neuroprotective treatment of a penumbra region within the therapeutic window. The development of treatments for ischemic stroke in at-risk patients is of particular interest. Preventive gene therapy may significantly reduce the negative consequences of ischemia-induced brain injury. In the present study, we suggest the approach of preventive gene therapy for stroke. Adenoviral vectors carrying genes encoding vascular endothelial growth factor (VEGF), glial cell-derived neurotrophic factor (GDNF) and neural cell adhesion molecule (NCAM) or gene engineered umbilical cord blood mononuclear cells (UCB-MC) overexpressing recombinant VEGF, GDNF, and NCAM were intrathecally injected before distal occlusion of the middle cerebral artery in rats. Post-ischemic brain recovery was investigated 21 days after stroke modelling. Morphometric and immunofluorescent analysis revealed a reduction of infarction volume accompanied with a lower number of apoptotic cells and decreased expression of Hsp70 in the peri-infarct region in gene-treated animals. The lower immunopositive areas for astrocytes and microglial cells markers, higher number of oligodendrocytes and increased expression of synaptic proteins suggest the inhibition of astrogliosis, supporting the corresponding myelination and functional recovery of neurons in animals receiving preventive gene therapy. In this study, for the first time, we provide evidence of the beneficial effects of preventive triple gene therapy by an adenoviral- or UCB-MC-mediated intrathecal simultaneous delivery combination of vegf165, gdnf, and ncam1 on the preservation and recovery of the brain in rats with subsequent modelling of stroke.

Keywords: GDNF; NCAM; VEGF; adenoviral vector; human umbilical cord blood mononuclear cells; preventive gene therapy; stroke.


Conflict of interest statement

The authors declare no conflict of interest.

Figures

Figure 1
Figure 1
Molecular analysis of gene modified umbilical cord blood mononuclear cells (UCB-MC). (A,B)—Production of green fluorescent protein (GFP) in UCB-MC, 72 h after transduction with Ad5-GFP (MOI = 10). (A)—fluorescent microscopy shows a specific green glow in UCB-MC+Ad5-GFP. Cell nuclei are stained with Hoechst 33342 (blue glow). Scale bar = 200 µm. (B)—flow cytometry analysis demonstrates that 29.5% of UCB-MC effectively produce reporter GFP. (C)—Quantitative analysis of mRNA vegf165, gdnf, and ncam1 levels in intact (naïve) UCB-MC and genetically-modified UCB-MC, 72 h after transduction with three adenoviral vectors simultaneously carrying the therapeutic genes (Ad5-VEGF, Ad5-GDNF, and Ad5-NCAM) or with Ad5-GFP (UCBC + Ad5-GFP), with a MOI = 10. Data from two independent experiments are represented as an average value of ± SE, *—p < 0.05. (D)—Radial comparative diagram of cytokine, chemokines and growth factors in supernatant obtained 72 h after incubation of gene modified UCB-MC (UCB-MC+Ad5- vascular endothelial growth factor (VEGF)- glial cell-derived neurotrophic factor (GDNF)- neural cell adhesion molecule (NCAM) and UCB-MC+Ad5-GFP) and intact UCB-MC.
Figure 2
Figure 2
Ischemic stroke in rats 3 weeks after the distal middle cerebral artery occlusion. (A,C)—The brain from the control (NaCl) group. (B,D)—The brain from the therapeutic (UCB-MC+Ad5-VEGF-GDNF-NCAM) group. In (A) and (B) the stroke area in the parietal lobe of the brain is shown with the arrow. Par1—cortex parietals, area 1 is marked by a dotted line. In (C) and (D)—frontal sections of the brain in the stroke area stained with hematoxylin and eosin. RH—right hemisphere; LH—left hemisphere. Inserts with arrows show the stroke area with the maximum depth and the maximum radius of the infarct cavities at higher magnification. White boxes in the insert in (C) panel indicate areas with S = 0.05 mm2 in the peri-infarct zone used for immunofluorescent analysis. (E)—comparative morphometric analysis of the infarct cavities volume in experimental groups; *—p < 0.05.
Figure 3
Figure 3
Immunoexpression of Hsp70 in the rat brain cortex, 21 days after the middle cerebral artery occlusion. Immunofluorescent staining with antibody to heat shock protein 70 kDa in intact (A), control NaCl (B) and Ad5-GFP (C), and therapeutic UCB-MC+Ad5-GFP (D), Ad5-VEGF-GDNF-NCAM (E) and UCB-MC+Ad5-VEGF-GDNF-NCAM (F) groups. Arrows indicate cytoplasmic localization of Hsp70 (red glow) in brain cells. Arrowheads point to cell nuclei visualized using DAPI (blue glow). Scale bar in (AF) = 50 µm; scale bar in the insert = 20 µm. (G)—comparative analysis of fluorescence intensity level of Hsp70 in experimental groups; *—p < 0.05.
Figure 4
Figure 4
Count of Caspase3-positive cells in the rat brain cortex, 21 days after the middle cerebral artery occlusion. Immunofluorescent staining with antibody to Caspase3 in control NaCl (A) and Ad5-GFP (B), and therapeutic UCB-MC+Ad5-GFP (C), Ad5-VEGF-GDNF-NCAM (D) and UCB-MC+Ad5-VEGF-GDNF-NCAM (E) groups. Arrow indicates nuclear localization of Caspase3 (red glow) in brain cells. Arrowheads point to cell nuclei visualized using DAPI (blue glow). Scale bar in (AE) = 50 µm; scale bar in the insert = 20 µm. (F)—comparative analysis of Caspase3-positive cells number in experimental groups; *—p < 0.05.
Figure 5
Figure 5
Immunoexpression of Iba1 in the rat brain cortex, 21 days after the middle cerebral artery occlusion. Immunofluorescent staining with antibody to microglia specific calcium-binding protein Iba1 in intact (A), control NaCl (B) and Ad5-GFP (C), and therapeutic UCB-MC+Ad5-GFP (D), Ad5-VEGF-GDNF-NCAM (E), and UCB-MC+Ad5-VEGF-GDNF-NCAM (F) groups. Arrows indicate cytoplasmic localization of Iba1 (green glow) in microglial cells. Arrowheads point to cell nuclei visualized using DAPI (blue glow). Scale bar in (AF) = 50 µm; scale bar in the insert = 20 µm. (G)—comparative analysis of Iba1-positive areas in experimental groups; *—p < 0.05.
Figure 6
Figure 6
Immunoexpression of GFAP in the rat brain cortex, 21 days after the middle cerebral artery occlusion. Immunofluorescent staining with antibody to astrocyte specific cytoskeletal glial fibrillary acidic protein GFAP in intact (A), control NaCl (B) and Ad5-GFP (C), and therapeutic UCB-MC+Ad5-GFP (D), Ad5-VEGF-GDNF-NCAM (E) and UCB-MC+Ad5-VEGF-GDNF-NCAM (F) groups. Arrows indicate cytoplasmic localization of GFAP (red glow) in astrocytes. Arrowheads point to cell nuclei visualized using DAPI (blue glow). Scale bar in (AF) = 50 µm; scale bar in the insert = 20 µm. (G)—comparative analysis of GFAP-positive areas in experimental groups; *—p < 0.05.
Figure 7
Figure 7
Count of Olig2-positive oligodendrocytes in the rat brain cortex, 21 days after the middle cerebral artery occlusion. Immunofluorescent staining with antibody to oligodendrocyte transcription factor Olig2 (red glow) in intact (A), control NaCl (B), and Ad5-GFP (C), and therapeutic UCB-MC+Ad5-GFP (D), Ad5-VEGF-GDNF-NCAM (E), and UCB-MC+Ad5-VEGF-GDNF-NCAM (F) groups. Arrows indicate nuclear localization of Olig2 (red glow) in oligodendrocytes. Arrowheads point to cell nuclei visualized using DAPI (blue glow). Scale bar in (AF) = 50 µm; scale bar in the insert = 20 µm. (G)—comparative analysis of Olig2-positive cells number in experimental groups; *—p < 0.05.
Figure 8
Figure 8
Immunoexpression of Synaptophysin in the rat brain cortex, 21 days after the middle cerebral artery occlusion. Immunofluorescent staining with antibody to synaptic vesicle membrane protein Synaptophysin in intact (A), control NaCl (B) and Ad5-GFP (C), and therapeutic UCB-MC+Ad5-GFP (D), Ad5-VEGF-GDNF-NCAM (E) and UCB-MC+Ad5-VEGF-GDNF-NCAM (F) groups. Arrows indicate Synaptophysin (green glow) in neurons. Arrowheads point to cell nuclei visualized using DAPI (blue glow). Scale bar in (AF) = 50 µm; scale bar in the insert = 20 µm. (G)—comparative analysis of fluorescence intensity level of Synaptophysin in experimental groups; *—p < 0.05.
Figure 9
Figure 9
Immunoexpression of PSD95 in the rat brain cortex 21 days after the middle cerebral artery occlusion. Immunofluorescent staining with antibody to postsynaptic membrane protein PSD95 in intact (A), control NaCl (B) and Ad5-GFP (C), and therapeutic UCB-MC+Ad5-GFP (D), Ad5-VEGF-GDNF-NCAM (E) and UCB-MC+Ad5-VEGF-GDNF-NCAM (F) groups. Arrows indicate PSD95 (green glow) in neurons. Arrowheads point to cell nuclei visualized using DAPI (blue glow). Scale bar in (AF) = 50 µm; scale bar in the insert = 20 µm. (G)—Comparative analysis of fluorescence intensity level of PSD95 in experimental groups; *—p < 0.05.
Figure 10
Figure 10
Expression of recombinant molecules in rat brain on 25th day after intrathecal injection of Ad5-GFP and Ad5-VEGF-GDNF-NCAM. (A)—Specific green glow of GFP in the transduced brain cells. (B)—Immune reaction with antibody to vascular endothelial growth factor (VEGF) in brain cells (red glow). (C)—Immune reaction with antibody to glial-derived neurotrophic factor (GDNF) (red glow). (D)—Immune reaction with antibody to neuronal cell adhesion molecule (NCAM) (red glow). Arrows point to the transduced brain cells. Arrowheads indicate cell nuclei visualized using DAPI (blue glow). Scale bar in (AD) = 50 µm; scale bar in the inserts = 20 µm.
Figure 11
Figure 11
Expression of recombinant molecules in rat brain on the 24th day after intrathecal injection of UCB-MC+Ad5-GFP and UCB-MC+Ad-VEGF-GDNF-NCAM. UCB-MC+Ad-VEGF-GDNF-NCAM are visualized with antibody against the human nuclear antigen (HNA). Cell nuclei are counterstained with DAPI (blue glow). (A)—Specific green glow in UCB-MC+Ad5-GFP. (B)—Immune reaction with antibody against vascular endothelial growth factor (VEGF) (red glow). (C)—Immune response with antibody against glial-derived neurotrophic factor (GDNF) (red glow). (D)—Immune response with antibody against neuronal cell adhesion molecule (NCAM) (red glow). Arrows point to the UCB-MC. Arrowheads indicate cell nuclei visualized using DAPI (blue glow). Scale bar in (AD) = 50 µm; scale bar in the inserts = 20 µm.

Similar articles

Cited by

References

    1. Karlupia N., Manley N.C., Prasad K., Schäfer R., Steinberg G.K. Intraarterial transplantation of human umbilical cord blood mononuclear cells is more efficacious and safer compared with umbilical cord mesenchymal stromal cells in a rodent stroke model. Stem Cell Res. Ther. 2014;5:45. doi: 10.1186/scrt434. - DOI - PMC - PubMed
    1. Rhim T., Lee M. Targeted delivery of growth factors in ischemic stroke animal models. Expert Opin. Drug Deliv. 2016;13:709–723. doi: 10.1517/17425247.2016.1144588. - DOI - PubMed
    1. Yamashita T., Deguchi K., Nagotani S., Kamiya T., Abe K. Gene and Stem Cell Therapy in Ischemic Stroke. Cell Transplant. 2009;18:999–1002. doi: 10.3727/096368909X471233. - DOI - PubMed
    1. Ooboshi H. Gene Therapy as a Novel Pharmaceutical Intervention for Stroke. Curr. Pharm. Des. 2011;17:424–433. doi: 10.2174/138161211795164149. - DOI - PubMed
    1. Yang W.Z., Zhang Y., Wu F., Min W.P., Minev B., Zhang M., Luo X.L., Ramos F., Ichim T.E., Riordan N.H., et al. Safety evaluation of allogeneic umbilical cord blood mononuclear cell therapy for degenerative conditions. J. Transl. Med. 2010;8:75. doi: 10.1186/1479-5876-8-75. - DOI - PMC - PubMed

MeSH terms