

Obinutuzumab-Induced B Cell Depletion Reduces Spinal Cord Pathology in a CD20 Double Transgenic Mouse Model of Multiple Sclerosis
- PMID: 32962135
- PMCID: PMC7559311
- DOI: 10.3390/ijms21186864
Obinutuzumab-Induced B Cell Depletion Reduces Spinal Cord Pathology in a CD20 Double Transgenic Mouse Model of Multiple Sclerosis
Abstract
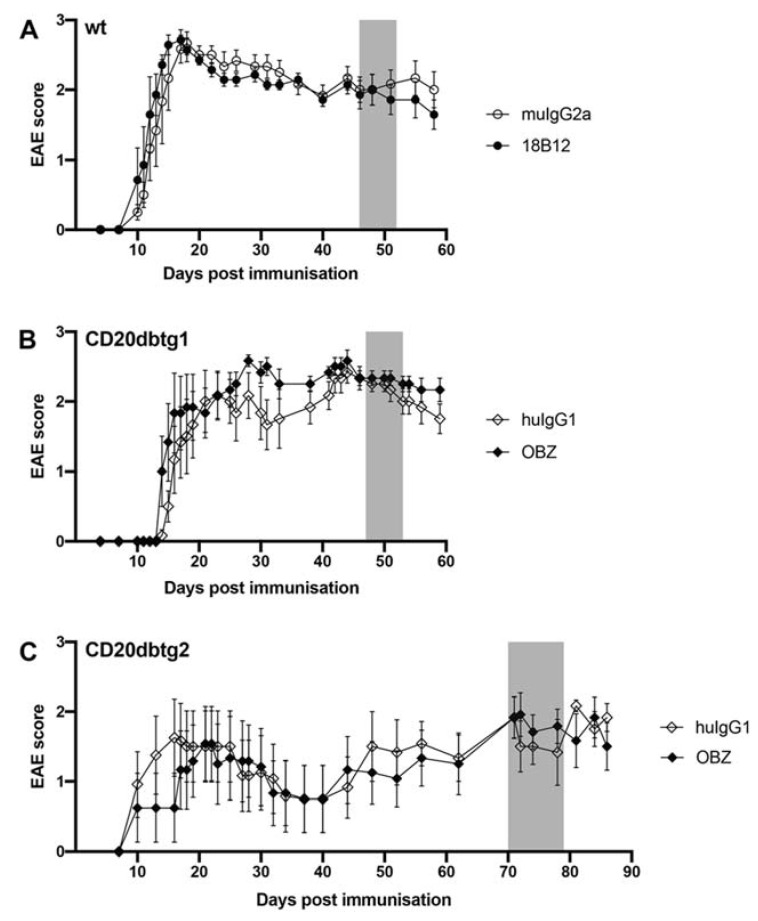
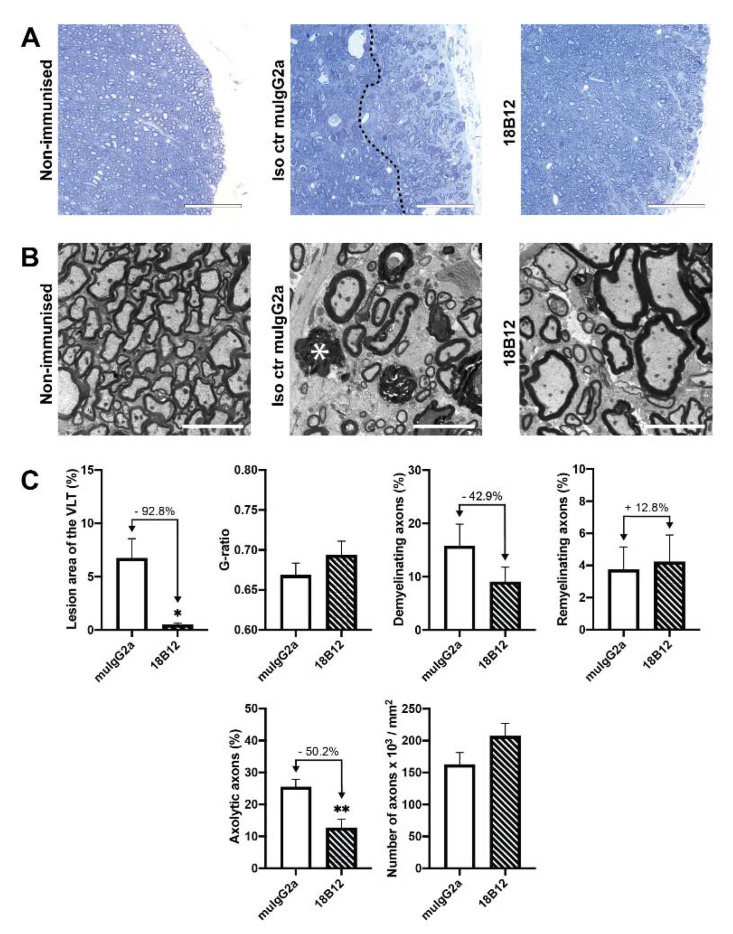
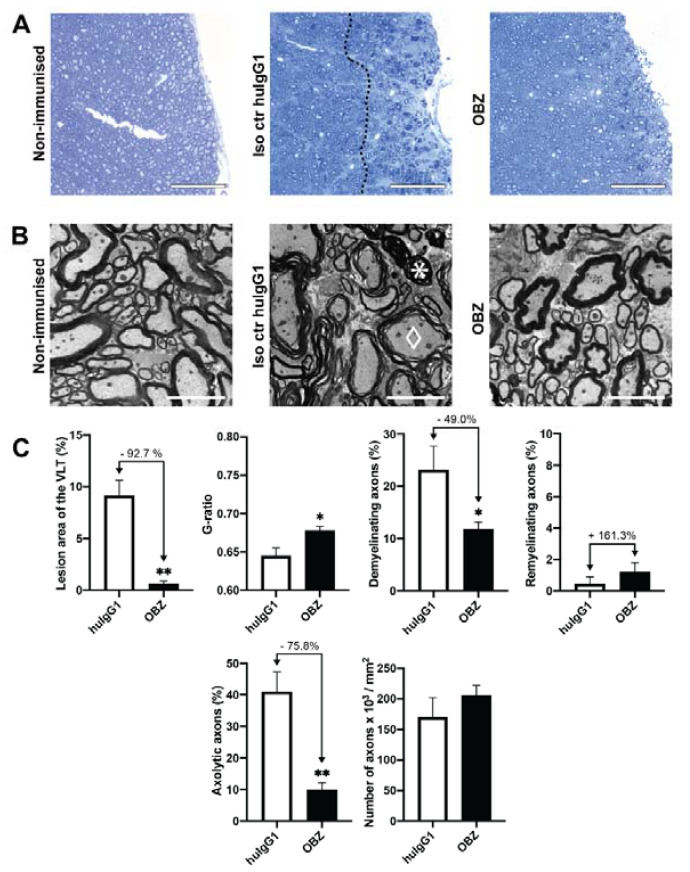
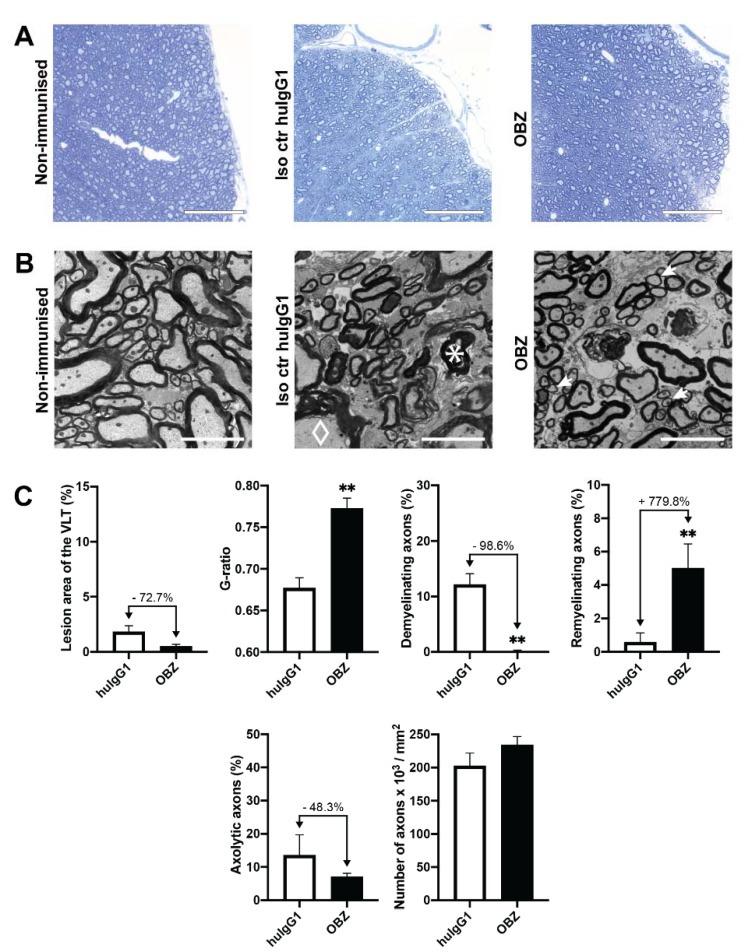
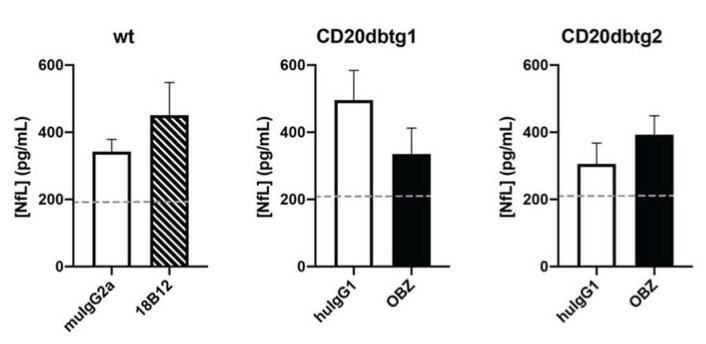
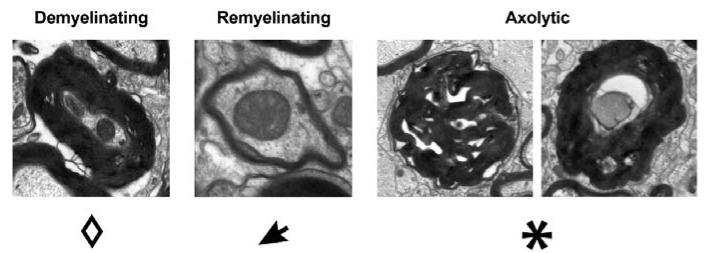
B cell-depleting therapies have recently proven to be clinically highly successful in the treatment of multiple sclerosis (MS). This study aimed to determine the effects of the novel type II anti-human CD20 (huCD20) monoclonal antibody (mAb) obinutuzumab (OBZ) on spinal cord degeneration in a B cell-dependent mouse model of MS. Double transgenic huCD20xHIGR3 (CD20dbtg) mice, which express human CD20, were immunised with the myelin fusion protein MP4 to induce experimental autoimmune encephalomyelitis (EAE). Both light and electron microscopy were used to assess myelination and axonal pathology in mice treated with OBZ during chronic EAE. Furthermore, the effects of the already established murine anti-CD20 antibody 18B12 were assessed in C57BL/6 wild-type (wt) mice. In both models (18B12/wt and OBZ/CD20dbtg) anti-CD20 treatment significantly diminished the extent of spinal cord pathology. While 18B12 treatment mainly reduced the extent of axonal pathology, a significant decrease in demyelination and increase in remyelination were additionally observed in OBZ-treated mice. Hence, the data suggest that OBZ could have neuroprotective effects on the CNS, setting the drug apart from the currently available type I anti-CD20 antibodies.
Keywords: B cells; EAE; anti-CD20; mAb; multiple sclerosis; neurodegeneration; obinutuzumab.
Conflict of interest statement
T.B., S.T. and V.S. report no conflict of interest. H.Z. has served at scientific advisory boards for Denali, Roche Diagnostics, Wave, Samumed, Siemens Healthineers, Pinteon Therapeutics and CogRx, has given lectures in symposia sponsored by Fujirebio, Alzecure and Biogen, and is a co-founder of Brain Biomarker Solutions in Gothenburg AB (BBS), which is a part of the GU Ventures Incubator Program (outside submitted work). K.B. has served as a consultant, at advisory boards, or at data monitoring committees for Abcam, Axon, Biogen, Julius Clinical, Lilly, MagQu, Novartis, Roche Diagnostics, and Siemens Healthineers, and is a co-founder of Brain Biomarker Solutions in Gothenburg AB (BBS), which is a part of the GU Ventures Incubator Program (outside submitted work). E.U. is under paid employment by the company F. Hoffmann-La Roche. S.K. reports grants from the Deutsche Forschungsgemeinschaft, Novartis, Roche and Sanofi and speaker fees and consultancy honoraria from Novartis, Roche, Sanofi, and Teva (outside submitted work).
Figures
Similar articles
-
Effects of a Fully Humanized Type II Anti-CD20 Monoclonal Antibody on Peripheral and CNS B Cells in a Transgenic Mouse Model of Multiple Sclerosis.Int J Mol Sci. 2022 Mar 15;23(6):3172. doi: 10.3390/ijms23063172. Int J Mol Sci. 2022. PMID: 35328594 Free PMC article.
-
Time-Dependent Progression of Demyelination and Axonal Pathology in MP4-Induced Experimental Autoimmune Encephalomyelitis.PLoS One. 2015 Dec 11;10(12):e0144847. doi: 10.1371/journal.pone.0144847. eCollection 2015. PLoS One. 2015. PMID: 26658811 Free PMC article.
-
Early axonal damage and progressive myelin pathology define the kinetics of CNS histopathology in a mouse model of multiple sclerosis.Clin Immunol. 2013 Oct;149(1):32-45. doi: 10.1016/j.clim.2013.06.004. Epub 2013 Jun 18. Clin Immunol. 2013. PMID: 23899992
-
CD20 therapies in multiple sclerosis and experimental autoimmune encephalomyelitis - Targeting T or B cells?Mult Scler Relat Disord. 2016 Sep;9:110-7. doi: 10.1016/j.msard.2016.07.011. Epub 2016 Jul 20. Mult Scler Relat Disord. 2016. PMID: 27645355 Review.
-
A Milestone in Multiple Sclerosis Therapy: Monoclonal Antibodies Against CD20-Yet Progress Continues.Neurotherapeutics. 2021 Jul;18(3):1602-1622. doi: 10.1007/s13311-021-01048-z. Epub 2021 Apr 20. Neurotherapeutics. 2021. PMID: 33880738 Free PMC article. Review.
Cited by
-
Key characteristics of anti-CD20 monoclonal antibodies and clinical implications for multiple sclerosis treatment.J Neurol. 2024 Apr;271(4):1515-1535. doi: 10.1007/s00415-023-12007-3. Epub 2023 Oct 31. J Neurol. 2024. PMID: 37906325 Free PMC article. Review.
-
Neuroprotective Effect of Glatiramer Acetate on Neurofilament Light Chain Leakage and Glutamate Excess in an Animal Model of Multiple Sclerosis.Int J Mol Sci. 2021 Dec 14;22(24):13419. doi: 10.3390/ijms222413419. Int J Mol Sci. 2021. PMID: 34948217 Free PMC article.
References
MeSH terms
Substances
Grants and funding
LinkOut - more resources
Full Text Sources
Medical
