. 2020 Sep 22;3(12):e202000878.
doi: 10.26508/lsa.202000878. Print 2020 Dec.

Fungal mycelia and bacterial thiamine establish a mutualistic growth mechanism

Affiliations

Fungal mycelia and bacterial thiamine establish a mutualistic growth mechanism

Gayan Abeysinghe et al. Life Sci Alliance. .

Abstract

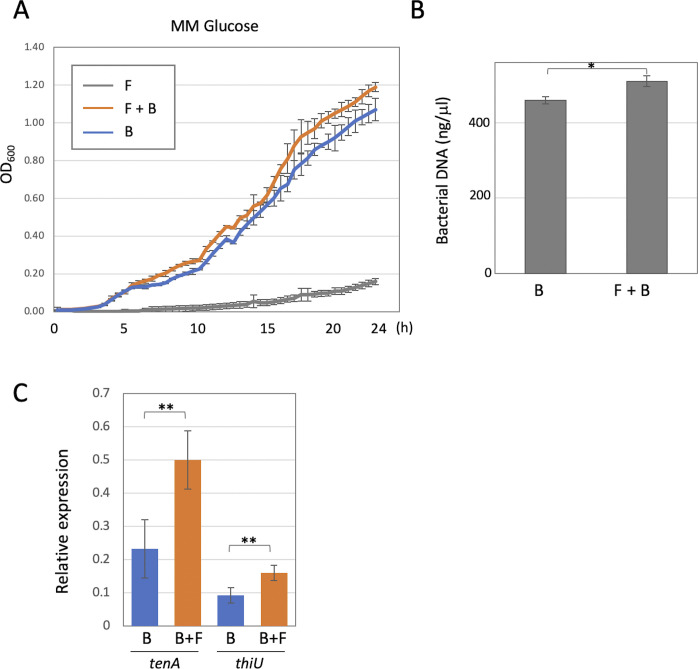
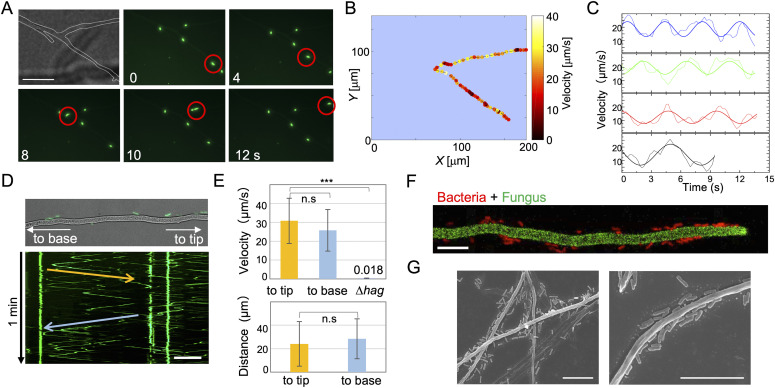
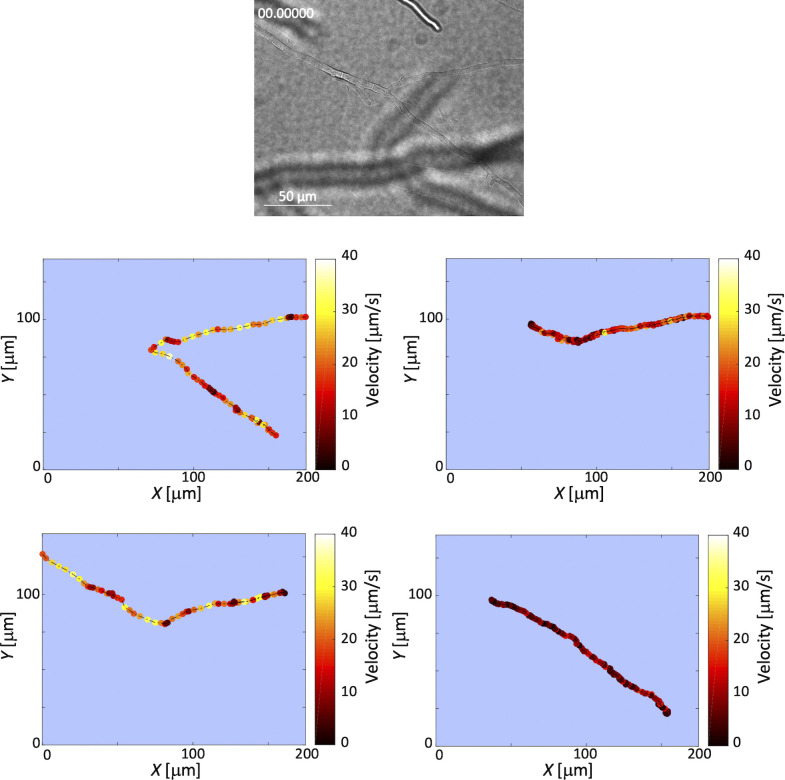
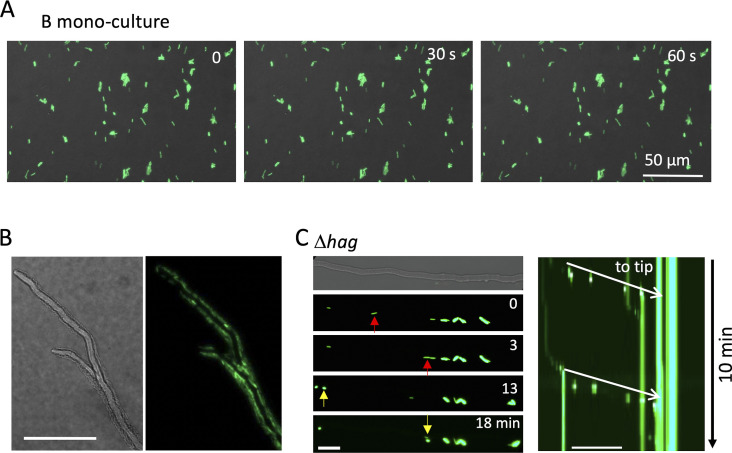
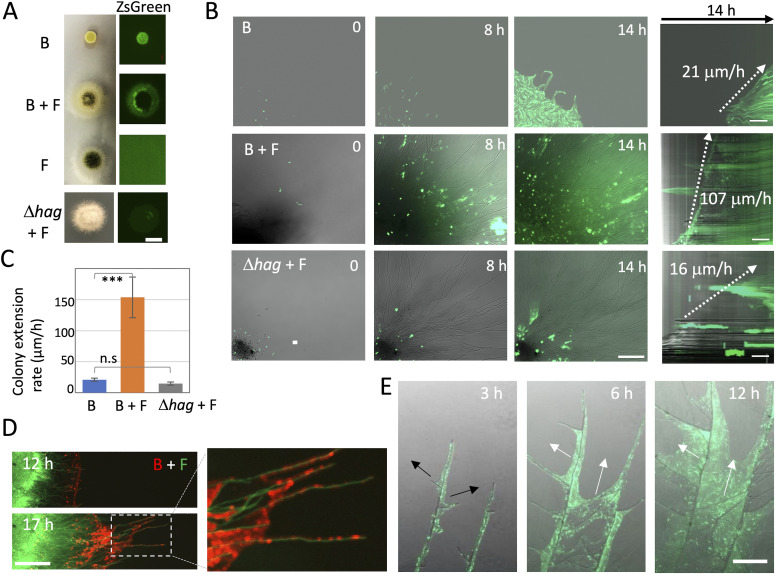
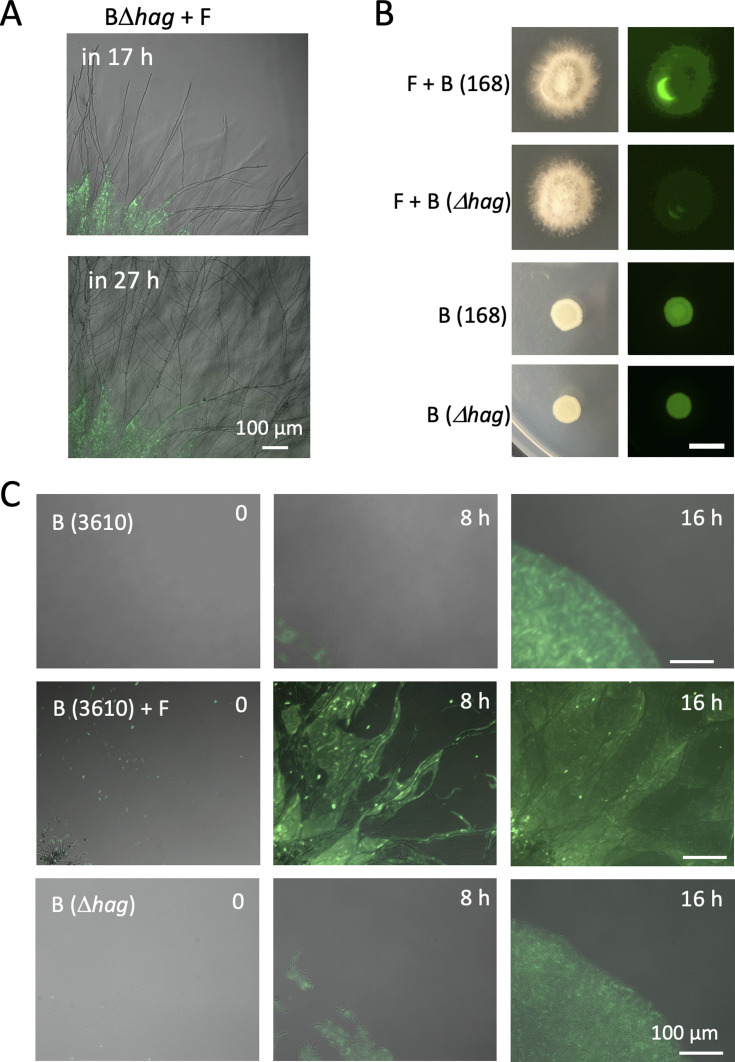
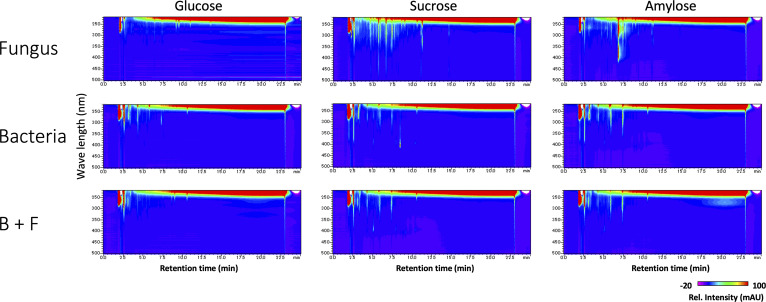
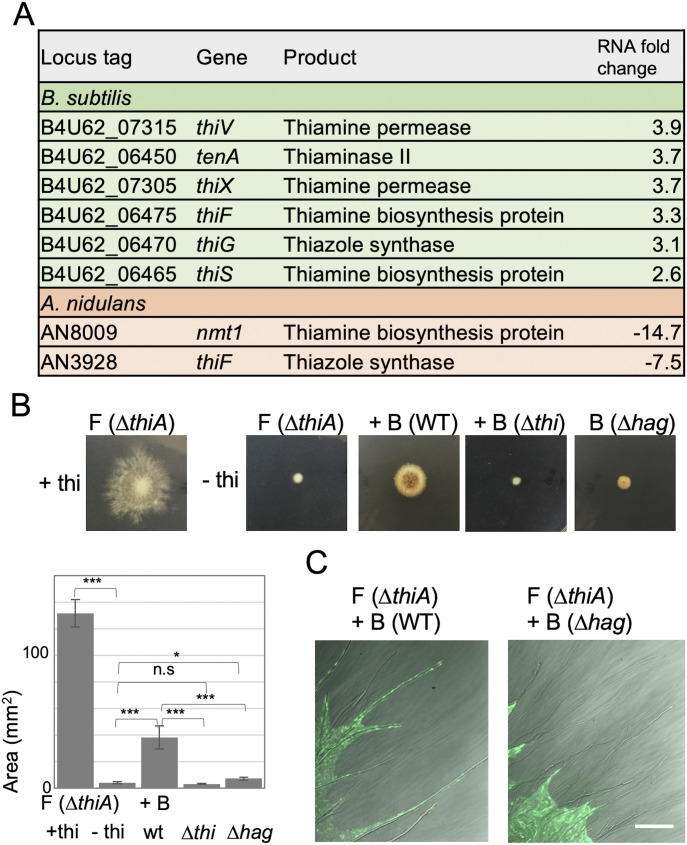
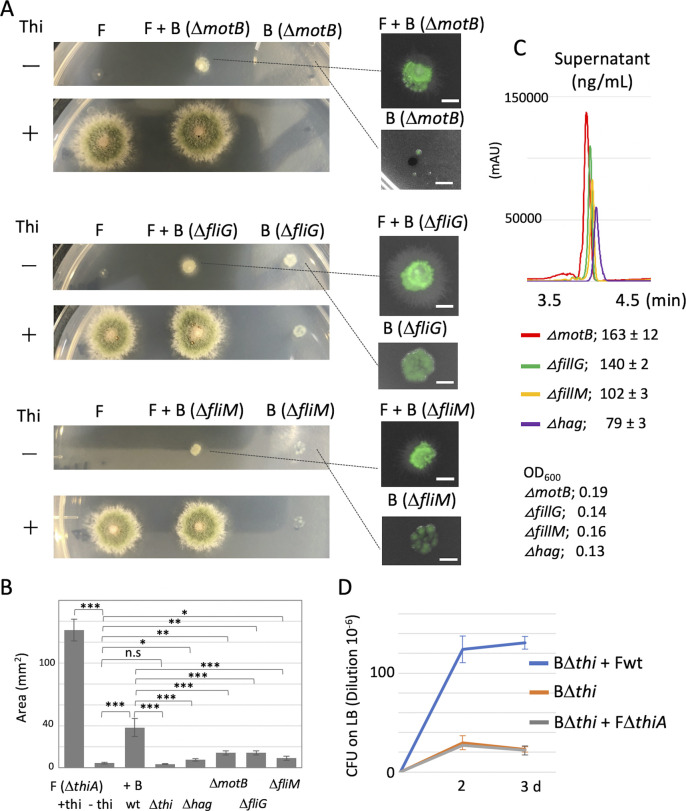
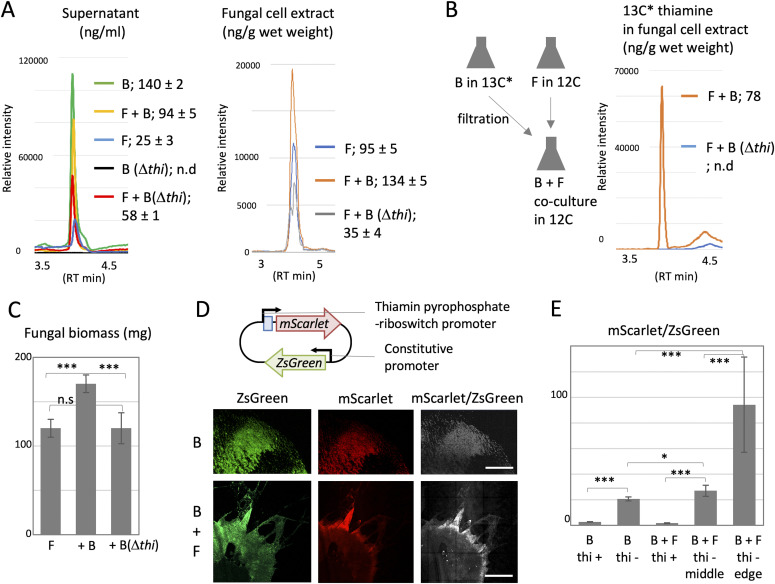
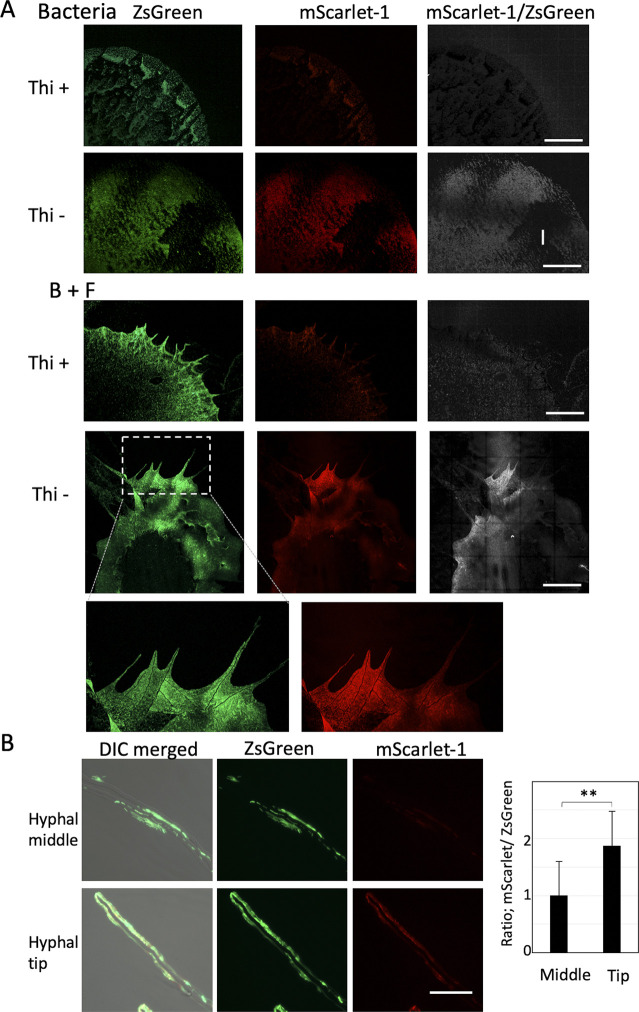
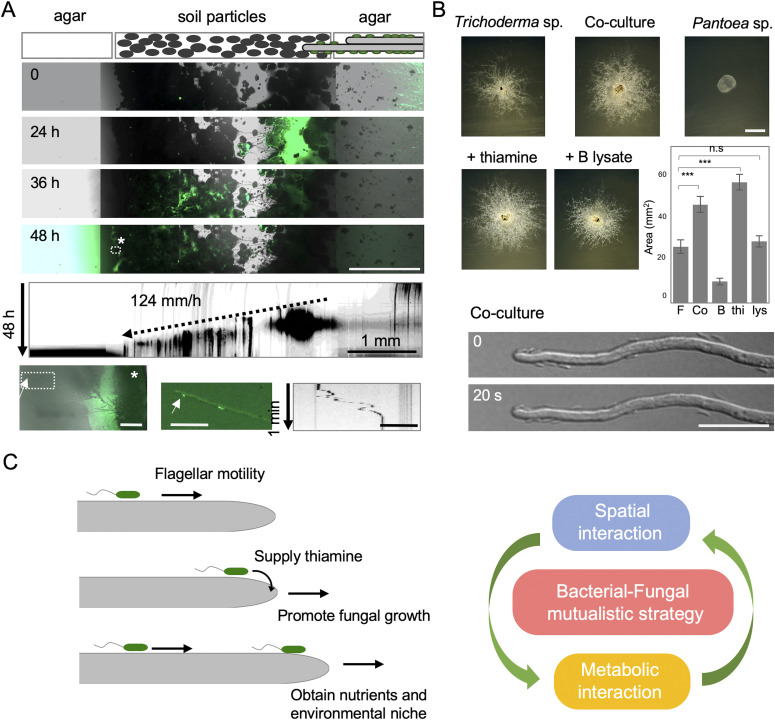
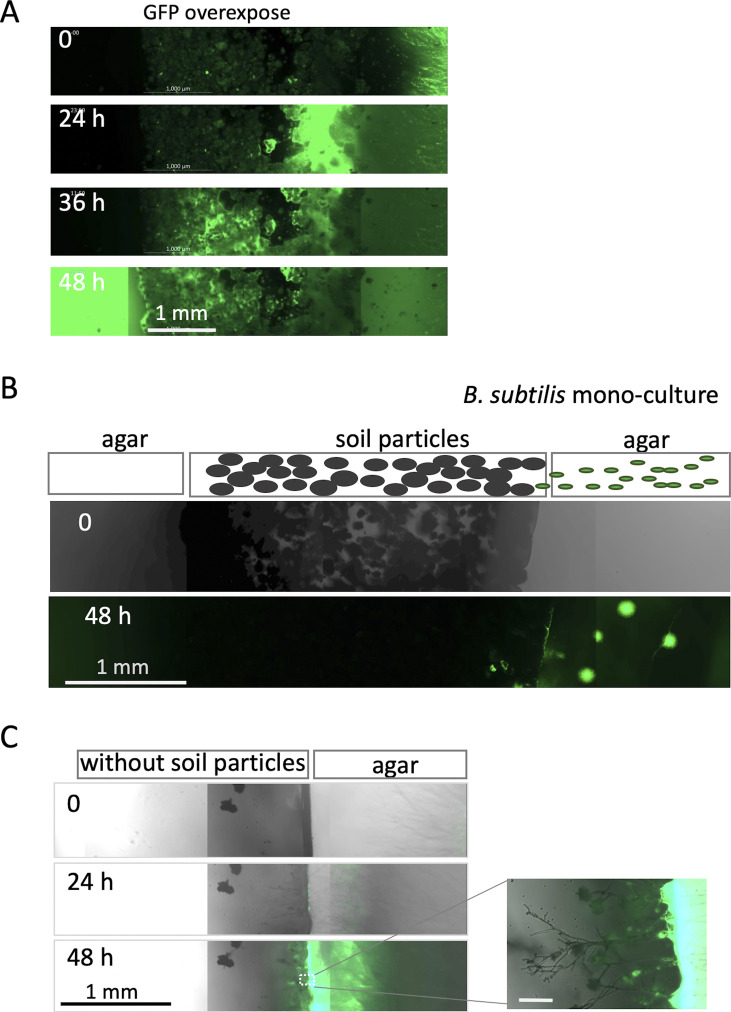
Exclusivity in physical spaces and nutrients is a prerequisite for survival of organisms, but a few species have been able to develop mutually beneficial strategies that allow them to co-habit. Here, we discovered a mutualistic mechanism between filamentous fungus, Aspergillus nidulans, and bacterium, Bacillus subtilis The bacterial cells co-cultured with the fungus traveled along mycelia using their flagella and dispersed farther with the expansion of fungal colony, indicating that the fungal mycelia supply space for bacteria to migrate, disperse, and proliferate. Transcriptomic, genetic, molecular mass, and imaging analyses demonstrated that the bacteria reached the mycelial edge and supplied thiamine to the growing hyphae, which led to a promotion of hyphal growth. The thiamine transfer from bacteria to the thiamine non-auxotrophic fungus was directly demonstrated by stable isotope labeling. The simultaneous spatial and metabolic interactions demonstrated in this study reveal a mutualism that facilitates the communicating fungal and bacterial species to obtain an environmental niche and nutrient, respectively.


Conflict of interest statement

The authors declare that they have no conflict of interest.

Figures

Figure S1.
Figure S1.. Effects of co-culture with the fungus on the bacterial growth.
(A) The spores of A. nidulans were incubated in 200 μl minimal medium for 7 h until they germinated, then precultured B. subtilis were inoculated at a final concentration of OD600 = 0.01. Bacterial growth rates measured in 96-well titer plate and shown by OD600 every 30 min for 24 h. Error bar: SD, n = 3. F, fungus; B, bacteria. (B) Bacterial genomic DNA was extracted from bacterial monoculture or co-culture with the fungus on the minimal medium agar plates incubated at 30°C for 3 d. Error bar: SD, n = 3. *P < 0.05. (C) The relative expressions of tenA and thiU in the bacterial monoculture or co-culture with the fungus measured by qRT-PCR. The expression of sigA is used as a standard. Error bar: SD, n = 3. **P < 0.01.
Figure 1.
Figure 1.. Bacterial movement along fungal hyphae.
(A) Time-lapse images of B. subtilis (expressing green fluorescence ZsGreen) movement along A. nidulans hyphae (dotted line) for 30 s on agar media from Video 1. Scale bar: 50 μm. (A, B) Heat map of B. subtilis instantaneous velocity analyzed by tracking the position of the cell moving along the hypha in (A). (B, C) Weak oscillations in the instantaneous velocity over time are shown in different colors from each bacterial cell in (B) and Fig S2. (D) Kymograph of B. subtilis movement along the hyphae (top) to the tip (yellow arrow) and base (blue arrow) from Video 2. Total 1 min. Scale bar: 50 μm. (E) Velocity and distance of B. subtilis (wild-type or Δhag) movement along hyphae to the tip (yellow) or base (blue). Error bar: SD, n = 26 (to tip), 28 (to base), 5 (Δhag), ***P ≤ 0.001. (F) B. subtilis cells (red) reach the tip of A. nidulans hyphae (green) from Video 3. Scale bar: 10 μm. (G) SEM images of co-culture of B. subtilis and A. nidulans. Scale bar: 10 μm.
Figure S2.
Figure S2.. Oscillations in B. subtilis movement along hyphae.
Heat maps of B. subtilis instantaneous velocity analyzed by track the position of each cell moving along hyphae from Video 1. We tracked the positions of each cell moving along hyphae and from the instantaneous position of the center of mass of a cell. We generated heat maps of the instantaneous velocity, where darker colors represent slower speeds and lighter colors represent higher velocities, respectively. The heat maps indicate that there is a weak oscillation in the instantaneous velocity over time (Fig 1C). The reason for the oscillations that we see in the instantaneous velocity of bacteria moving along hyphae may be the result of stick-slip motion mediated by the flagella. Because of the low water content and narrow gaps between hyphae and agar, the cells may momentarily become wedged in tight gaps; however, the flagellar motors may exert sufficient force to free the stuck cells.
Figure S3.
Figure S3.. B. subtilis movement along hyphae by flagella.
(A) Time-lapse images of B. subtilis (green) monoculture for 60 s on the minimum agar media. Scale bar: 50 μm. (B) A. nidulans hyphae (DIC) surrounded by moving B. subtilis (green) from Video 4. (C) Image sequence of B. subtilis flagella mutant (Δhag) flow (arrows) along A. nidulans hyphae. Kymograph of the Δhag along the hyphae to the tip (white arrows) from Video 5. Total 10 min. Scale bar: 50 μm.
Figure 2.
Figure 2.. Bacterial dispersal on growing fungal hyphae.
(A) Colonies of B. subtilis and A. nidulans monoculture and co-culture, co-culture of A. nidulans and B. subtilishag) (bottom). ZsGreen-labeled B. subtilis (right). Aerial growing hyphae at the middle of the colony disturb to detect the fluorescent signals in the co-culture. B, B. subtilis; F, A. nidulans. Scale bar: 5 mm. (B) Time-lapse images at 0, 8, and 14 h of B. subtilis monoculture, B. subtilis (WT or Δhag) with A. nidulans from Videos 6–Videos 8. Scale bar: 100 μm. Kymographs of B. subtilis (WT or Δhag) dispersion with/without growing hyphae (right). The dotted arrows indicate the velocity of dispersal of B. subtilis. Scale bar: 50 μm. (C) Colony expansion rates calculated from kymographs. Error bar: SD, n = 5, ***P ≤ 0.001. (D) Time-lapse B. subtilis (red) dispersion on growing A. nidulans hyphae (green) from Video 9. Scale bar: 200 μm. (E) Time-lapse B. subtilis dispersion (green, white arrows) on A. nidulans branching hyphae (DIC, black arrows) after 17 h co-culture from Video 10. Scale bar: 200 μm.
Figure S4.
Figure S4.. Bacteria dispersal on fungal colony by flagella.
(A) Time-lapse proliferation of B. subtilis Δhag (green) and A. nidulans (DIC) after 17 h of co-culture. Scale bar: 100 μm. (B) Bright field (left) and green fluorescent (right) images of colonies of B. subtilis (168; WT or Δhag) mono- or co-culture with A. nidulans. Aerial growing hypha at the middle of colony disturb to detect the fluorescent signals in the co-culture. Scale bar: 5 mm. (C) Time-lapse proliferation of B. subtilis (3610; WT) mono- or co-culture with A. nidulans, and B. subtilishag) monoculture. Scale bar: 100 μm.
Figure S5.
Figure S5.. Extracellular hydrophobic metabolites in mono- or co-culture with different carbon source analyzed by LC-PDA-ESI/MS.
Each microorganism was cultured in minimum medium with indicated carbon source for 5 d. Extracellular hydrophobic metabolites in culture supernatant were extracted with acidified ethyl acetate and analyzed by LC-PDA-ESI/MS. Contour maps were constructed from the absorption intensity obtained by LC-PDA analysis. In each monoculture with different carbon source, we see little change in the EHM profiles of B. subtilis. On the other hand, the profiles of A. nidulans are affected by the different carbon sources, which consistent with the previous reports about the regulation of secondary metabolism. EHM in co-culture are similar to those in B. subtilis monoculture regardless of carbon source. The fungal and bacterial cells co-cultured as described above for 5 d in six-well plates. Supernatant of mono- or co-culture was collected by centrifugation at 15,000g for 10 min, and acidified by 1/100 volume of 2 M HCl. Equal volume of ethyl acetate was added to the acidified supernatant, stirred for 1 h and centrifuged at 1,000g for 10 min. The ethyl acetate fraction was collected to other tubes, and lyophilized. Resulting pellet was dissolved in 95% methanol and analyzed by LC-PDA-ESI/MS (LCMS-8030; Shimadzu) equipped with a 150 × 4.6-mm Purospher Star RP-18 column (particle size, 5 μm; Millipore-Merck). The initial mobile phase was solvent A: solvent B = 98:2 (solvent A, 0.1% formic acid; solvent B, acetonitrile), increased to 80% for x min and maintained at that ratio for another 5 min. UV/Vis spectra was monitored by SPD-M30A (Shimadzu). Mass spectra were acquired in the positive mode of LCMS-8030 with the following conditions: capillary voltage, 4.5 kV; detection range, m/z 50–600; desolvation line, 250°C; heat block, 400°C; nebulizer gas, 3 liters/min; drying gas, 15 liters/min.
Figure 3.
Figure 3.. Metabolic interaction through thiamine.
(A) Summary of RNA-seq analysis related to thiamine synthesis in B. subtilis (green) and A. nidulans (orange). (B) Fungal colonies of A. nidulansthiA) monoculture or co-cultivated with B. subtilis (WT, Δthi, or Δhag) on minimal medium with/without thiamine grown for 2 d at 30°C. The area of colonies is measured by ImageJ software. Error bar: SD, n = 3, ***P ≤ 0.001, *P ≤ 0.05. (C) Dispersal of B. subtilis (WT or Δhag with ZsGreen) on colonies of A. nidulansthiA) without thiamine grown for 2 d at 30°C. Scale bar: 100 μm.
Figure S6.
Figure S6.. The growth defect of ΔthiA is recovered by co-culture with non-motile mutants.
(A) We co-cultured an A. nidulans ΔthiA strain with three non-motile B. subtilis strains as follows. MotB; H+-coupled MotA-MotB flagellar stator. FliG; flagellar motor switch protein, physically transduces force from MotA to the rotation of FliF. FliM; flagellar motor switch protein, part of the basal body C-ring. The ΔthiA fungal colony shows a severe growth defect on the plate without thiamine, which is recovered by adding thiamine. The growth defect of ΔthiA is not recovered by co-culture with the non-motile mutants as co-culture with wild-type B. subtilis. Fungal colonies of A. nidulansthiA) monoculture or co-cultivated with B. subtilismotB, ΔfliG, or ΔfliM) on minimal medium with/without thiamine grown for 2 d at 30°C. Each deletion strain expressing ZsGreen. Because flagella are required for bacterial dispersal on the hyphae, the non-motile mutants grow at the center of the fungal colony but do not reach the periphery of the fungal ΔthiA colony (a, right). (B) The area of fungal colonies is measured by ImageJ software. Error bar: SD, n = 3, ***P ≤ 0.001, *P ≤ 0.05. (C) The amount of thiamine in supernatant in the monoculture of B. subtilis non-motile mutants by LC-MS-MRM analysis. OD600 are indicated. B. subtilis non-motile mutants synthesize and secrete thiamine in the medium. (B, C) The growth effect on the fungal ΔthiA colony depends on the secretion amount in the four non-motile B. subtilis strains (B, C). (D) CFU on LB (dilution 10−6) in B. subtilis Δthi monoculture, B. subtilis Δthi + A. nidulans wild-type co-culture, B. subtilis Δthi + A. nidulans ΔthiA co-culture in 200 ml minimal medium with 0.4g shaking at 30°C for 2 and 3 d. CFU in B. subtilis Δthi + A. nidulans wild-type is higher than B. subtilis Δthi monoculture, whereas that in B. subtilis Δthi + A. nidulans ΔthiA co-culture is comparable with B. subtilis Δthi monoculture, suggesting a bi-directional thiamine transfer between B. subtilis and A. nidulans.
Figure 4.
Figure 4.. Thiamine transfer analyzed by molecular mass and reporter strain.
(A) The amount of thiamine in supernatant and fungal cell extracts in the co-culture and monoculture of wild-type A. nidulans and B. subtilis (WT or Δthi) by LC-MS-MRM analysis. B, B. subtilis; F, A. nidulans. The mean values of peak and SD are shown. n = 3. (B) The amount of 13C* thiamine by LC-MS-MRM analysis in the fungal cell extracts in the co-culture of A. nidulans pre-grown in 12C and B. subtilis (WT or Δthi) pre-grown in 13C*. (C) The fungal biomass in wild-type A. nidulans monoculture and co-culture with B. subtilis (WT or Δthi). Error bar: SD, n = 3, ***P ≤ 0.001. (D) Construct of B. subtilis thiamine reporter strain. Colonies of the B. subtilis reporter strain monoculture and co-culture with A. nidulans on the minimal medium without thiamine grown for 2 d at 30°C. The images are constructed by 10 × 10 tiling of 500 × 500 μm confocal image. Scale bar: 500 μm. (E) Ratio of signal intensity, mScarlet-1/ZsGreen, in 500 × 500 μm confocal image normalized by ZsGreen intensity. Error bar: SD, n = 3, ***P ≤ 0.001. *P ≤ 0.05.
Figure S7.
Figure S7.. B. subtilis thiamine reporter strain.
(A) Colonies of the B. subtilis reporter strain in monoculture and co-culture with A. nidulans on the minimal medium with/without thiamine grown for 2 d at 30°C. The images are constructed by 10 × 10 tiling of 500 × 500 μm image. Scale bar: 500 μm. (B) The B. subtilis reporter strain at hyphal middles and hyphal tips. Scale bar: 20 μm. Ratio of signal intensity, mScarlet-1/ZsGreen. Error bar: SD, n = 75, **P < 0.01.
Figure 5.
Figure 5.. Mutualistic growth strategy by spatial and metabolic interactions.
(A) Time-lapse bacterial dispersal (green) on growing hyphae in soil particles sandwiched between two agar pieces at 0, 24, 36, and 48 h. Scale bar: 1 mm. Kymograph of bacterial migration from Video 11 (vertical arrow: 48 h, scale bar: 1 mm). Asterisk indicates an expanded image of bacterial colony (green) and mycelium at the left agar after 48 h (left bottom). Scale bar: 100 μm. Arrows indicate bacterial movement along hyphae at the left agar after 48 h (middle bottom). Scale bar: 50 μm. Kymograph of the bacterial movement (right bottom). Vertical arrow: 1 min, Scale bar: 50 μm. (B) Colonies Trichoderma sp. and Pantoea sp. monoculture and co-culture. The bacterial cell lysate is prepared by sonication. Scale bar: 2 mm. The area of colonies is measured by ImageJ software. Error bar: SD, n = 3, ***P ≤ 0.001. Expanded image of the bacterial cells move along the hyphae and reach the tip. Scale bar: 20 μm. (C) Mutualistic growth strategy that the bacterial cells move faster along fungal highway and disperse farther on fungal growth, whereas bacterial cells supply thiamine to hyphal tips and promote the fungal growth.
Figure S8.
Figure S8.. Bacterial migration on fungal colony in soil.
(A) Time-lapse images of bacterial migration (green) on growing hyphae in the soil particles sandwiched with two agar pieces at time 0, 24, 36 and 48 h from Video 11. Scale bar: 1 mm. GFP overexposed in Fig 5A. (B) Time-lapse images of bacterial migration (green) of B. subtilis monoculture in soil particles sandwiched with two agar pieces at time 0 and 48 h from Video 12. Scale bar: 1 mm. Without the fungus, however, after the bacteria reached the soil particles from the right agar slab, we observed no motion through the soil particles to the left agar slab. Instead they proliferated in the soil particles close to the right agar slab over 48 h. (C) Time-lapse images of bacterial migration (green) on growing hyphae without the soil particles sandwiched with two agar pieces at time 0, 24, and 48 h from Video 13. Scale bar: 1 mm. Without soil particles, the fungal hyphae emerged from the right agar slab, extended to some extent and eventually stopped growing.

References

    1. Barkal LJ, Procknow CL, Álvarez-García YR, Niu M, Jiménez-Torres JA, Brockman-Schneider RA, Gern JE, Denlinger LC, Theberge AB, Keller NP, et al. (2017) Microbial volatile communication in human organotypic lung models. Nat Commun 8: 1770 10.1038/s41467-017-01985-4 - DOI - PMC - PubMed
    1. Benoit I, van den Esker MH, Patyshakuliyeva A, Mattern DJ, Blei F, Zhou M, Dijksterhuis J, Brakhage AA, Kuipers OP, de Vries RP, et al. (2015) Bacillus subtilis attachment to Aspergillus niger hyphae results in mutually altered metabolism. Environ Microbiol 17: 2099–2113. 10.1111/1462-2920.12564 - DOI - PubMed
    1. Cazorla FM, Romero D, Pérez-García A, Lugtenberg BJ, de Vicente A, Bloemberg G (2007) Isolation and characterization of antagonistic Bacillus subtilis strains from the avocado rhizoplane displaying biocontrol activity. J Appl Microbiol 103: 1950–1959. 10.1111/j.1365-2672.2007.03433.x - DOI - PubMed
    1. Cressina E, Chen L, Moulin M, Leeper FJ, Abell C, Smith AG (2011) Identification of novel ligands for thiamine pyrophosphate (TPP) riboswitches. Biochem Soc Trans 39: 652–657. 10.1042/BST0390652 - DOI - PubMed
    1. Deveau A, Brulé C, Palin B, Champmartin D, Rubini P, Garbaye J, Sarniguet A, Frey-Klett P (2010) Role of fungal trehalsoe and bacterial thiamine in the improved survival and growth of the ectomycorrhizal fungus Laccaria bicolor S238N and the helper bacterium Pseudomonas fluorescens BBc6R8. Environ Microbiol Rep 2: 560–568. 10.1111/j.1758-2229.2010.00145.x - DOI - PubMed

Publication types

LinkOut - more resources