. 2020 Sep 22;11(5):e01911-20.
doi: 10.1128/mBio.01911-20.

Genotoxic Effect of Salmonella Paratyphi A Infection on Human Primary Gallbladder Cells

Affiliations

Genotoxic Effect of Salmonella Paratyphi A Infection on Human Primary Gallbladder Cells

Ludovico P Sepe et al. mBio. .

Abstract

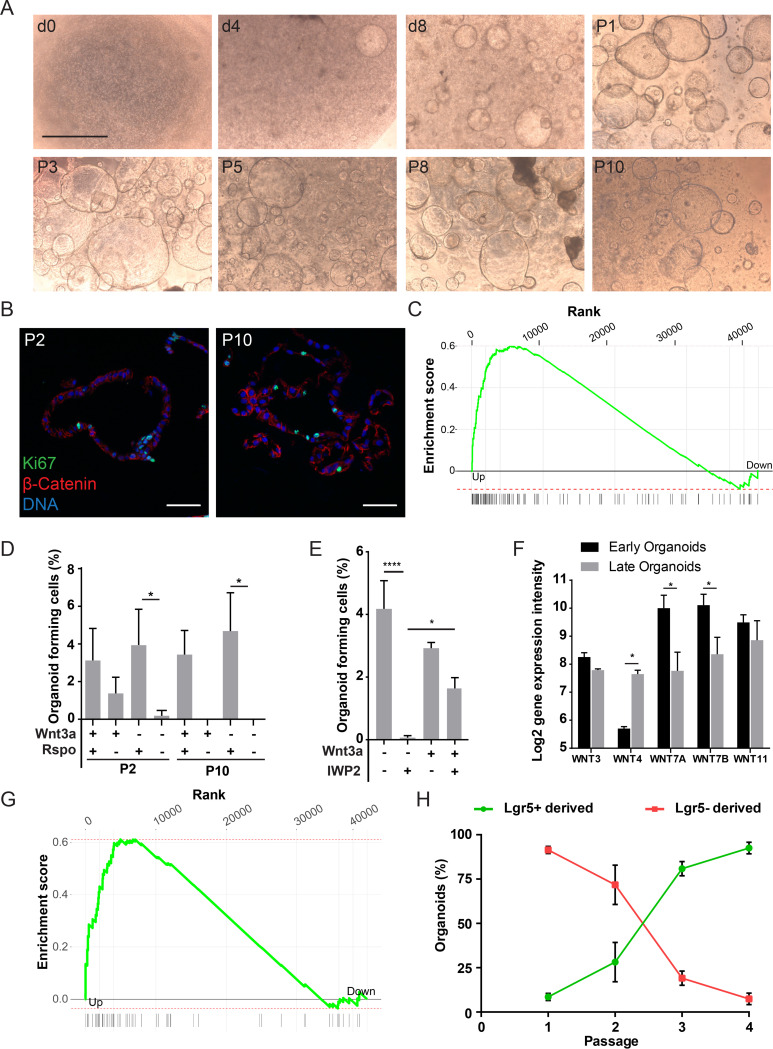
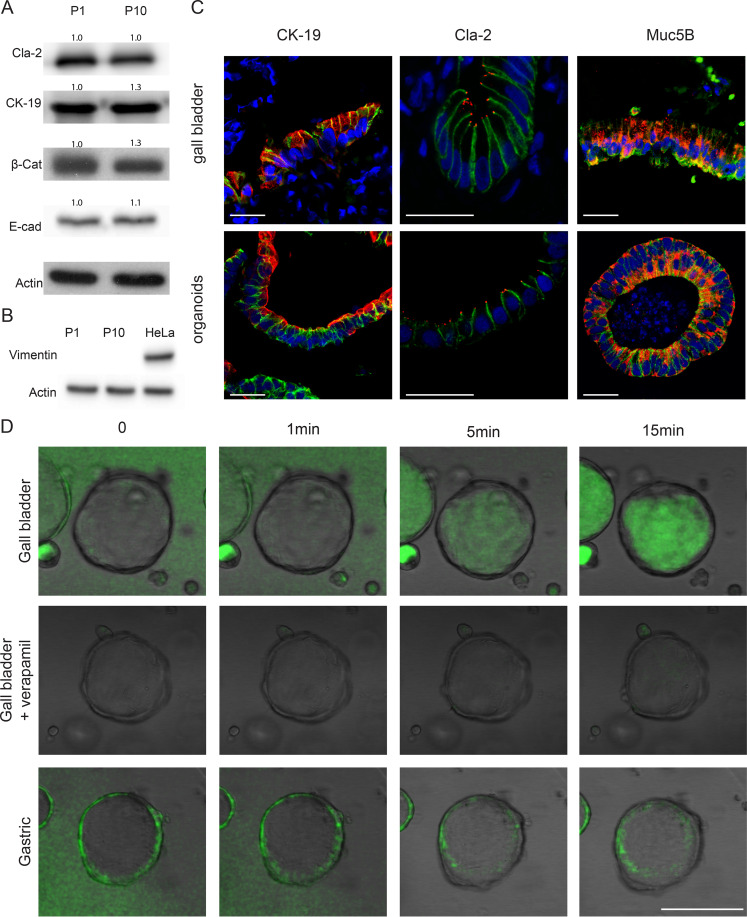
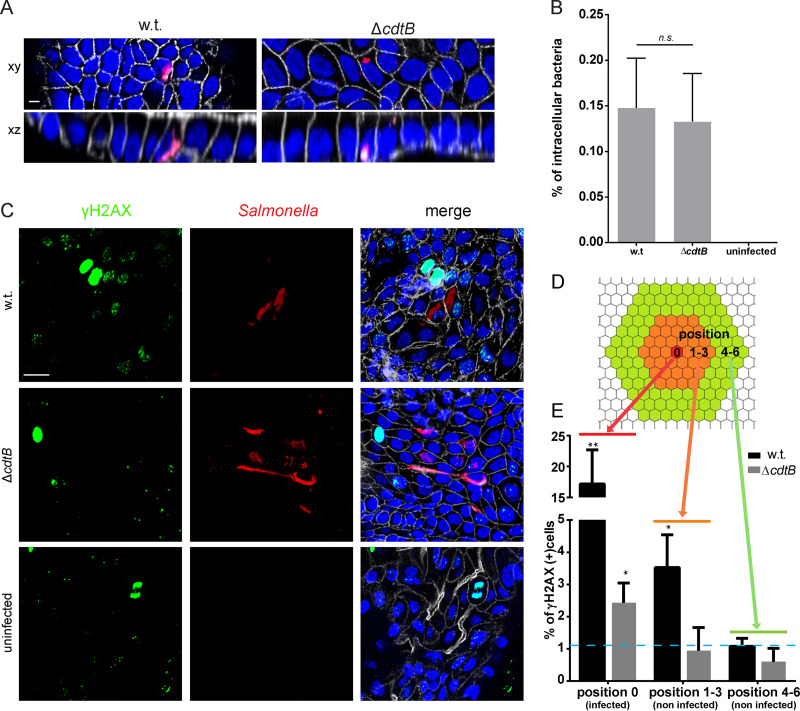
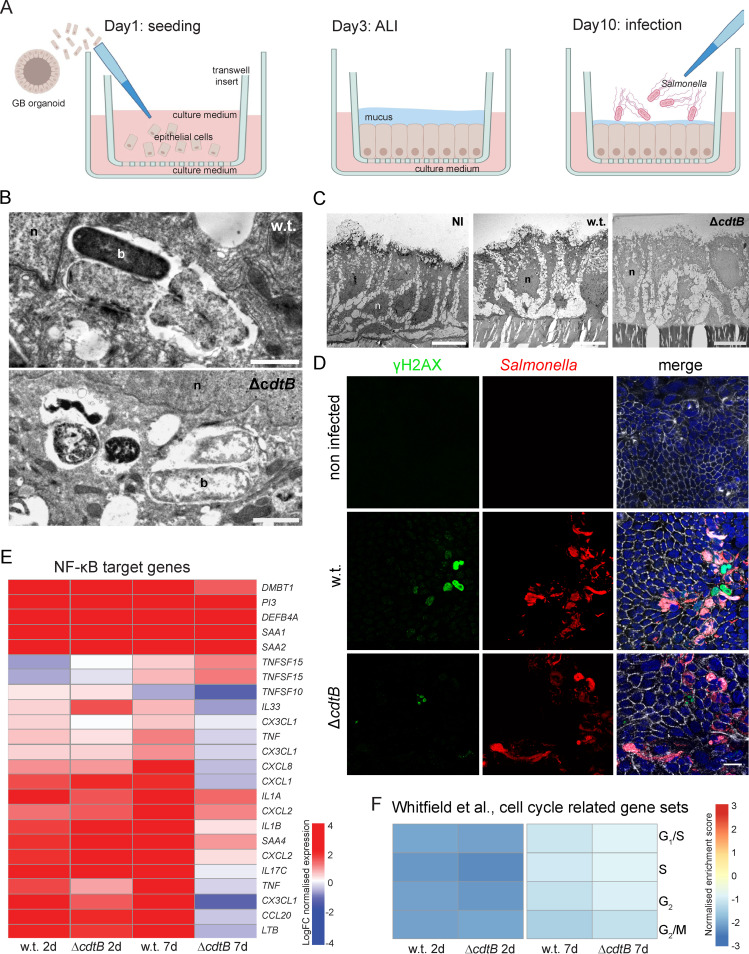
Carcinoma of the gallbladder (GBC) is the most frequent tumor of the biliary tract. Despite epidemiological studies showing a correlation between chronic infection with Salmonella enterica Typhi/Paratyphi A and GBC, the underlying molecular mechanisms of this fatal connection are still uncertain. The murine serovar Salmonella Typhimurium has been shown to promote transformation of genetically predisposed cells by driving mitogenic signaling. However, insights from this strain remain limited as it lacks the typhoid toxin produced by the human serovars Typhi and Paratyphi A. In particular, the CdtB subunit of the typhoid toxin directly induces DNA breaks in host cells, likely promoting transformation. To assess the underlying principles of transformation, we used gallbladder organoids as an infection model for Salmonella Paratyphi A. In this model, bacteria can invade epithelial cells, and we observed host cell DNA damage. The induction of DNA double-strand breaks after infection depended on the typhoid toxin CdtB subunit and extended to neighboring, non-infected cells. By cultivating the organoid derived cells into polarized monolayers in air-liquid interphase, we could extend the duration of the infection, and we observed an initial arrest of the cell cycle that does not depend on the typhoid toxin. Non-infected intoxicated cells instead continued to proliferate despite the DNA damage. Our study highlights the importance of the typhoid toxin in causing genomic instability and corroborates the epidemiological link between Salmonella infection and GBC.IMPORTANCE Bacterial infections are increasingly being recognized as risk factors for the development of adenocarcinomas. The strong epidemiological evidence linking Helicobacter pylori infection to stomach cancer has paved the way to the demonstration that bacterial infections cause DNA damage in the host cells, initiating transformation. In this regard, the role of bacterial genotoxins has become more relevant. Salmonella enterica serovars Typhi and Paratyphi A have been clinically associated with gallbladder cancer. By harnessing the stem cell potential of cells from healthy human gallbladder explant, we regenerated and propagated the epithelium of this organ in vitro and used these cultures to model S. Paratyphi A infection. This study demonstrates the importance of the typhoid toxin, encoded only by these specific serovars, in causing genomic instability in healthy gallbladder cells, posing intoxicated cells at risk of malignant transformation.

Keywords: DNA damage; Salmonella; gallbladder; gallbladder cancer; mucosoid cultures; organoid cultures; typhoid toxin.


Figures

FIG 1
FIG 1
Cultivation of human gallbladder organoids and dependence on the Wnt/β-catenin pathway activation. (A) Gallbladder epithelial cells were isolated and grown as described in Materials and Methods. Pictures were taken 0, 4, and 8 days after seeding and at passages 1, 3, 5, 8, and 10. Scale bar, 1 mm. (B) Gallbladder organoids were fixed 7 days after seeding. Organoids were paraffinized, sectioned, and immunostained for the proliferation marker Ki67 (green), β-catenin (red). DRAQ5 was used to stain the nuclei (blue). (C) Gene set enrichment analysis of human pluripotent stem cell genes published by Mallon et al. (42) among genes regulated in early versus late organoids, as identified by microarray. Adjusted P value = 0.00039, enrichment score = 0.6, normalized enrichment score = 1.9. (D) Organoids at passage 1 were split to single cells and seeded, and the number of resulting organoids was counted 5 to 7 days later (i.e., at passage 2), in media + or − Wnt3A and + or − Rspo1. The organoids were kept in culture and the procedure was repeated after 8 passages (i.e., at passage 10). *, P < 0.05 (t test). (E) Organoids were split to single cells which were seeded in Matrigel and provided with media + or − the Wnt inhibitor IWP-2 and + or − 25% of Wnt3a conditioned medium. The number of resulting organoids was counted 5 to 7 days later. *, P < 0.05; ****, P < 0.00005. (F) Change in expression levels of Wnt family members observed in a microarray comparing early versus late organoids. Only transcripts with an average log2 expression of >6 are shown. *, P < 0.05 (t test). (G) Gene set enrichment analysis of β-catenin targets published by Herbst et al. (44) among genes regulated in early versus late organoids as identified by microarray. Adjusted P value = 0.0015, enrichment score = 0.61, normalized enrichment score = 1.8. (H) Lineage tracing of murine organoids derived from the Lgr5 reporter mouse, Lgr5-EGFP-IRES-CreERT2, ROSA-mTmGfloxed after HT induction. The number of organoids derived from Lgr5+ cells (green) and Lgr5 cells (red) was counted at each passage 5 to 7 days after seeding. The plot shows the percentage of each population compared to the total number of organoids. Bars indicate the standard deviations (SD).
FIG 2
FIG 2
Characterization of human organoids. (A) Western blot analysis of epithelial and gallbladder markers at early (P1) and late (P10) passages. Relative densitometry values, normalized to P1 (=1), are shown above the bands. (B) Western blot analysis as in panel A of the fibroblast marker Vimentin compared to HeLa cells. (C) Immunofluorescence analysis of human gallbladder tissue and organoids 7 days after seeding for the gallbladder markers cytokeratin-19, claudin-2, or mucin5B (red); the epithelial marker E-cadherin (green); and DRAQ5 (blue). Scale bar, 25 μm. (D) Transport assay of rhodamine-123 (green) in gallbladder organoids treated with the multidrug transporter inhibitor verapamil (middle row), and gastric organoids. Scale bar, 100 μm.
FIG 3
FIG 3
Infection and paracrine genotoxic effect of CdtB. (A) Reconstruction of whole-mount immunofluorescence labeling of organoids infected with Salmonella Paratyphi A carrying the mCherry-expressing plasmid pLS002 (red) at 3 days post infection, with phalloidin to detect F-actin (white) and Hoechst for DNA (blue). Scale bar, 10 μm. (B) Proportion of cells invaded after infection of organoids with wild-type Salmonella or a cdtB deletion mutant. (C) Whole-mount immunofluorescence labeling of organoids 3 days after infection with Salmonella Paratyphi A w.t. or ΔcdtB carrying the mCherry-expressing plasmid pLS002 using antibodies against γH2AX (green), phalloidin (white), and Hoechst (blue). Scale bar, 20 μm. (D) Model for categorization of uninfected cells according to the distance from the infected cell at position 0 (red). Orange represents the first three rings of non-infected cells (positions 1 to 3), and green represents the next three rings (positions 4 to 6). (E) Percentage of cells positive for the DNA damage marker γH2AX depending on their distance from the infected cell. The dashed blue line represents the average percentage of γH2AX-positive cells in uninfected organoids (SD = 0.97). *, P < 0.05; **, P < 0.01 (compared to uninfected cells). Infected cells are defined as cells with >5 bacteria, and γH2AX-positive cells are cells with >3 foci.
FIG 4
FIG 4
Generation of gallbladder mucosoids and long-term infection experiments. (A) Schematic of gallbladder mucosoid cultivation and infection procedure. (From left to right) After seeding, a polarized cell layer of gallbladder cells begins to form on the collagen-coated polycarbonate filter in the transwell insert. Primary cell medium is provided around the cell culture insert and on top of the cells. At day 3, the upper medium is withdrawn, and cells start to produce mucus. From day 10 onward, the culture is stable, and infection experiments can be performed by administering Salmonella on the cell layer. (B) Detailed view of long-term infection of human gallbladder mucosoids with S. enterica Paratyphi A and transmission electron microscopy. Stable long-term infection can be reached with both the wild type and the cdtB deletion mutant by applying gentamicin for 24 h and then withdrawing it again from the medium. Internalization and perinuclear localization of the bacteria within lysosomal structures is visible. Two zoomed-in images of intracellular bacteria are shown. b, bacterium; n, nucleus. Scale bar, 1 μm. (C) Establishment of mucosoids. The development of a polarized monolayer of gallbladder cells in an air-liquid cultivation (“mucosoids”) and transmission electron microscopy images of non-infected control (NI) and infected with S. Paratyphi A w.t. and isogenic ΔcdtB KO strains for 2 days are shown. Scale bar, 10 μm. (D) Top view of infected and non-infected gallbladder mucosoids. Staining was performed for γH2AX (green), Salmonella (red), phalloidin (white), and nuclei (blue). Cultures infected for 6 days show DNA damage, whereas there is no damage visible in the non-infected control. Scale bar, 20 μm. (E) Heat map of manually selected NF-κB target genes. A comparison of w.t. and ΔcdtB infections at 2 and 7 days post infection is shown. The heatmap was plotted using the normalized expression values (log-normalized intensity) relative to the non-infected control at each time point (logFC). (F) Heatmap of normalized enrichment scores from GSEA for genes preferentially expressed in distinct cell cycle phases (58) for comparisons of mucosoid cultures with w.t. or ΔcdtB strain infections at 2 and 7 days post infection relative to non-infected controls.
FIG 5
FIG 5
Intoxication of primary cell 2D monolayers with typhoid toxin-containing Salmonella supernatant. (A) Western blot analysis of γH2AX levels in primary cells after exposure to Salmonella supernatant or etoposide for 24 h. Relative densitometry values, normalized to the sterile medium condition (=1), are shown above the bands. (B) Comet assay showing that DNA damage, seen as a tail of DNA after electrophoresis, is higher after exposure to supernatant from w.t. Salmonella than from the cdtB deletion mutant. Etoposide served as a positive control. Pictures of two representative nuclei per condition are shown. (C) Quantification of the comet assay, shown as means ± the SEM. ****, P < 0.0001. (D) Immunofluorescence analysis of cells intoxicated or treated with etoposide for 24 h with antibodies against γH2AX (green) and Ki67 (red); nuclei were stained with Hoechst (blue). Scale bar, 25 μm. (E) Quantification of Ki67+ cells in intoxicated cells. Unlike cells treated with etoposide, cells intoxicated with w.t. Salmonella supernatant do not stop proliferation despite the presence of DNA DSBs. (F) Quantification of DNA damage in proliferating and non-proliferating cells. The intensity of the γH2AX signal was quantified for each Ki67 positive and negative nucleus, using ImageJ. Data shown as means ± the SEM. ***, P < 0.001; ****, P < 0.0001. (G) Primary cell monolayers infected for 3 days with Salmonella Paratyphi A transformed with the mCherry expressing vector pLS002 (red) and fluorescently labeled with antibodies against γH2AX (green) and Ki67 (white); nuclei were labeled with Hoechst (blue). Scale bar, 10 μm.

Similar articles

Cited by

References

    1. Kanthan R, Senger J-L, Ahmed S, Kanthan SC. 2015. Gallbladder cancer in the 21st century. J Oncol 2015:967472–967472. doi:10.1155/2015/967472. - DOI - PMC - PubMed
    1. Randi G, Franceschi S, La Vecchia C. 2006. Gallbladder cancer worldwide: geographical distribution and risk factors. Int J Cancer 118:1591–1602. doi:10.1002/ijc.21683. - DOI - PubMed
    1. Crawford RW, Gibson DL, Kay WW, Gunn JS. 2008. Identification of a bile-induced exopolysaccharide required for Salmonella biofilm formation on gallstone surfaces. Infect Immun 76:5341–5349. doi:10.1128/IAI.00786-08. - DOI - PMC - PubMed
    1. Crawford RW, Rosales-Reyes R, Ramírez-Aguilar ML, Chapa-Azuela O, Alpuche-Aranda C, Gunn JS. 2010. Gallstones play a significant role in Salmonella spp. gallbladder colonization and carriage. Proc Natl Acad Sci U S A 107:4353–4358. doi:10.1073/pnas.1000862107. - DOI - PMC - PubMed
    1. Gonzalez-Escobedo G, Gunn JS. 2013. Gallbladder epithelium as a niche for chronic salmonella carriage. Infect Immun 81:2920–2930. doi:10.1128/IAI.00258-13. - DOI - PMC - PubMed