. 2020 Oct;30(10):1393-1406.
doi: 10.1101/gr.257576.119. Epub 2020 Sep 22.

Distinct contributions of DNA methylation and histone acetylation to the genomic occupancy of transcription factors

Affiliations

Distinct contributions of DNA methylation and histone acetylation to the genomic occupancy of transcription factors

Martin Cusack et al. Genome Res. 2020 Oct.

Abstract

Epigenetic modifications on chromatin play important roles in regulating gene expression. Although chromatin states are often governed by multilayered structure, how individual pathways contribute to gene expression remains poorly understood. For example, DNA methylation is known to regulate transcription factor binding but also to recruit methyl-CpG binding proteins that affect chromatin structure through the activity of histone deacetylase complexes (HDACs). Both of these mechanisms can potentially affect gene expression, but the importance of each, and whether these activities are integrated to achieve appropriate gene regulation, remains largely unknown. To address this important question, we measured gene expression, chromatin accessibility, and transcription factor occupancy in wild-type or DNA methylation-deficient mouse embryonic stem cells following HDAC inhibition. We observe widespread increases in chromatin accessibility at retrotransposons when HDACs are inhibited, and this is magnified when cells also lack DNA methylation. A subset of these elements has elevated binding of the YY1 and GABPA transcription factors and increased expression. The pronounced additive effect of HDAC inhibition in DNA methylation-deficient cells demonstrates that DNA methylation and histone deacetylation act largely independently to suppress transcription factor binding and gene expression.


Figures

Figure 1.
Figure 1.
Disruption of HDAC activity and DNA methylation in mouse embryonic stem cells. (A) Schematic of the experimental approach used in this study. (B) Immunoblot analysis of global histone H3 and H4 acetylation levels after 36-h TSA treatment in mESCs. Samples were derived from three biological replicate experiments. (C) Representative snapshot of genomic region showing H3ac ChIP-seq read coverage calibrated to the spike-in galGal4 genome. (D) Metaplot showing the average calibrated H3ac ChIP-seq signal from DMSO- or TSA-treated wild-type and DNMT.TKO cells in 10-kb regions surrounding the center of ChIP-seq peaks (n = 28608). (E) Distribution of H3ac ChIP-seq reads within genomic intervals separated into three mutually exclusive categories. For every sample, the number of mm10 reads overlapping each category was divided by the total number of reads mapping to the galGal4 genome. Data are represented as the mean; points indicate the values for two biological replicates.
Figure 2.
Figure 2.
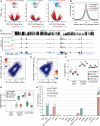
DNA methylation and HDAC activity have distinct contributions to the chromatin accessibility landscape. (A) Volcano plots representing the false discovery rate (FDR) and fold change values obtained through pairwise differential analyses of ATAC-seq signal at 83,395 THSs. Regions with significantly differential accessibility are shown in red on the scatterplots and their numbers are summarized in the form of pie charts (light blue = significant decrease; red = significant increase). (B) Metaplot showing the average ATAC-seq signal from DMSO- or TSA-treated wild-type and DNMT.TKO cells in 4-kb regions surrounding the center of THSs (n = 83,395). (C) Representative UCSC Genome Browser snapshot showing CpG methylation levels and ATAC-seq read coverage. (D) Scatterplot comparing the fold change in ATAC-seq signal following TSA treatment in DNMT.TKO versus wild-type cells. (E) Scatterplot comparing the fold change in ATAC-seq signal after loss of DNA methylation versus the change seen following TSA treatment in wild-type cells at 83,395 THSs. In D and E, the dashed line has a slope of 1 and intercept of 0. Colors indicate density of points per graph area. SCC = Spearman's correlation coefficient. (F) Box plots summarizing the percentage of reads from each ATAC-seq library that map to intervals split into three mutually exclusive categories. Two-tailed Student's t-tests; (*) P-value < 0.05, (**) P-value < 0.01, (ns) nonsignificant (P-value > 0.05). (G) Box plots summarizing the distribution of reads from each ATAC-seq library that map to intervals split into three mutually exclusive categories, relative to the distribution expected by chance, that is, if non-THS reads were shuffled randomly within the genomic space outside of THSs. Values shown in F are divided by those in Supplemental Figure S3B. (H) Distribution of ATAC-seq reads across different classes of repetitive elements as a percentage of the total library size. Data are represented as mean + SD. Two-tailed Student's t-tests; (*) P-value < 0.05, (**) P-value < 0.01, nonsignificant differences are not indicated.
Figure 3.
Figure 3.
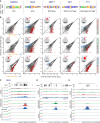
DNA methylation and HDAC activity can modulate transcription factor occupancy. (A) For each transcription factor, the position weight matrix (PWM) of its known motif and its DNA-binding domain (DBD) type are shown. (B) Pairwise comparisons of normalized GABPA, MAX, NRF1, SP1, or YY1 ChIP-seq signal for all identified occupancy peaks. Regions with significantly differential occupancy are colored on the scatterplots, and their numbers are summarized in the form of pie charts (light blue = significant decrease; red = significant increase). ChIP-seq signal from three biological replicate samples was averaged. (C–E) Representative UCSC Genome Browser snapshots showing CpG methylation levels, ATAC-seq, MAX ChIP-seq, and Input ChIP-seq read coverage.
Figure 4.
Figure 4.
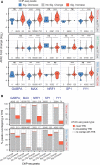
Characteristics of transcription factor (TF) binding sites. (A) Distribution of CpG methylation levels within the TF motifs that underlie ChIP-seq peaks. For each TF, we isolated all sequences that were located within peak regions that matched the relevant position weight matrix and determined the methylation status of the CpG nucleotides. CpG sites are grouped according to their differential occupancy. Black dots indicate the median. (B) Distribution of maximum log-odds scores found at different subsets of ChIP-seq peaks. Within each interval of the GABPA, MAX, NRF1, SP1, and YY1 peak-sets, the sequence most similar to the respective PWM was identified and its log-odds score, indicative of the deviation from the consensus sequence, was plotted. Black dots indicate the median. The dashed lines indicate the log-odds score threshold above which a sequence is said to match the PWM. (C) Fraction of ChIP-seq peaks that overlap an annotated transposable element. ChIP-seq peaks are classified based on their differential occupancy.
Figure 5.
Figure 5.
Transcription factor occupancy can promote chromatin accessibility in mESCs with perturbed DNA methylation or HDAC activity. (A) Quantitation of ATAC-seq fold change at transcription factor ChIP-seq peaks grouped according to their differential occupancy. Black dots indicate the median ATAC-seq fold change. One-tailed Mann–Whitney U tests; (*) P-value <0.05, (**) P-value <0.01, (***) P-value < 0.001, (****) P-value < 10−10, (ns) nonsignificant (P-value > 0.05). (B) Percentage of ChIP-seq peaks that overlap with a Tn5 hypersensitive site (THS). In the top panel, a “pre-existing” THS refers to an ATAC-seq peak identified in samples generated from untreated WT cells, whereas a novel THS is identified in DNMT.TKO but not WT cells. In the bottom panel, a “pre-existing” THS was identified in samples generated from untreated DNMT.TKO cells, whereas a novel THS is identified in TSA-treated DNMT.TKO cells only.
Figure 6.
Figure 6.
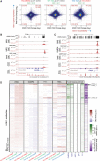
DNA methylation loss and HDAC inhibition affect the expression of specific genes and retrotransposons. (A) Changes in accessibility at every THS region were compared to changes in expression at their closest gene. The analysis was performed on 60052 THS:gene pairs involving 15,298 genes. The numbers of THSs associated with significant changes in both accessibility and gene expression are indicated in red in each quadrant. In parentheses are indicated the expected numbers of sites showing both significant changes in accessibility and gene expression based on the total number of significant differential events. SCC = Spearman's correlation coefficient. (B,C) Representative UCSC Genome Browser snapshots showing CpG methylation levels, ChIP-seq, ATAC-seq, and strand-specific RNA-seq read coverage. The position of genes and that of sequences that match the TF motifs are shown. (D) For each LINE-1 subtype (N = 132), we plotted the fold change in ATAC-seq, ChIP-seq, or RNA-seq signal along with scores relating to their sequence conservation (purple) or the presence of selected TF binding motifs (green). LINE-1 subtypes were sorted based on ATAC-seq adjusted P-values when comparing TSA- to DMSO- treated DNMT.TKO cells. See also Supplemental Table S3.
Figure 7.
Figure 7.
Summary model illustrating impact of DNA methylation and HDAC inhibition on transcription factor occupancy.

References

    1. Akagi K, Li J, Stephens RM, Volfovsky N, Symer DE. 2008. Extensive variation between inbred mouse strains due to endogenous L1 retrotransposition. Genome Res 18: 869–880. 10.1101/gr.075770.107 - DOI - PMC - PubMed
    1. Anderson JD, Lowary PT, Widom J. 2001. Effects of histone acetylation on the equilibrium accessibility of nucleosomal DNA target sites. J Mol Biol 307: 977–985. 10.1006/jmbi.2001.4528 - DOI - PubMed
    1. Athanikar JN, Badge RM, Moran JV. 2004. A YY1-binding site is required for accurate human LINE-1 transcription initiation. Nucleic Acids Res 32: 3846–3855. 10.1093/nar/gkh698 - DOI - PMC - PubMed
    1. Auclair G, Guibert S, Bender A, Weber M. 2014. Ontogeny of CpG island methylation and specificity of DNMT3 methyltransferases during embryonic development in the mouse. Genome Biol 15: 545 10.1186/s13059-014-0545-5 - DOI - PMC - PubMed
    1. Beard C, Li E, Jaenisch R. 1995. Loss of methylation activates Xist in somatic but not in embryonic cells. Genes Dev 9: 2325–2334. 10.1101/gad.9.19.2325 - DOI - PubMed

Publication types