. 2020 Sep 22;11(1):4786.
doi: 10.1038/s41467-020-18466-w.

IL-33-ST2 axis regulates myeloid cell differentiation and activation enabling effective club cell regeneration

Affiliations

IL-33-ST2 axis regulates myeloid cell differentiation and activation enabling effective club cell regeneration

Rania Dagher et al. Nat Commun. .

Abstract

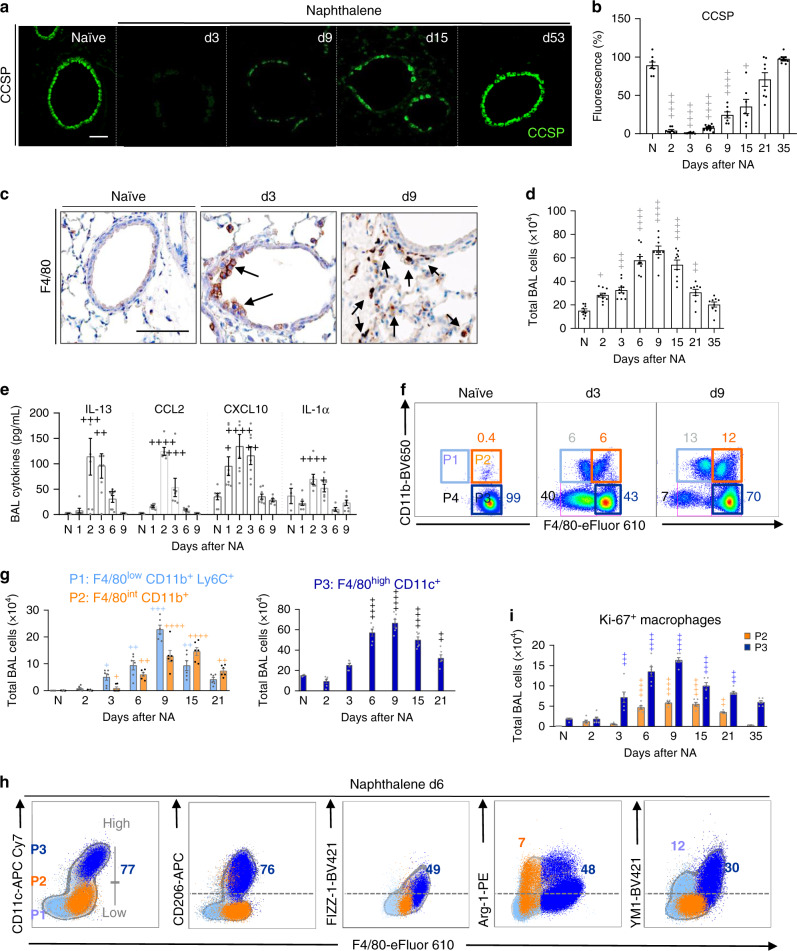
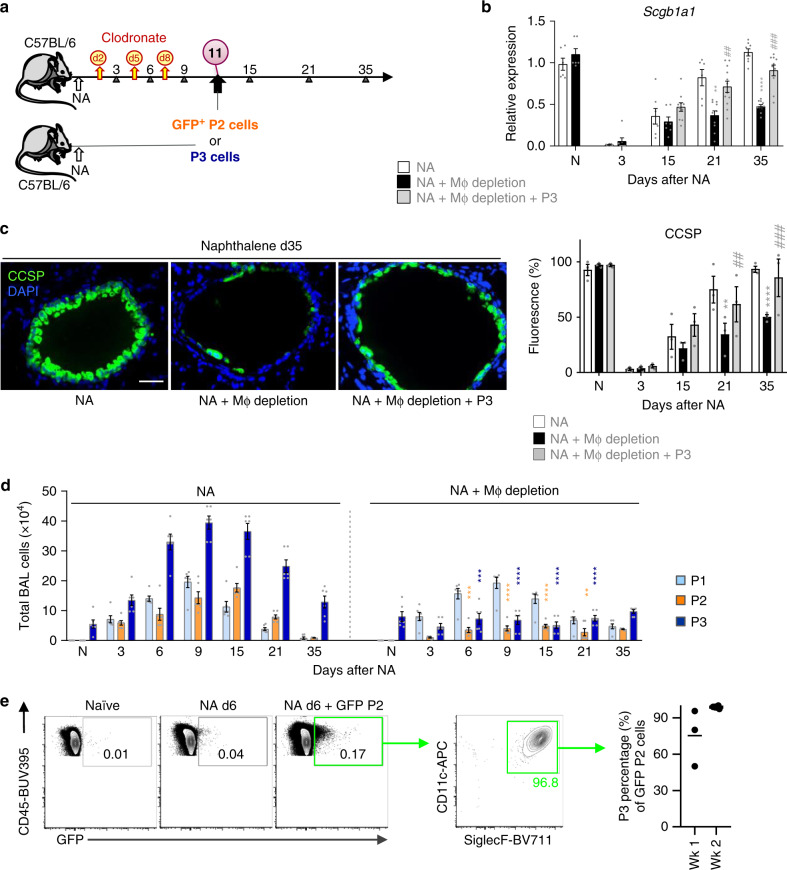
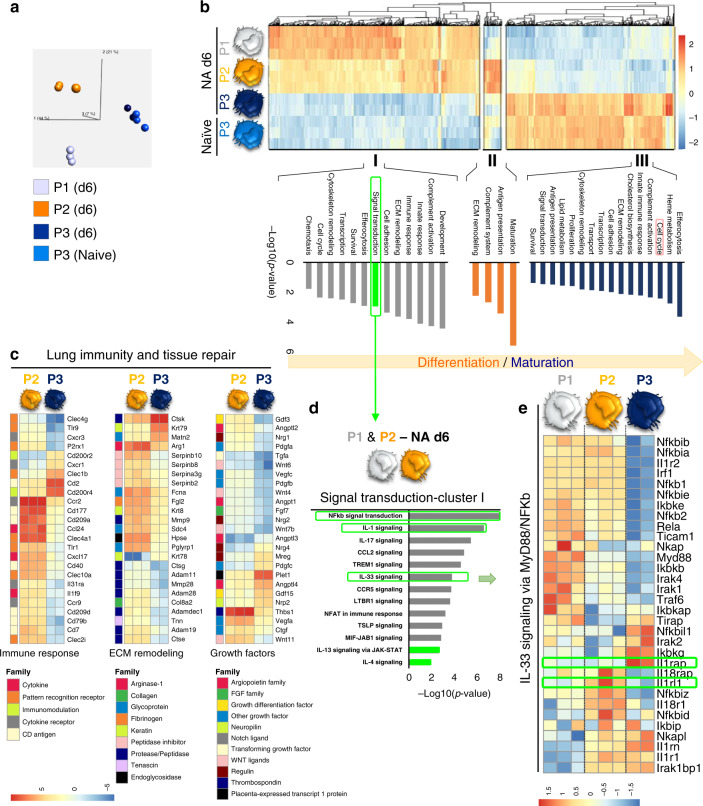
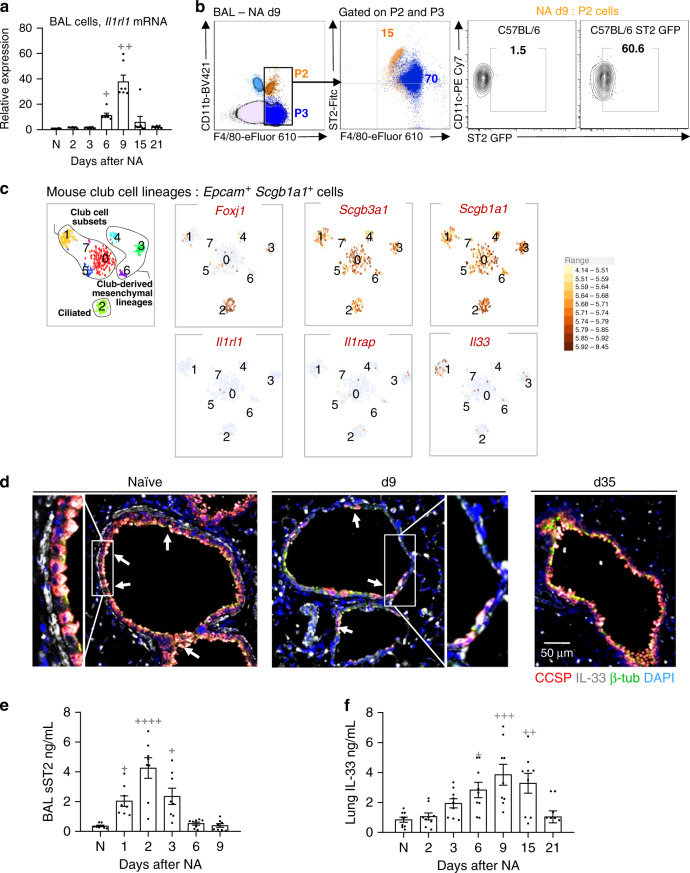
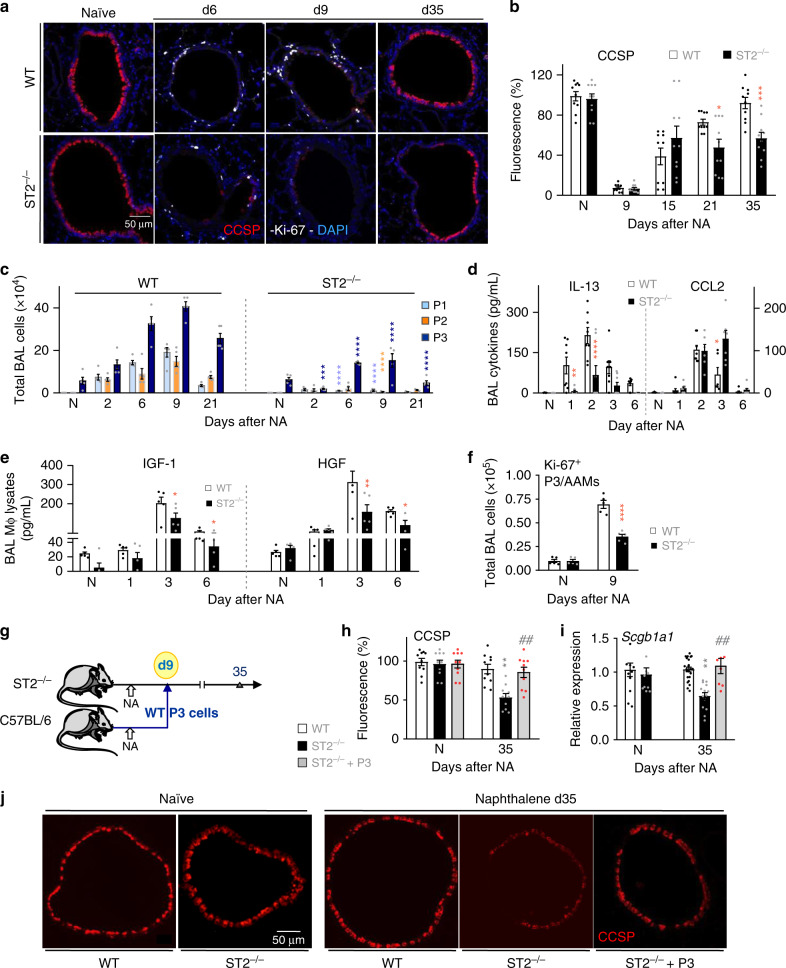
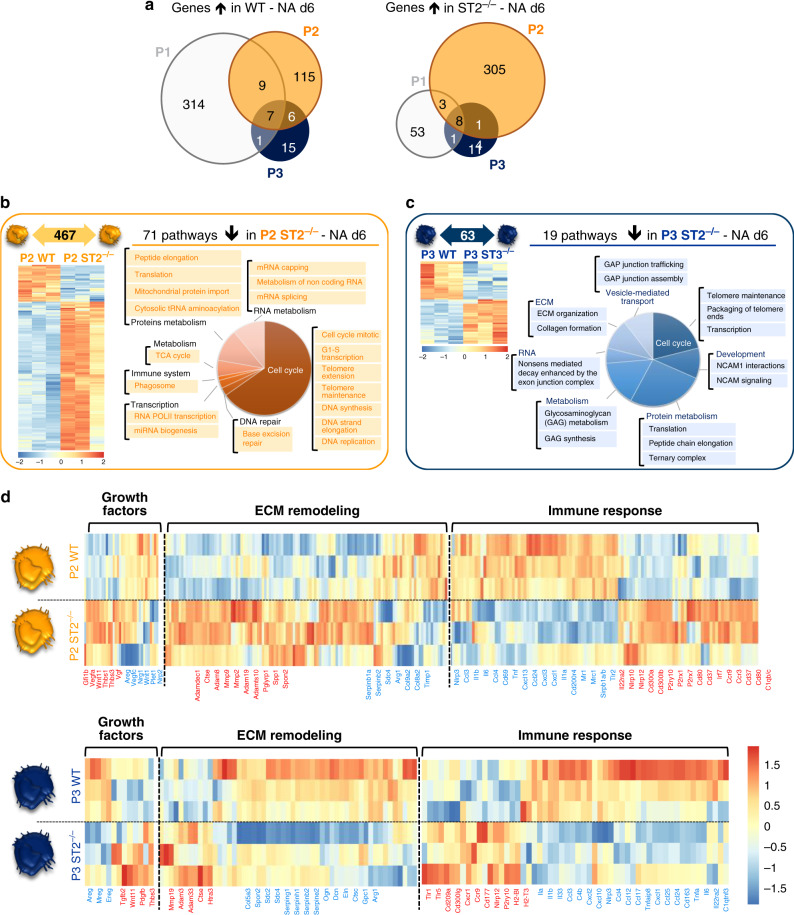
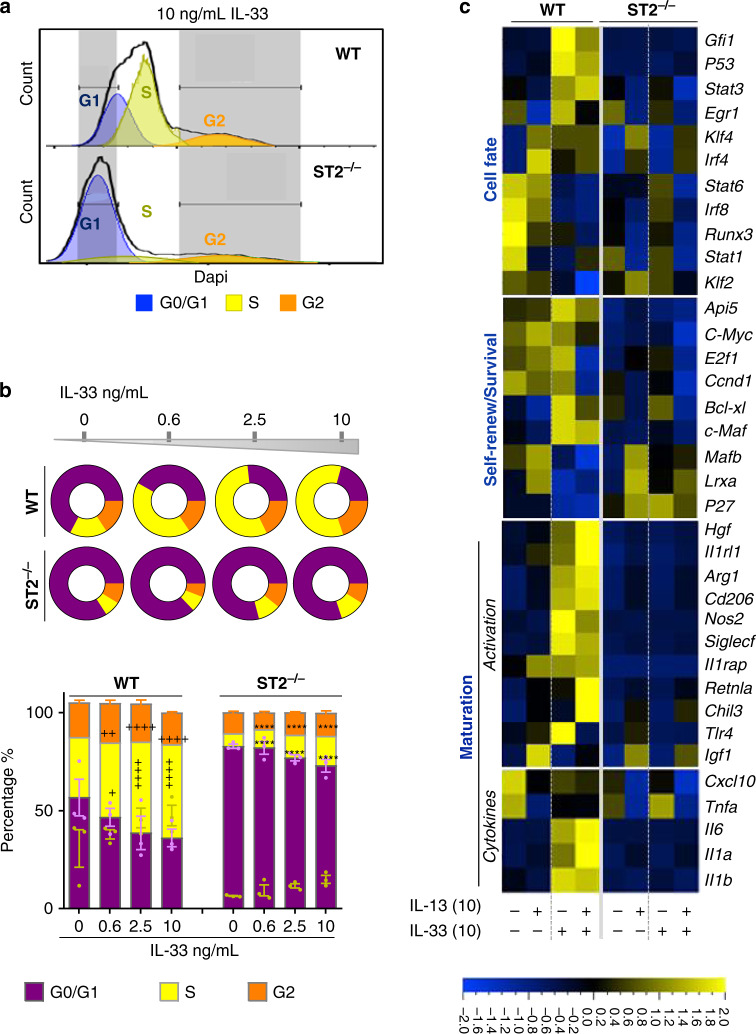
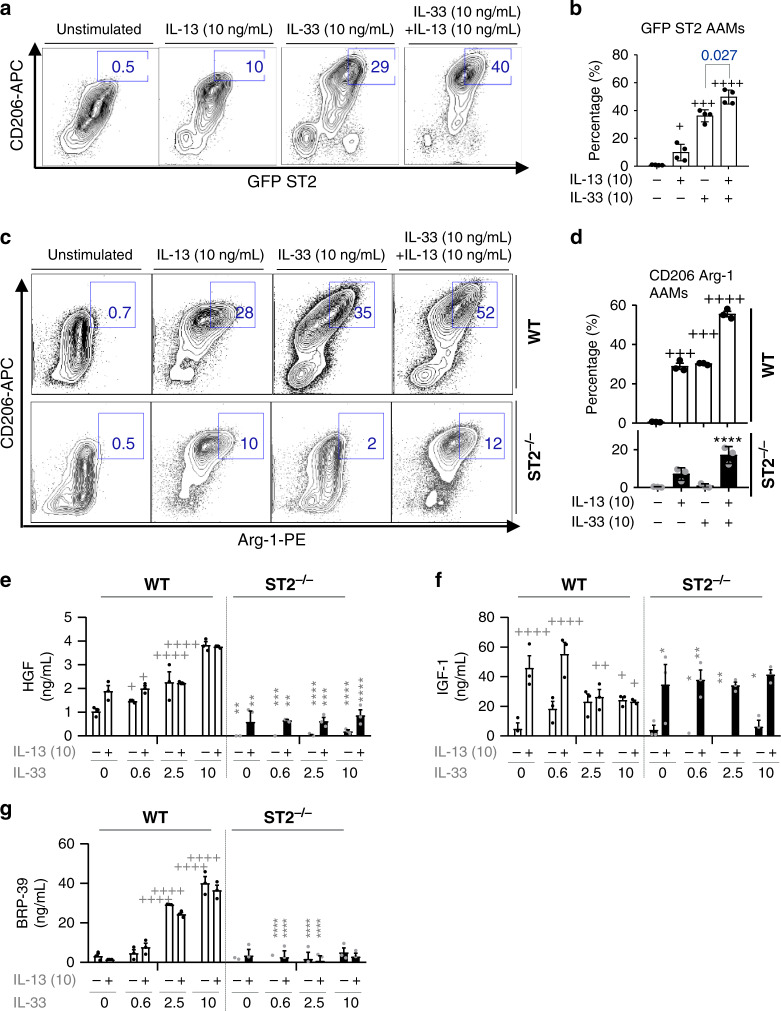
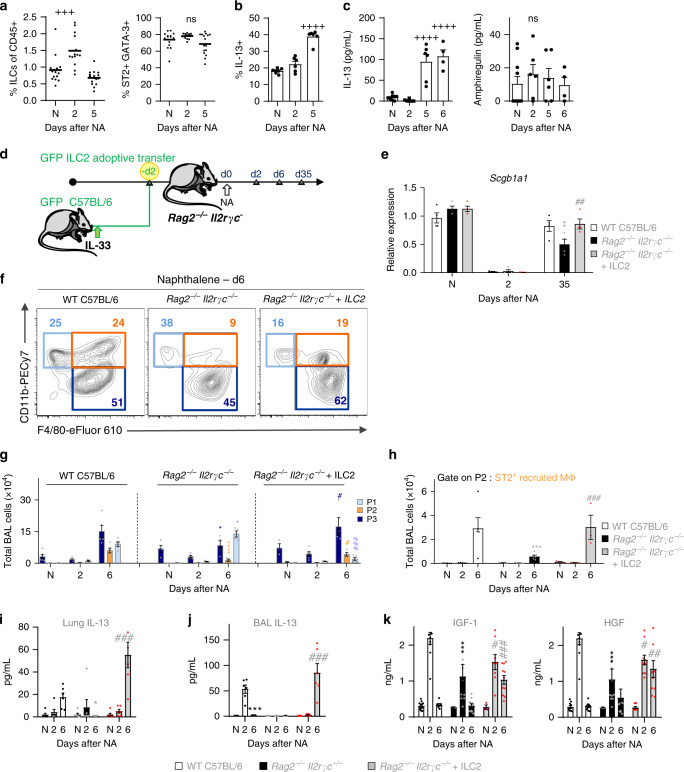
Evidence points to an indispensable function of macrophages in tissue regeneration, yet the underlying molecular mechanisms remain elusive. Here we demonstrate a protective function for the IL-33-ST2 axis in bronchial epithelial repair, and implicate ST2 in myeloid cell differentiation. ST2 deficiency in mice leads to reduced lung myeloid cell infiltration, abnormal alternatively activated macrophage (AAM) function, and impaired epithelial repair post naphthalene-induced injury. Reconstitution of wild type (WT) AAMs to ST2-deficient mice completely restores bronchial re-epithelialization. Central to this mechanism is the direct effect of IL-33-ST2 signaling on monocyte/macrophage differentiation, self-renewal and repairing ability, as evidenced by the downregulation of key pathways regulating myeloid cell cycle, maturation and regenerative function of the epithelial niche in ST2-/- mice. Thus, the IL-33-ST2 axis controls epithelial niche regeneration by activating a large multi-cellular circuit, including monocyte differentiation into competent repairing AAMs, as well as group-2 innate lymphoid cell (ILC2)-mediated AAM activation.


Conflict of interest statement

The authors R.D., A.M.C., A.B., J.W., J.W., X.Q., Y.S., R.R., R.K., and A.A.H. are/were employed by and shareholders of AstraZeneca. The author M.P. received funding from MedImmune/AstraZeneca. The remaining authors declare no competing interests.

Figures

Fig. 1
Fig. 1. Macrophages predominate during epithelial repair and exhibit AAM phenotype.
ai WT C57BL/6 mice were untreated (naïve, N) or treated with naphthalene (NA) and analyzed at various days thereafter. a Bronchiolar epithelium regeneration after NA-induced injury, as assessed by immunofluorescence staining of CCSP in lung tissue sections. b Quantification of CCSP expression in lung tissue sections from naïve and NA-treated mice, expressed as percentage of fluorescence within bronchioles (150–400 µm diameter), at the indicated time-points after NA. c Immunohistochemical analysis of F4/80 expression (brown deposit) illustrating macrophage localization (black arrows) around the injured bronchiolar epithelium in lung tissue sections. d Quantification of the total number of cells in the bronchoalveolar lavage (BAL). e Levels of IL-13, CCL2, CXCL10, and IL-1α in BAL supernatants. f Monocyte/macrophage subsets (P1–P4). Inflammatory monocytes F4/80low CD11b+ (P1), recruited macrophage F4/80int CD11b+ (P2), resident macrophages F4/80high CD11b (P3) and apoptotic macrophages Annexin V+ F4/80low CD11b (P4) in the BAL are defined by their gates in (f). g Total cell numbers of P1–P3 subsets at the indicated time-points after NA administration. h Representative FACS profiles of BAL cells obtained on d6 after NA, illustrating the expression of CD206, FIZZ-1, YM1, and Arg-1 in P1–P3 BAL cell subsets, respectively. i Quantification of BAL macrophage proliferation as assessed by FACS analysis on P2 and P3 subsets, using Ki-67 staining. Data are from 8 (ae) and 6 (g, i) mice, obtained in 3 independent experiments, and represented as mean ± SEM. *P < 0.05, **P < 0.01, ***P < 0.001 and ****P < 0.0001 between NA-treated and naïve WT mice using one-way ANOVA, Bonferroni post-test. Scale bars in a and c = 100 µm.
Fig. 2
Fig. 2. AAM resident airway macrophages (P3) are essential for bronchiolar epithelial regeneration.
a Schematic for clodronate (CL)-mediated macrophage depletion during naphthalene treatment (NA + macrophage depletion). NA-treated macrophage-depleted mice were then either given no cells or intratracheally adopted with GFP+ P2 or P3 cells (NA + P3/AAM adoptive transfer). b Levels of the Scgb1a1 mRNA in total lung homogenates from NA-treated mice ± macrophage depletion. c Assessment of club cell regeneration after NA-induced injury in lung tissue of NA-treated WT mice (Control) or NA-injected mice treated with clodronate liposomes (Depleted) or AAM adoptively transferred into depleted mice (see Fig. 2a). CCSP immunofluorescence staining was performed at d35. Graph on the right represents CCSP quantification in lung tissue sections, expressed as percentage of fluorescence within bronchioles (150–400 µm diameter). d Total BAL cells subdivided into P1–P3 gates as defined in (Fig. 1f) determined by counting and flow cytometry from NA-treated mice ± macrophage depletion. e Representative flow plots illustrating the percentage of adoptively transferred GFP+ P2 cells that switched into CD11c+ SiglecF+ cells after 1 week in the lungs of depleted mice. Graph on the right represents the quantification of CD11c+ SiglecF+ GFP+ cells. Data are from 6 to 10 (b), 3 (c), 6 (d), and 3 to 7 (e) mice, obtained in three independent experiments and represented as mean ± SEM. *P < 0.05, **P < 0.01, ***P < 0.001 and ****P < 0.0001 between macrophage-depleted and NA-treated WT mice using one-way ANOVA, Bonferroni post-test. #P < 0.05, ##P < 0.01 and ###P < 0.001 between AAM adoptively transferred and macrophage-depleted WT mice using one-way ANOVA, Bonferroni post-test. Scale bar in c = 50 µm.
Fig. 3
Fig. 3. Airway macrophages are transcriptionally primed to support epithelial repair and display IL-33-ST2 activation during their differentiation process.
ae Transcriptional profiling of myeloid cell subsets flow-sorted from naïve and NA-treated mice on d6. a Principal component analysis (PCA) of the transcriptomes of flow-sorted monocytes (P1), monocyte-derived macrophages (P2), and resident AAMs (P3) performed on all expressed genes identified from a generalized linear model to perform an ANOVA-like test for differential expression between any conditions in the dataset (FDR step-up procedure q-value < 0.05. b k-means clustering of all identified genes revealed core gene signatures specific to P1 (Cluster I), P2 (Cluster II), and P3 (Cluster III). The pathway enriched processes associated with each cluster are shown on the bottom of the heatmap. Scale bar on the bottom denotes relative log2 differences in gene expression for each row. c Heatmaps showing the top relative expression of DEG that are associated with macrophage ability to modulate the epithelial cell niche. Those functions include growth factors secretion, extracellular matrix (ECM) remodeling and immune response regulation between P2 and P3 cells. d, e Score plot illustrating the signal transduction pathways upregulated in Cluster I (d), highlighting the overrepresentation of IL-33 signaling and MyB88/NFkb axis in the different subsets of myeloid cells (e).
Fig. 4
Fig. 4. IL-33-ST2 axis is activated in airway macrophages during bronchial re-epithelialization.
a Relative mRNA expression of Il1rl1 as determined by qPCR for total BAL macrophages. b FACS quantification as percentage of ST2 expression on P2 and P3 cells of total cells in BAL. Results were confirmed using GFP ST2 reporter mice in the right panel. c Single-cell RNA-sequencing analysis of mouse naïve bronchial epithelial lineages showing t-SNE plots of club cell lineages as identified by Scgb1a1 and Scgb3a1. Clusters 0, 1, 5, and 7 represent club-epithelial lineages subsets. Gene expression plots demonstrating expression of IL-33 in a proportion of club cells (Cluster 1). High expression of Foxj1 in Cluster 2 identifies club-derived ciliated cell. Other clusters (3, 4, and 6) are club-derived mesenchymal lineages. Scale bar to the right denotes normalized gene expression level of marker’s gene for each cell. d Representative sections from histological staining of CCSP (red), IL-33 (white), β-tubulin (green), and nuclear content (DAPI, blue) in lung sections. White arrows indicate IL-33-containing club cells. e soluble ST2 (sST2) levels in the BAL supernatants. f Levels of IL-33 in homogenized lung samples. Data from n = 7 (a, d), 8 (e), and 9 (f) mice are representative of at least three independent series of experiments and show mean ± SEM. *P < 0.05, **P < 0.01, ***P < 0.001 and ****P < 0.0001 between NA-treated and naïve (N) WT mice using one-way ANOVA, Bonferroni post-test. Scale bar in d = 50 µm. t-SNE (t-distribution stochastic neighbor embedding) plots in graph c show data from one experiment (n = 1).
Fig. 5
Fig. 5. IL-33-ST2-axis contributes to AAM-mediated bronchial reepithelialization.
a Co-immunofluorescence staining of CCSP and Ki-67 in lung tissue sections from naïve (N) and NA-injected wild-type (WT) and ST2/− mice, at indicated time-points. b Quantification of CCSP in lung tissue sections, expressed as percentage of fluorescence within bronchioles (150–400 µm diameter). c Absolute numbers of P1–P3 subsets. d IL-13 and CCL2 levels in BAL supernatants. e Quantification of IGF-1 and HGF in BAL macrophage lysates. f Quantification of Ki-67+ AAMs in BAL samples from mice. gj Schematic representation (g) of the procedure used for P3/AAM adoptive transfer into ST2/− mice on d9 after NA administration (ST2−/ + AAM adoptive transfer), and immunofluorescence staining of CCSP in lung tissue sections (j). Quantification of CCSP in lung tissue sections (h), expressed as percentage of fluorescence within bronchioles (150–400 µm diameter), and Scgb1a1 mRNA levels in lung homogenates (i). Data from n = 10 (a, b), 5 (c), 8 (d), 5 (e), 5 (f), 10 (h, j) and 8–23 (i) mice are representative of at least 2–3 independent experiments and represented as mean ± SEM. *P < 0.05, **P < 0.01, ***P < 0.001 and ****P < 0.0001 between NA-treated ST2−/− and NA-treated WT mice using one-way (b, e, f, h, and i) and two-way (c, d) ANOVA, Bonferroni post-test. #P < 0.05, ##P < 0.01 and ###P < 0.001 between AAM adoptively transferred and NA-treated ST2−/− mice using one-way ANOVA, Bonferroni post-test. Scale bars in a and j = 50 µm.
Fig. 6
Fig. 6. Lack of ST2 severely altered the transcriptome of airway macrophages.
ad Transcriptomic profiling of myeloid cells flow-sorted from ST2−/− and WT mice 6 days after NA treatment. a Summary of differentially expressed genes (P < 0.01; FC > 2) in each pairwise comparison showing the total number of differentially expressed genes unique and shared between P1–P3. b, c Heatmaps and summary of the total number of differentially expressed genes (P < 0.01; FC > 2) in P2 (panel b) and P3 (panel c) between WT and ST2−/. The downregulated pathways associated with the gene differentially expressed in ST2−/− for P2 and P3 are illustrated on the right side of the heatmaps. d Heatmaps showing the top relative expression of DEG that are associated with macrophage ability to modulate growth factors secretion, extracellular matrix (ECM) remodeling and immune response regulation between P2 (left panel) and P3 (right panel). Presented in red and blue the gene upregulated and downregulated in ST2−/−, respectively. Scale bar on the bottom denotes relative log2 differences in gene expression for each row.
Fig. 7
Fig. 7. ST2 controls macrophage cell cycle progression and activation in vitro.
ac Bone marrow-derived cells were cultured in M-CSF alone (unstimulated) or cultured in the presence of M-CSF with varying concentrations of IL-13 and IL-33 for 3 days ex vivo. a Representative histograms from WT and ST2−/ BMDMs showing DAPI staining after fixation. Cell cycle phases (G0/G1, S, and G2) are gated by nuclear DNA content. b Quantification of BMDMs in the three cell cycle phases and shown in (a) and disc graphs denote mean only. c Heat-map constructed from Fluidigm analysis of mRNA transcripts for the denoted genes from cultured WT and ST2−/− BMDMs. Scale bar on the bottom denotes relative log2 differences in gene expression for each row. Samples are bone marrow treated and cultured separately from three individual mice per genotype. All bar graphs show means ± SEM. Data from n = 3 mice are representative from two independent experiments. *P < 0.05, **P < 0.01, ***P < 0.001 and ****P < 0.0001 between indicated IL-33-treated and unstimulated BMDMs. *P < 0.05, **P < 0.01, ***P < 0.001 and ****P < 0.0001 between IL-33-stimulated ST2−/− and WT BMDMs using two-way ANOVA, Bonferroni post-test.
Fig. 8
Fig. 8. IL-33 synergizes with IL-13 to ensure a matured macrophage repairing phenotype.
ag Bone marrow-derived cells from WT Balb/c, ST2−/− (Balb/c background), or ST2-GFP (Balb/c) mice were cultured in M-CSF alone (unstimulated), or cultured in the presence of M-CSF with varying concentrations of IL-13 and/or IL-33 for 6 days ex vivo. a Representative flow cytometric plots of CD206 and GFP expression from ST2 GFP bone marrow-derived macrophages (BMDMs). Numbers next to gate denote percentage of CD206+ ST2 GFP+ BMDMs. b Quantification of the frequency of CD206+ GFP ST2+ gated in (a). c Representative flow plots of Arginase-1 (Arg-1) and CD206 expression on WT and ST2−/ BMDMs. Gates and numbers denote the percentage of CD206+ Arg-1+ BMDMs. d Quantification of the frequency of CD206+ Arg-1+ BMDMs from WT or ST2−/− mice as gated in (c). eg Quantification of HGF (e), IGF-I (f), and BRP-39 (g) from the supernatants of WT and ST2−/ BMDMs. Samples are bone marrow treated and cultured separately from three individual mice per genotype. Bar graphs from n = 4 (b), 3 (dg) mice, show mean ± SEM pooled from three independent experiments.
Fig. 9
Fig. 9. Lung ILC2s produce IL-13 after NA injury and contribute to macrophage maturation.
ac Quantification of the frequency of ST2+ GATA-3+ expressing ILCs (a) found in the lung at days 0, 2, and 5 after NA-treatment; N = naïve. ILCs were isolated from the lungs of mice on days 0, 2, 5, and 6 post-NA-treatment and stimulated ex vivo, then flow-stained for IL-13 production and quantified as frequency (b). IL-13 and amphiregulin production were quantified also in stimulated ILC supernatants (c). d Schematic for the transfer of lung ILC2s into Rag2//Il2rγc−/− recipient mice followed by naphthalene administration (Rag2−/−/Il2rγc−/− + ILC2). e Levels of the Scgb1a1 mRNA in total lung homogenates in WT C57BL/6 or Rag2−/−/Il2rγc−/− mice that adoptively received GFP+ ILC2s (Rag2−/−/Il2rγc−/− + ILC2). f Representative flow cytometric plots of P1-P3 subsets of BAL cells from WT C57BL/6 or Rag2−/−/Il2rγc−/− mice that adoptively received GFP+ ILC2s (Rag2−/−/Il2rγc−/− + ILC2). Numbers nears gates denote percentage. g Quantification of total P1–P3 cells in BAL using the gating strategy in (f). h Quantification of the total number of ST2-expressing recruited macrophages (ST2+ P2 recruited macrophages) in the BAL. i Levels of IL-13 in lung homogenates. j, k Levels of IL-13 (j) and IGF-1 and HGF in BAL supernatants (k). Data from n = 15 (a), 6 (b), 3 to 9 (c), 4 (e), 5 (fh), 6 (i, j), and 8 (k) mice, show mean ± SEM pooled from three independent experiments. ***P < 0.001 and ****P < 0.0001 between NA-treated and naïve (N) WT mice using one-way ANOVA, Bonferroni post-test. *P < 0.05, **P < 0.01, ***P < 0.001 and ****P < 0.0001 between NA-treated Rag2−/−/Il2rγc−/− and WT mice using one-way ANOVA, Bonferroni post-test (ac). #P < 0.05, ##P < 0.01 and ###P < 0.001 between AAM adoptively transferred and NA-treated ST2−/− mice using one-way (gk) and two-way ANOVA (e), Bonferroni post-test.

Similar articles

Cited by

References

    1. Beers MF, Morrisey EE. The three R’s of lung health and disease: repair, remodeling, and regeneration. J. Clin. Investig. 2011;121:2065–2073. doi: 10.1172/JCI45961. - DOI - PMC - PubMed
    1. Hong KU, Reynolds SD, Giangreco A, Hurley CM, Stripp BR. Clara cell secretory protein-expressing cells of the airway neuroepithelial body microenvironment include a label-retaining subset and are critical for epithelial renewal after progenitor cell depletion. Am. J. Respir. Cell Mol. Biol. 2001;24:671–681. doi: 10.1165/ajrcmb.24.6.4498. - DOI - PubMed
    1. Stefater JA, Ren S, Lang RA, Duffield JS. Metchnikoff’s policemen: macrophages in development, homeostasis and regeneration. Trends Mol. Med. 2011;17:743–752. doi: 10.1016/j.molmed.2011.07.009. - DOI - PMC - PubMed
    1. Wynn TA, Vannella KM. Macrophages in tissue repair, regeneration, and fibrosis. Immunity. 2016;44:450–462. doi: 10.1016/j.immuni.2016.02.015. - DOI - PMC - PubMed
    1. Murray PJ, et al. Macrophage activation and polarization: nomenclature and experimental guidelines. Immunity. 2014;41:14–20. doi: 10.1016/j.immuni.2014.06.008. - DOI - PMC - PubMed

Publication types

MeSH terms