. 2020 Sep 22;7(1):314.
doi: 10.1038/s41597-020-00628-6.

Consensus transcriptional regulatory networks of coronavirus-infected human cells

Affiliations

Consensus transcriptional regulatory networks of coronavirus-infected human cells

Scott A Ochsner et al. Sci Data. .

Abstract

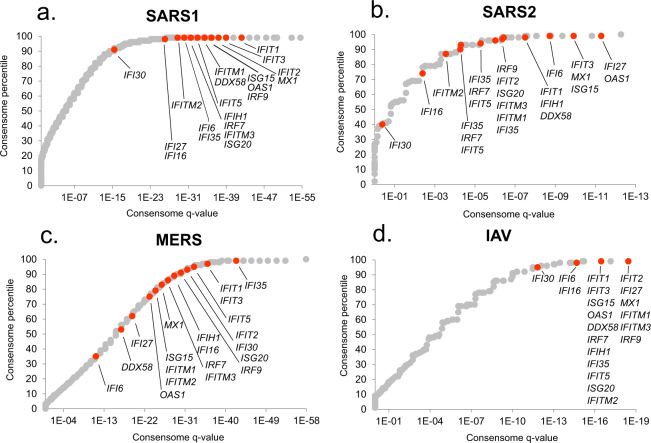
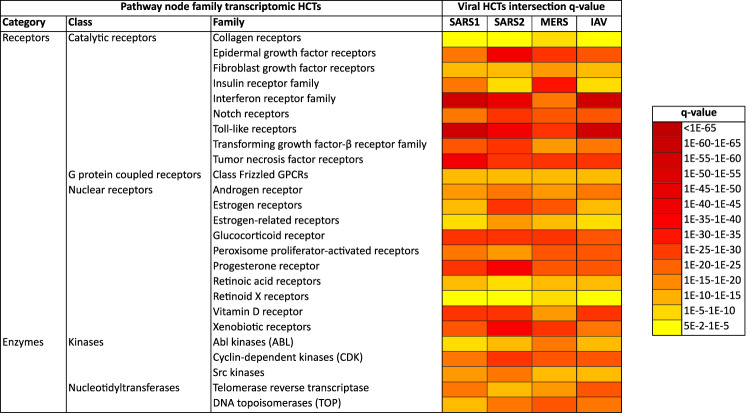
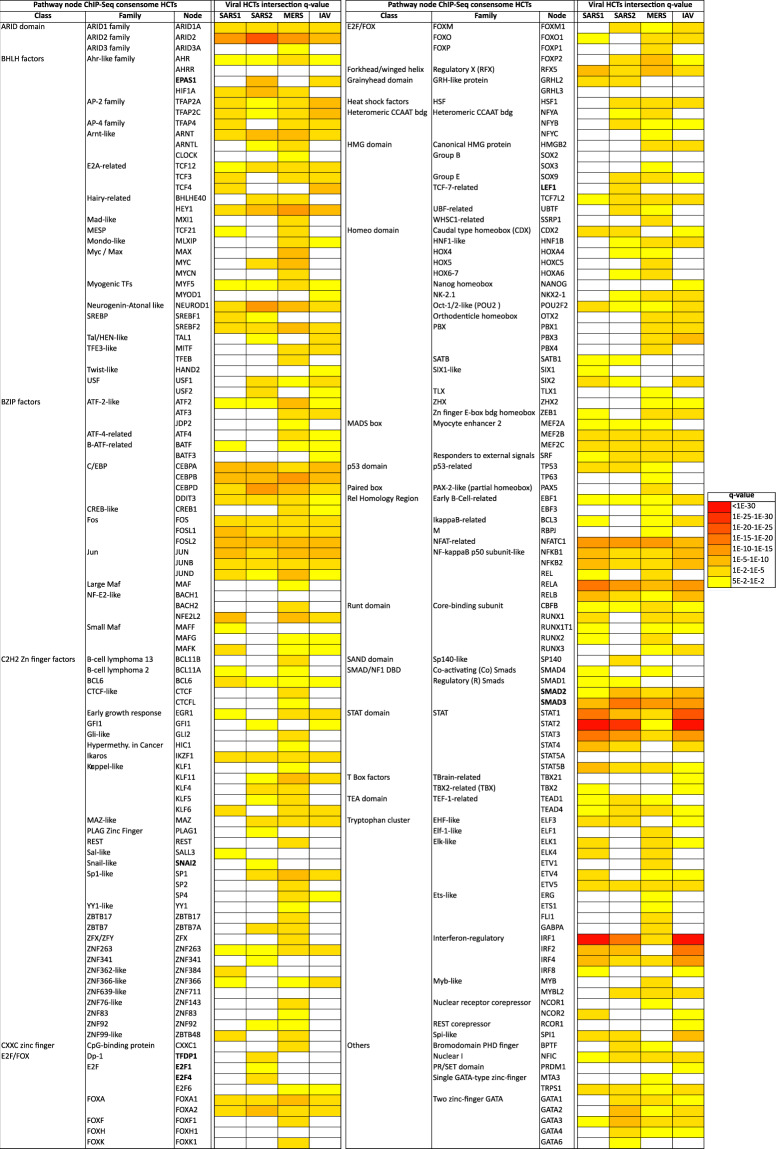
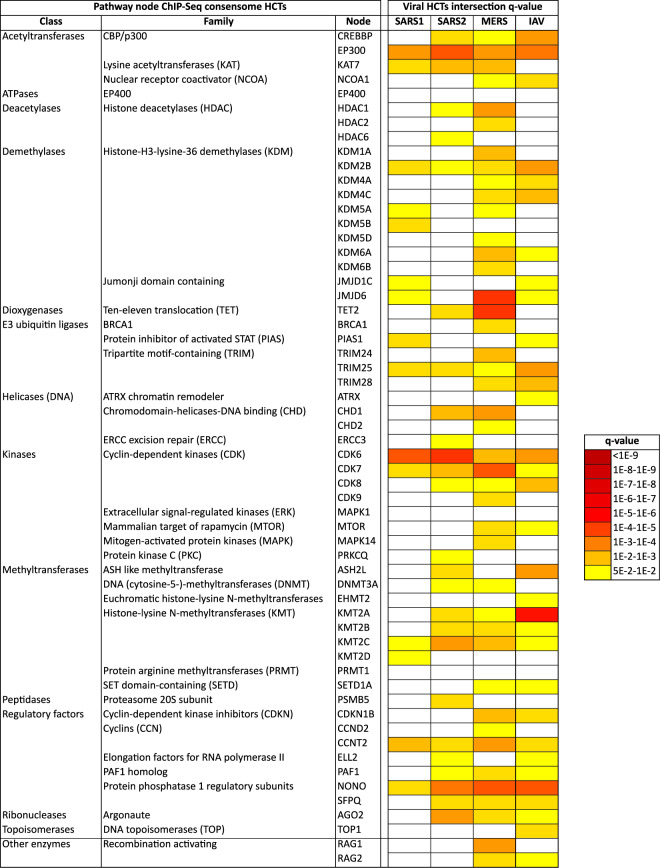
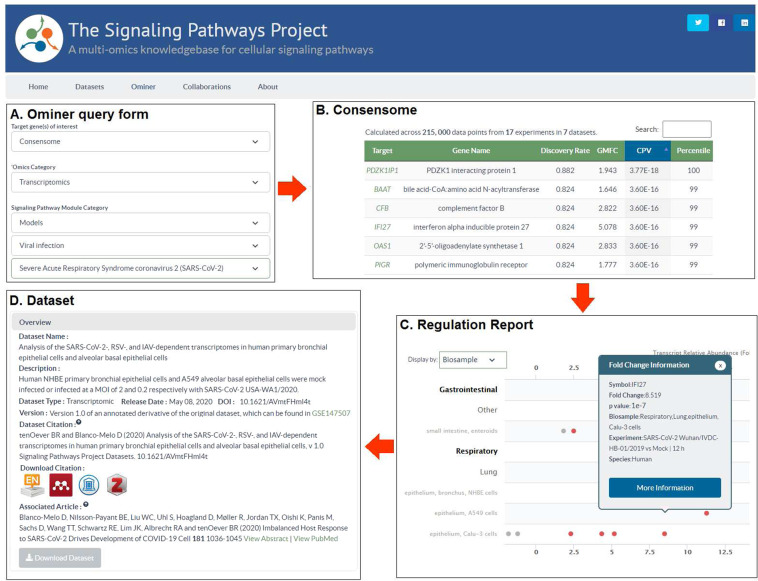
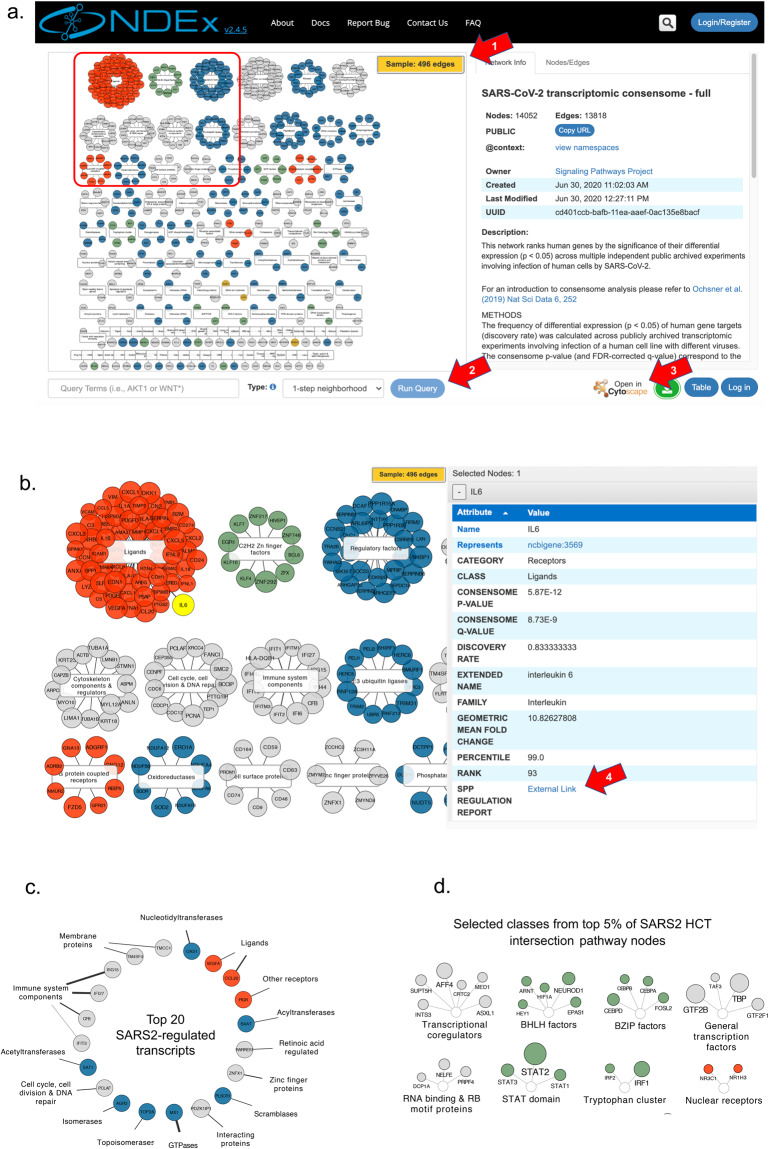
Establishing consensus around the transcriptional interface between coronavirus (CoV) infection and human cellular signaling pathways can catalyze the development of novel anti-CoV therapeutics. Here, we used publicly archived transcriptomic datasets to compute consensus regulatory signatures, or consensomes, that rank human genes based on their rates of differential expression in MERS-CoV (MERS), SARS-CoV-1 (SARS1) and SARS-CoV-2 (SARS2)-infected cells. Validating the CoV consensomes, we show that high confidence transcriptional targets (HCTs) of MERS, SARS1 and SARS2 infection intersect with HCTs of signaling pathway nodes with known roles in CoV infection. Among a series of novel use cases, we gather evidence for hypotheses that SARS2 infection efficiently represses E2F family HCTs encoding key drivers of DNA replication and the cell cycle; that progesterone receptor signaling antagonizes SARS2-induced inflammatory signaling in the airway epithelium; and that SARS2 HCTs are enriched for genes involved in epithelial to mesenchymal transition. The CoV infection consensomes and HCT intersection analyses are freely accessible through the Signaling Pathways Project knowledgebase, and as Cytoscape-style networks in the Network Data Exchange repository.


Conflict of interest statement

The authors declare no competing interests.

Figures

Fig. 1
Fig. 1
Rankings of canonical interferon-stimulated genes (ISGs) in the viral consensomes. Shown are the percentile rankings of 20 ISGS in the SARS1 (a), SARS2 (b), MERS (c) and IAV (d) consensomes. Note that numerous genes have identical q-value and percentile values and are therefore superimposed in the plots. Full consensome data are provided in figshare File 1 sections 2 (SARS1), 3 (SARS2), 4 (MERS) and 5 (IAV); see also Table 1 for links to consensomes in the SPP knowledgebase and NDEx repository. Please refer to the Methods section for a full description of the consensome algorithm.
Fig. 2
Fig. 2
High confidence transcriptional target (HCT) intersection analysis of viral infection and human receptors or signaling enzymes based on transcriptomic consensomes. Due to space constraints some class and family names may differ slightly from those in the SPP knowledgebase. All q-values refer to those obtained using the GeneOverlap analysis package in R. Full numerical data are provided in figshare File F1, section 6; see also Table 1 for links to virus-node family HCT intersection networks in the NDEx repository.
Fig. 3
Fig. 3
High confidence transcriptional target (HCT) intersection analysis of viral infection and human transcription factors based on ChIP-Seq consensomes. White cells represent q > 5e-2 intersections. Due to space constraints some class and family names may differ slightly from those in the SPP knowledgebase. All q-values refer to those obtained using the GeneOverlap analysis package in R. Full numerical data are provided in figshare File F1, section 7; see also Table 1 for links to virus-node HCT intersection networks in the NDEx repository.
Fig. 4
Fig. 4
High confidence transcriptional target (HCT) intersection analysis of viral infection and human signaling enzymes based on ChIP-Seq consensomes. White cells represent non-significant (q > 5e-2) intersections. Due to space constraints some class and family names may differ slightly from those in the SPP knowledgebase. All q-values refer to those obtained using the GeneOverlap analysis package in R. Full numerical data are provided in figshare File F1, section 7; see also Table 1 for links to virus-node HCT intersection networks in the NDEx repository.
Fig. 5
Fig. 5
Hypothesis generation use case 1: strain- and tissue-specific regulation of ACE2 in response to CoV infection of human cells. All data points are p < 0.05. Refer to figshare File F1, section 1 for full details on the underlying datasets. Abbreviations: CV, cardiovascular; GI, gastrointestinal; KI, kidney; OT, others.
Fig. 6
Fig. 6
Hypothesis generation use case 2: antagonism between PGR and SARS2 inflammatory signaling in the regulation of viral response genes in the airway epithelium. GMFC: geometric mean fold change. PGR loss of function (LOF) experiments were retrieved from the SPP knowledgebase.
Fig. 7
Fig. 7
Hypothesis generation use case 3: evidence for a SARS2 infection-associated EMT transcriptional signature. (a) CoV HCT intersection (INT) with the literature-curated EMT signature for all-biosample and lung epithelium-specific consensomes. The IAV consensome is comprised of lung epithelial cell lines and was therefore omitted from the lung epithelium-only consensome analysis. Refer to the column “EMT” in figshare File F1, section 3 for the list of EMT SARS2 HCTs. q-values refer to those obtained using the GeneOverlap analysis package in R. (b) Comparison of mean percentile ranking of the EMT-associated SARS2 HCTs across viral consensomes. Note that SARS2 HCTs are all in the 97–99th percentile and are therefore superimposed in the scatterplot. Indicated are the results of the two-tailed two sample t-test assuming equal variance comparing the percentile rankings of the SARS2 EMT HCTs across the four viral consensomes.
Fig. 8
Fig. 8
Hypothesis generation use case 4: efficient SARS2 repression of E2F family HCTs encoding key cell cycle regulators. (a) Relative abundance of E2F HCT cell cycle regulators in response to SARS2 infection. (b) Comparison of SARS2, SARS1, MERS and IAV consensome percentiles of the E2F HCT cell cycle regulators. Indicated are the results of the two-tailed two sample t-test assuming equal variance comparing the percentile rankings of the SARS2 EMT HCTs across the four viral consensomes.
Fig. 9
Fig. 9
Mining of CoV consensomes and underlying data points in the SPP knowledgebase. (A) The Ominer query form can be configured as shown to access the CoV infection consensomes. In the example shown, the user wishes to view the SARS2 consensome. (B) Consensomes are displayed in a tabular format. Target transcript symbols in the consensomes link to SPP transcriptomic Regulation Reports (C) Regulation Reports for consensome transcripts are filtered to show only data points that contributed to their consensome ranking. Clicking on a data point opens a Fold Change Information window that links to the SPP curated version of the original archived dataset (D). Like all SPP datasets, CoV infection datasets are comprehensively aligned with FAIR data best practice and feature human-readable names and descriptions, a DOI, one-click addition to citation managers, and machine-readable downloadable data files. For a walk-through of CoV consensome data mining options in SPP, please refer to the accompanying YouTube video (http://tiny.cc/2i56rz).
Fig. 10
Fig. 10
Visualization of viral consensomes and HCT intersection networks in the NDEx repository. In all panels, transcripts (consensome networks; panels a–c) and nodes (HCT intersection network; panel d) are color-coded according to their category as follows: receptors (orange), enzymes (blue), transcription factors (green), ion channels (mustard) and co-nodes (grey). Additional contextual information is available in the description of each network on the NDEx site. Red arrows are explained in the text. (a) Sample view of SARS2 consensome showing top 5% of transcripts. White rectangles represent classes to which transcripts have been mapped in the SPP biocuration pipeline. Orange inset refers to the zoomed-in view in panel (b). The IL6 transcript is highlighted to show the contextual information available in the info table to the right. (c) Top 20 ranked transcripts in the SARS2 consensome. Edge thickness is proportional to the GMFC. (d) Selected classes represented in the top 5% of nodes in the SARS2 ChIP-Seq HCT intersection network. Node circle size is inversely proportional to the intersection q-value.

Update of

Similar articles

Cited by

References

    1. Takeda K, Kaisho T, Akira S. Toll-like receptors. Annu. Rev. Immunol. 2003;21:335–376. doi: 10.1146/annurev.immunol.21.120601.141126. - DOI - PubMed
    1. Stark GR, Kerr IM, Williams BR, Silverman RH, Schreiber RD. How cells respond to interferons. Annu. Rev. Biochem. 1998;67:227–64. doi: 10.1146/annurev.biochem.67.1.227. - DOI - PubMed
    1. Darnell JE, Kerr IM, Stark GR. Jak-STAT pathways and transcriptional activation in response to IFNs and other extracellular signaling proteins. Science. 1994;264:1415–1421. doi: 10.1126/science.8197455. - DOI - PubMed
    1. DeDiego ML, et al. Severe acute respiratory syndrome coronavirus envelope protein regulates cell stress response and apoptosis. Plos Pathog. 2011;7:e1002315. doi: 10.1371/journal.ppat.1002315. - DOI - PMC - PubMed
    1. Josset L, et al. Cell host response to infection with novel human coronavirus EMC predicts potential antivirals and important differences with SARS coronavirus. MBio. 2013;4:e00165–13. doi: 10.1128/mBio.00165-13. - DOI - PMC - PubMed

Publication types

Substances