. 2020 Sep 22;11(1):4781.
doi: 10.1038/s41467-020-18602-6.

Impacts of solar intermittency on future photovoltaic reliability

Affiliations

Impacts of solar intermittency on future photovoltaic reliability

Jun Yin et al. Nat Commun. .

Abstract

As photovoltaic power is expanding rapidly worldwide, it is imperative to assess its promise under future climate scenarios. While a great deal of research has been devoted to trends in mean solar radiation, less attention has been paid to its intermittent character, a key challenge when compounded with uncertainties related to climate variability. Using both satellite data and climate model outputs, we characterize solar radiation intermittency to assess future photovoltaic reliability. We find that the relation between the future power supply and long-term mean solar radiation trends is spatially heterogeneous, showing power reliability is more sensitive to the fluctuations of mean solar radiation in hot arid regions. Our results highlight how reliability analysis must account simultaneously for the mean and intermittency of solar inputs when assessing the impacts of climate change on photovoltaics.


Conflict of interest statement

The authors declare no competing interests.

Figures

Fig. 1
Fig. 1. Examples of climate impacts on solar radiation and photovoltaic power reliability.
The distribution of clearness index (K) derived from the CERES data in (a, c) January and (b, d) July during 2001–2009 (blue lines) and during 2010–2018 (red lines) in (a, b) Southern Romania and (c, d) Dubai. The hatched areas indicate the probability when power generation does not meet the demand, the loss-of-load probability (LOLP). The averages of clearness index are marked by the vertical dash lines and the values are reported in Supplementary Table 1. Source data are provided as a Source Data file.
Fig. 2
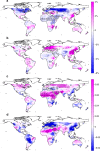
Fig. 2. Variations of solar radiation and solar power reliability predicted from climate models.
The color at each grid point represents the ensemble means of (a, b) the relative change of mean clearness index (Δμ/μ) and (c, d) the change of loss-of-load probability (ΔLOLP) between 2006–2015 and 2041–2050 in the month of (a, c) January and (b, d) July from 11 climate model outputs. The LOLP during 2006–2015 (i.e., design LOLP) is set as 0.3; maps with other design LOLP show similar patterns (see Supplementary Figs. 2 and 3). The dots show the ensemble mean of the corresponding variables are statistically different than zero, suggesting consistent variations of solar radiation or reliability from most climate models (t-test, 5% significance level; statistics of the sign of the changes are given in Supplementary Figs. 4–6). Source data are provided as a Source Data file.
Fig. 3
Fig. 3. Statistics of the clearness index.
a Probability density functions (pdf) of daily clearness index (K) in different regions over the world (binning width of 0.05) from the satellite data in January during 2001–2009 (dark color) and during 2010–2018 (light color). b Relationship between mean (μ) and standard deviation (σ) of daily K. The black/blue/red dots correspond to the lines in the a; the grey dots are from 11 climate model outputs during 2006–2015; the dash green curve shows the best quadratic fit. c / calculated as the derivative of the corresponding σ ~ μ relationship in (b). Source data are provided as a Source Data file.
Fig. 4
Fig. 4. Sensitivity of loss-of-load probability (Ls).
Contour plots of Ls is calculated (a) analytically from Eq. (2) and (b) numerically from climate model outputs. The red and blue dots in (b) are corresponding to the examples in (d), which compares the change of loss-of-load probability (LOLP) and the change of mean clearness index (μ) from 2006–2015 to 2041–2050 in January with design LOLP of 0.3 in regions where 0.3 < μ < 0.35 (red dots) and 0.65 < μ < 0.7 (blue dots) as projected by climate models. The red and blue lines are the corresponding best fit lines and their slopes (i.e., ΔLOLP / (Δμ/μ)) numerically represent Ls. (c) As in (d) but only for Bulgaria, Cyprus, Greece, Hungary, and Romania (i.e., region 7 defined in ref. ) in January (red dots) and July (blue dots). The red and blue circles correspond to the example of Southern Romania in Fig. 1. Source data are provided as a Source Data file.
Fig. 5
Fig. 5. Global maps of LOLP sensitivity (Ls).
This sensitivity in (a) January and (b) July is obtained from analytical solutions with design LOLP of 0.3 and solar radiation climatology from CERES. Source data are provided as a Source Data file.

References

    1. Fripp M. Switch: a planning tool for power systems with large shares of intermittent renewable energy. Environ. Sci. Technol. 2012;46:6371–6378. - PubMed
    1. He G, et al. SWITCH-China: a systems approach to decarbonizing China’s power system. Environ. Sci. Technol. 2016;50:5467–5473. - PubMed
    1. Perez R, et al. Achieving very high PV penetration—the need for an effective electricity remuneration framework and a central role for grid operators. Energy Policy. 2016;96:27–35.
    1. Northwest China Energy Regulatory. Regulation for grid-connected power plants in Northwest regions. http://xbj.nea.gov.cn/website/Aastatic/news-196276.html (2018).
    1. Ying, L. Northwest photovolatic power plants received $0.27 billion ticket for the first half year of 2019. CNGOLDhttps://energy.cngold.org/c/2019-09-19/c6584966.html (2019).