. 2020 Sep 22;10(1):15443.
doi: 10.1038/s41598-020-72076-6.

Mechanistic study of attenuation of monosodium glutamate mixed high lipid diet induced systemic damage in rats by Coccinia grandis

Affiliations

Mechanistic study of attenuation of monosodium glutamate mixed high lipid diet induced systemic damage in rats by Coccinia grandis

Arnab Banerjee et al. Sci Rep. .

Abstract

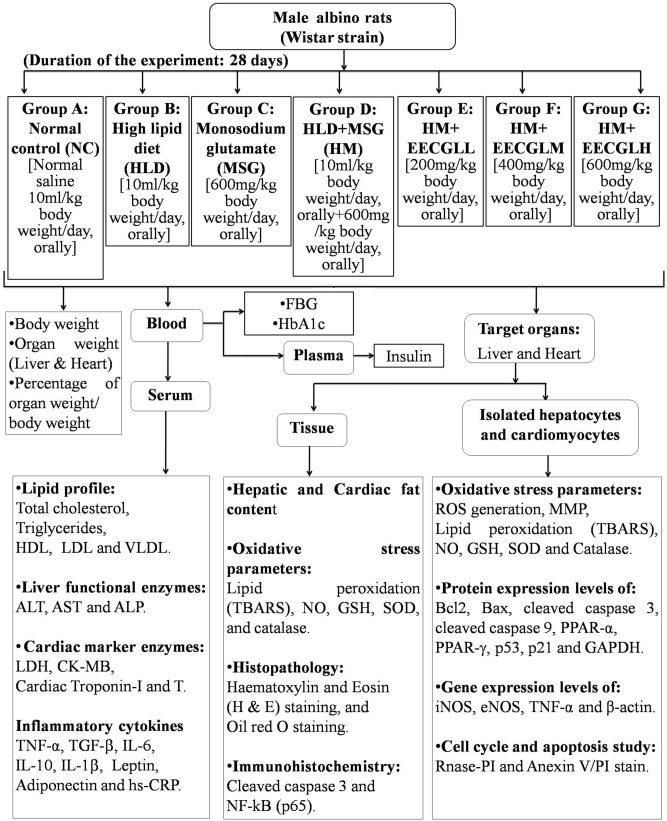
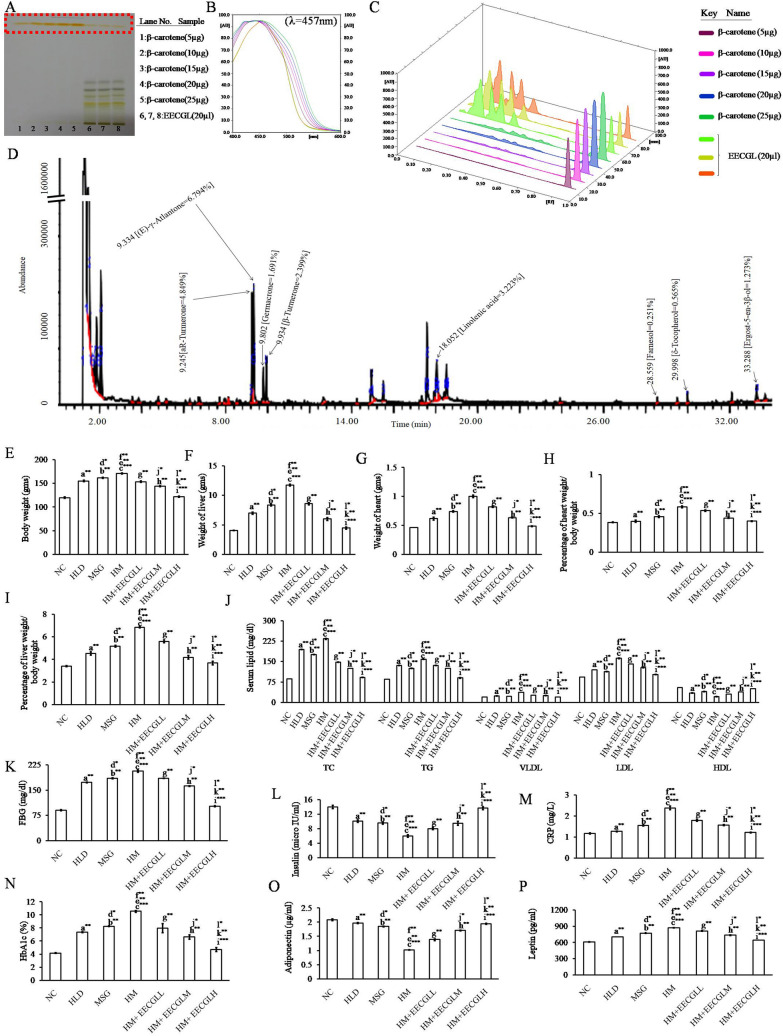
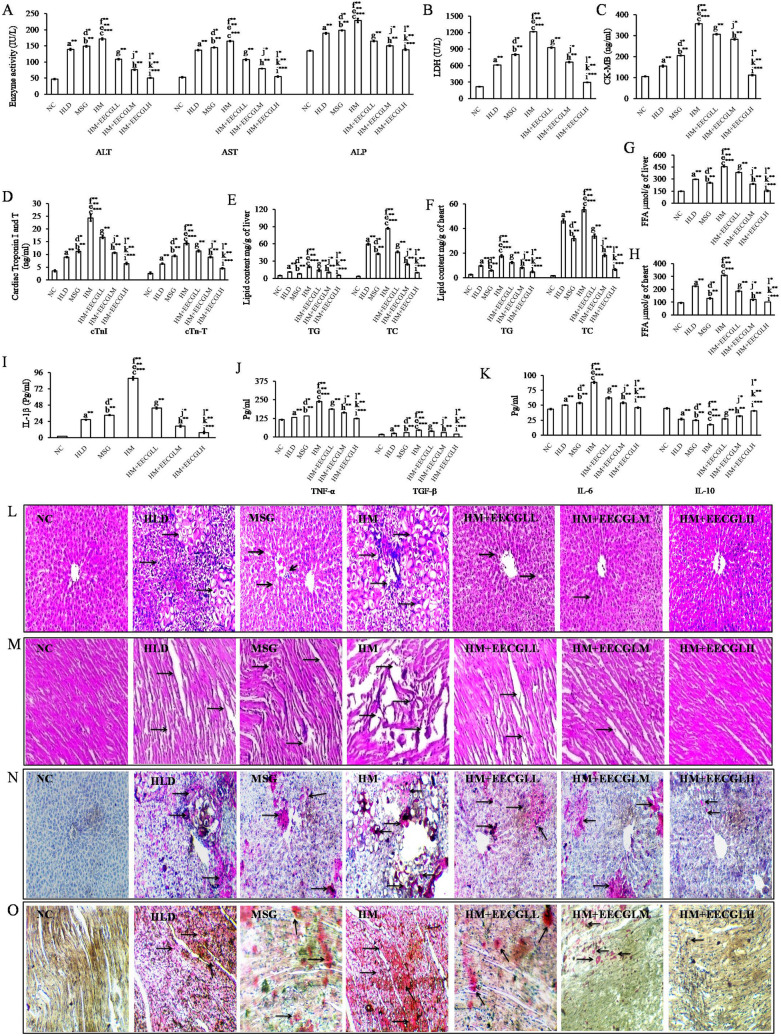
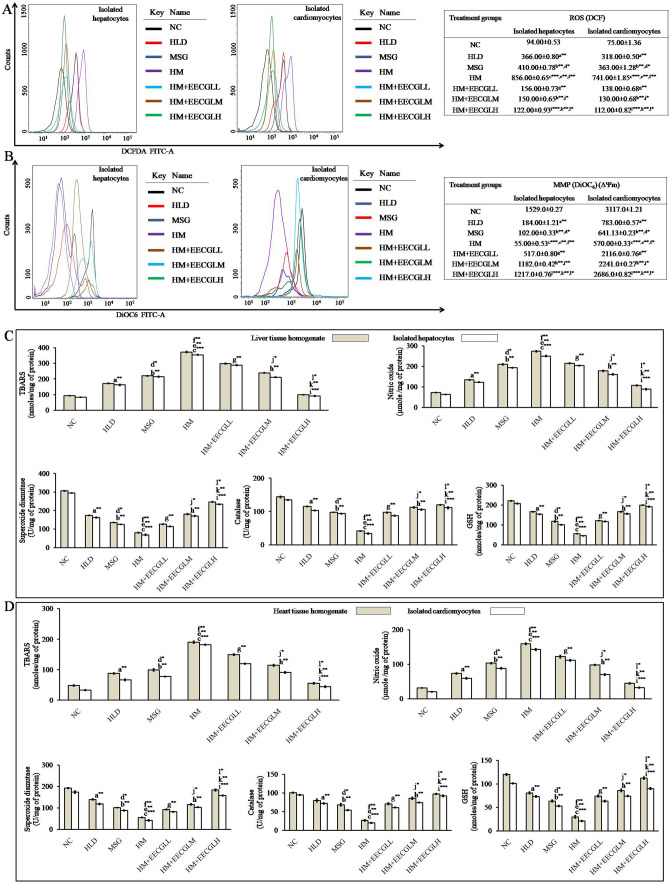
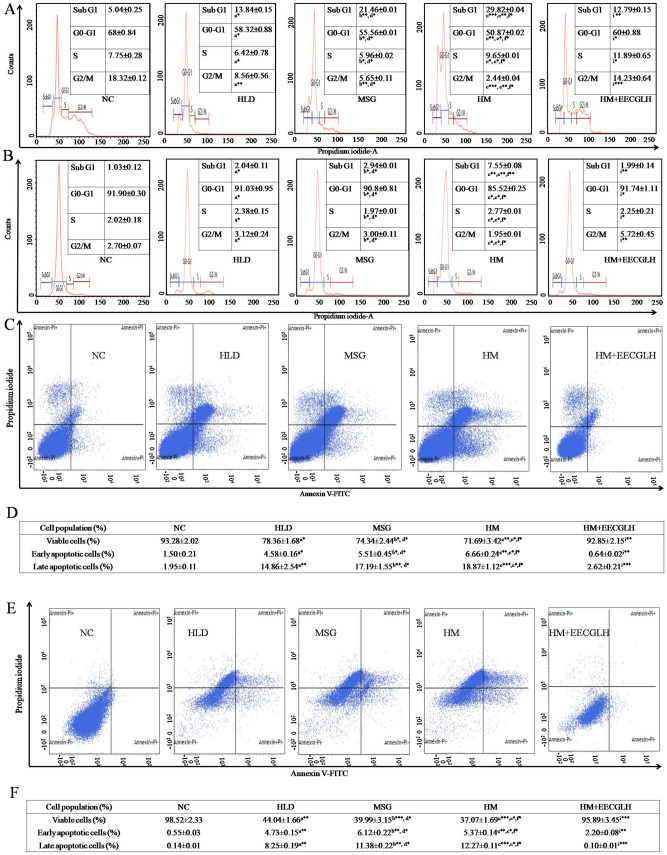
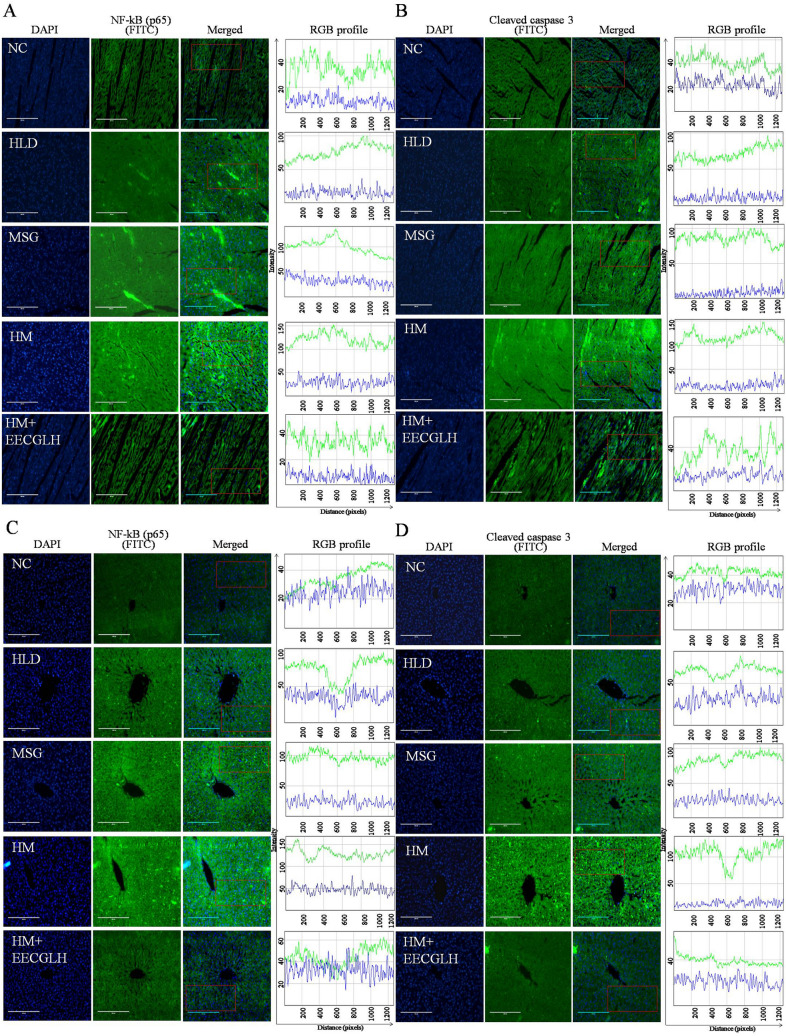
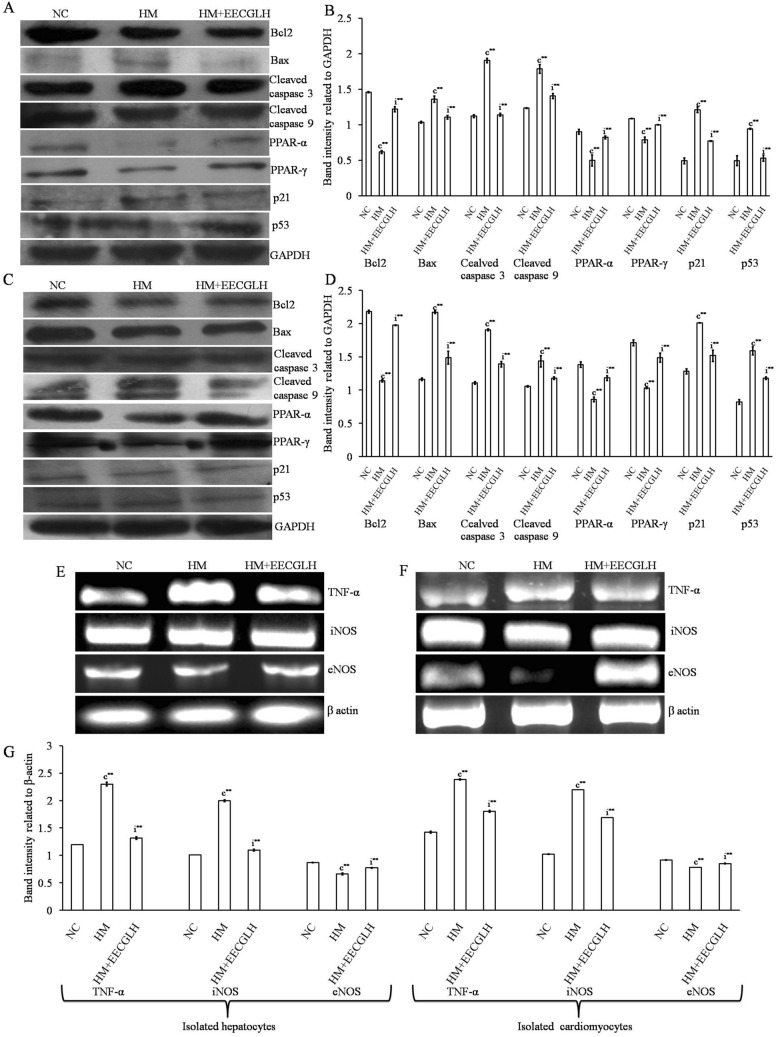
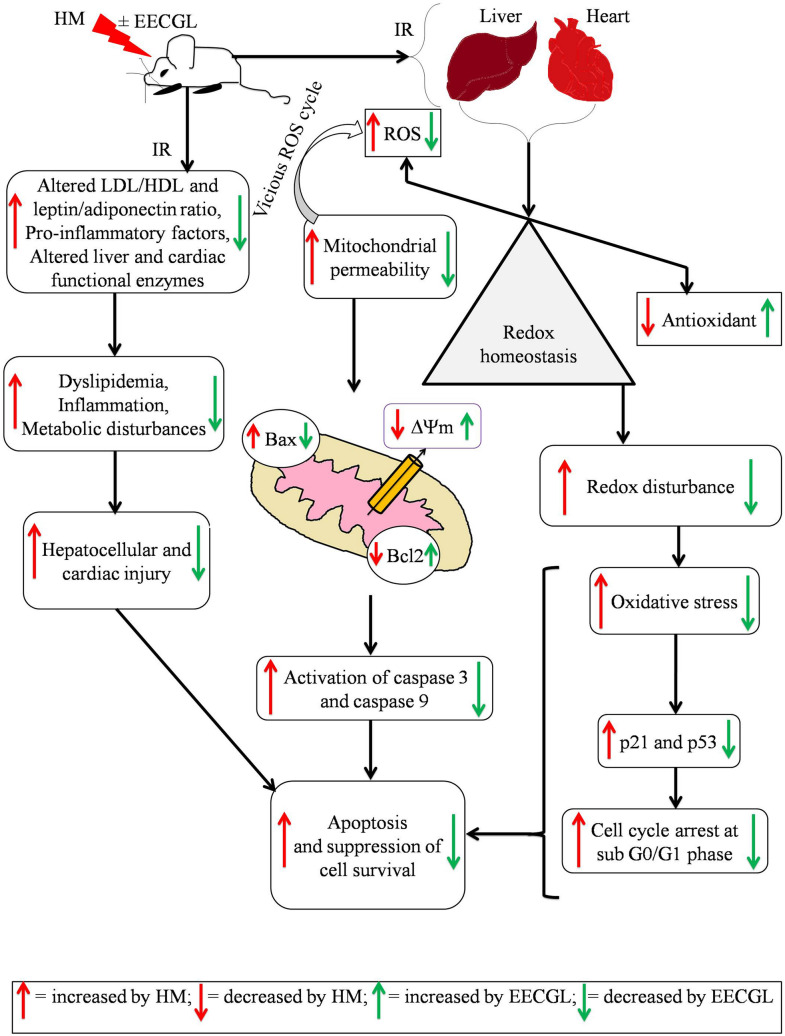
In the context of failure of treatment for non alcoholic fatty liver disease (NAFLD)-mediated systemic damages, recognition of novel and successful characteristic drug to combat these anomalous situations is earnestly required. The present study is aimed to evaluate protective value of ethanol extract of Coccinia grandis leaves (EECGL), naturally occurring medicinal plant, on NAFLD-mediated systemic damage induced by high lipid diet along with monosodium glutamate (HM)-fed rats. Our study uncovered that EECGL significantly ameliorates HM-induced hyperlipidemia, increased lipogenesis and metabolic disturbances (via up regulation of PPAR-α and PPAR-γ), oxidative stress (via reducing the generation of reactive oxygen species and regulating the redox-homeostasis) and inflammatory response (via regulating the pro-inflammatory and anti-inflammatory factors with concomitant down regulation of NF-kB, iNOS, TNF-α and up regulation of eNOS). Furthermore, EECGL significantly inhibited HM-induced increased population of cells in sub G0/G1 phase, decreased Bcl2 expression and thereby loss of mitochondrial membrane potential with over expression of Bax, p53, p21, activation of caspase 3 and 9 indicated the apoptosis and suppression of cell survival. It is perhaps the first comprehensive study with a mechanistic approach which provides a strong unique strategy for the management of HM-induced systemic damage with effective dose of EECGL.


Conflict of interest statement

The authors declare no competing interests.

Figures

Figure 1
Figure 1
Experimental design. The plan of the experiment was represented by the schematic diagram. Experimental period of the force feeding of HLD, MSG, HM were 28 days with supplementation of EECGLs and a control group (NC). The different experimental parameters were measured after the completion of the experimental period (on or after 29th day).
Figure 2
Figure 2
Chromatographic identification of compound(s) present in the EECGL and effect of EECGL on HM induced altered body weight, organ weight, serum lipid, glucose levels and insulin resistance in rats. (A) HPTLC fingerprint showed prominent band of β-carotene (from lane 6–8 marked by red colour) of EECGL with standard β-carotene (from lane 1–5, marked by red colour with increasing concentration of the standard). (B) Overlay spectra of the EECGL with five increasing concentration of β-carotene as a standard. (C) Densitogram represented five increasing concentration of β-carotene as a standard (β-carotene peak marked by plum, lilac, purple, dark blue, forest green colour) with that of the extracts obtained from EECGL (β-carotene peak marked by lime, olive, orange colour). (D) GCMS analysis and components present in the EECGL with their retention time (left side of respective compound) and total percentage (right side respective compound). Rats were feed with HLD, MSG, HM and HM + three increasing concentration of EECGL for 28 days with regular observation of body weight and after 28 days (E) average body weight, (F) liver weight, (G) heart weight were measured and (H) percentage of heart weight/body weight, (I) percentage of liver weight/body weight were calculated. The Bar diagram represented the (J) serum lipid levels, (K) FBG, (L) insulin, (M) CRP, (N) HbA1c, (O) adiponectin and (P) leptin of the control, treatment variables and the supplements. Statistical comparison by Kruskal–Wallis nonparametric ANOVA test [P < 0.05]. Significance level based on Mann–Whitney U multiple comparison test: a-NC vs. HLD, b-NC vs. MSG, c-NC vs. HM, d-HLD vs. MSG, e-HLD vs. HM, f-MSG vs. HM, g-HM vs. HM + EECGLL, h-HM vs. HM + EECGLM, i-HM vs. HM + EECGLH, j-HM + EECGLL vs. HM + EECGLM, k-HM + EECGLL vs. HM + EECGLH, l-HM + EECGLM vs. HM + EECGLH [*P < 0.05, **P < 0.01, ***P < 0.001].
Figure 3
Figure 3
Effects of EECGL on hepatic and cardiac marker enzymes, lipid contents, serum inflammatory factors and tissue architecture. (A) hepatic marker enzymes, (B) LDH, (C) CK-MB, (D) cardiac troponin I and T, (E) hepatic lipid content, (F) cardiac lipid content, (G) hepatic FFA, (H) cardiac FFA, (I) IL-1β, (J) TNF-α and TGF-β, (K) IL-6 and IL-10. The liver and heart pathologies in the different groups of HLD, MSG, HM and HM + EECGL fed rats were observed. Bright field microscopy images of liver, heart tissue by (L,M) Hematoxylin and eosin (HE) staining (20 ×) and (N,O) Oil Red O staining (20 ×). Significance level based on Mann–Whitney U multiple comparison test: a-NC vs. HLD, b-NC vs. MSG, c-NC vs. HM, d-HLD vs. MSG, e-HLD vs. HM, f-MSG vs. HM, g-HM vs. HM + EECGLL, h-HM vs. HM + EECGLM, i-HM vs. HM + EECGLH, j-HM + EECGLL vs. HM + EECGLM, k-HM + EECGLL vs. HM + EECGLH, l-HM + EECGLM vs. HM + EECGLH [*P < 0.05, **P < 0.01, ***P < 0.001].
Figure 4
Figure 4
Effects of EECGL on hepatic and cardiac oxidative stress and mitochondrial membrane potential. (A) Overlaid histogram plot of ROS generation in control, HLD, MSG, HM and HM + EECGL treated group. The movement of histogram towards right indicated the higher ROS generation. DCF intensity was taken along the X axis and cell count was taken along the Y-axis. Different colours of histogram represented the ROS generation in different experimental groups. On the right side of the overlay the table represented the data mean fluorescence intensity of DCF. (B) Overlaid histogram plot of MMP in control, HLD, MSG, HM and HM + EECGL treated group. The movement of histogram towards left indicated the loss MMP. DiOC6 intensity was taken along the X axis and cell count was taken along the Y-axis. Different colours of histogram represented the MMP in different experimental groups. On the right side of the overlay the table represented the data mean fluorescence intensity of DiOC6. (C) Bar diagram represented the TBARS, NO, SOD, CAT, GSH level in control, HLD, MSG, HM and HM + EECGL treated groups from liver tissue homogenate and isolated hepatocytes, respectively. (D) Bar diagram represented the TBARS, NO, SOD, CAT, GSH level in control, HLD, MSG, HM and HM + EECGL treated groups from heart tissue homogenate and isolated cardiomyocytes, respectively. Significance level based on Mann–Whitney U multiple comparison test: a-NC vs. HLD, b-NC vs. MSG, c-NC vs. HM, d-HLD vs. MSG, e-HLD vs. HM, f-MSG vs. HM, g-HM vs. HM + EECGLL, h-HM vs. HM + EECGLM, i-HM vs. HM + EECGLH, j-HM + EECGLL vs. HM + EECGLM, k-HM + EECGLL vs. HM + EECGLH, l-HM + EECGLM vs. HM + EECGLH [*P < 0.05, **P < 0.01, ***P < 0.001].
Figure 5
Figure 5
Determination of cell cycle progression by RNase PI and apoptosis by Annexin-FITC and PI. On the basis of size (FSC-H) and granularity (SSC-H) selected singlet population of (A) hepatocytes and (B) cardiomyocytes population was plotted. Graphs represented the distribution of cells in different phases of cell cycle. The first peak in all graphs represented the subG1 population, second peak represented the G0–G1 and third peak represented the G2/M population. The valley between these G0–G1 and G2/M peaks represented the S phase population. Percentage (%) of cells in different phases of cell cycle was represented in the respective figures. After completion of the experiment (C) hepatocytes and (E) cardiomyocytes from NC, HLD, MSG, HM and HM + EECGLH groups were stained by Annexin-FITC and PI. The Q1 quadrant represented the viable cell populations which was the maximum in NC group. Q2 quadrant represented the early apoptotic cell populations with FITC stain. The Q3 quadrant represented the late apoptotic cell population (dual stain positive cells). Intensity of FITC in FL1-H (FITC) channel was taken along the X-axis and FL2-H channel (PI) was taken along the Y-axis. Table represented the viable, early apoptotic and late apoptotic cell populations in control, HLD, MSG, HM and HM + EECGLH treated groups of the (D) hepatocytes and (F) cardiomyocytes. Significance level based on Mann–Whitney U multiple comparison test: a-NC vs. HLD, b-NC vs. MSG, c-NC vs. HM, d-HLD vs. MSG, e-HLD vs. HM, f-MSG vs. HM, i-HM vs. HM + EECGLH [*P < 0.05, **P < 0.01, ***P < 0.001].
Figure 6
Figure 6
Nuclear translocation of nuclear factor kappa B (p65) and cleaved caspase 3 by immunohistochemistry of control, HLD, MSG, HM and HM + EECGLH treated groups of liver and heart tissue. Nuclear translocation of NF-kB (p65) of (A) heart tissue section and (C) liver tissue section were represented. Nuclear translocation of cleaved caspase 3 of (B) heart tissue section and (D) liver tissue section were represented. The nuclei were stained by DAPI which appeared blue and NF-kB (p65) or cleaved caspase 3 was stained by FITC tagged secondary antibody which appeared green. The merged images showed the infiltration of green colour into the blue region which indicated the nuclear translocation of NF-kB (p65) or cleaved caspase 3. NF-kB (p65) and cleaved caspase 3 positive nuclei were estimated from the selected region marked by red colour. The intensity of DAPI and FITC was plotted using ImageJ software (NIH Image J system, Bethesda, MD) for quantification of fluorescence intensity. The intensity (in arbitrary unit) was taken along the Y-axis and distance (in pixel) was plotted along the X-axis. For control, HLD, MSG, HM and HM + EECGLH groups the green line indicated the intensity of FITC and blue line indicated the intensity of DAPI.
Figure 7
Figure 7
Protein expression in hepatocytes and cardiomyocytes in control, HM and HM + EECGLH group. Effects of EECGLH on HM induced alerted protein expressions of (A,B) hepatocytes and (C,D) cardiomyocytes with control groups with densitometric analysis some cell cycle regulator protein like p53 and p21, some transcription factors like PPAR-α and PPAR-γ, apoptosis related protein Bcl2, Bax, cleaved caspase 3 and 9 with an endogenous control GAPDH were represented. Gene expression in hepatocytes and cardiomyocytes in control, HM and HM + EECGLH group. Effects of EECGLH on HM induced alerted mRNA expression levels of (E) hepatocytes, (F) cardiomyocytes with control groups were represented and (G) bar diagram represented the densitometric analysis of TNF-α, iNOS, and eNOS with β-actin as endogenous control. Significance level based on Mann–Whitney U multiple comparison test: c-NC vs. HM, i-HM vs. HM + EECGLH [**P < 0.01].
Figure 8
Figure 8
Schematic diagram of the hypothesis of the target pathway by which EECGL play preventive roles against HM induced NAFLD mediated systemic damage. The diagram represented the hypothetical pathways involved in high lipid diet along with monosodium glutamate induced liver, heart damage and a possible ameliorative efficacy of ethanol extract of Coccinia grandis leaves with its active compounds.

Similar articles

Cited by

References

    1. Banerjee A, et al. Altered composition of high-lipid diet may generate reactive oxygen species by disturbing the balance of antioxidant and free radicals. J. Basic Clin. Physiol. Pharmacol. 2020;31:15–20. doi: 10.1515/jbcpp-2019-0141. - DOI - PubMed
    1. Ratziu V, Bellentani S, Cortez-Pinto H, Day C, Marchesini G. A position statement on NAFLD/NASH based on the EASL 2009 special conference. J. Hepatol. 2010;53:372–384. doi: 10.1016/j.jhep.2010.04.008. - DOI - PubMed
    1. Angulo P. Nonalcoholic fatty liver disease. N. Engl. J. Med. 2002;346:1221–1231. doi: 10.1056/NEJMra011775. - DOI - PubMed
    1. Singh K, Ahluwalia P. Effect of monosodium glutamate on lipid peroxidation and certain antioxidant enzymes in cardiac tissue of alcoholic adult male mice. J. Cardiovasc. Dis. Res. 2012;3:12–18. doi: 10.4103/0975-3583.91595. - DOI - PMC - PubMed
    1. Fang YL, Chen H, Wang CL, Liang L. Pathogenesis of non-alcoholic fatty liver disease in children and adolescence: from "two hit theory" to "multiple hit model". World J. Gastroenterol. 2018;24:2974–2983. doi: 10.3748/wjg.v24.i27.2974. - DOI - PMC - PubMed

Publication types

MeSH terms