. 2020 Sep 22;10(1):15472.
doi: 10.1038/s41598-020-71906-x.

Regulation of degenerative spheroids after injury

Affiliations

Regulation of degenerative spheroids after injury

Yu Yong et al. Sci Rep. .

Abstract

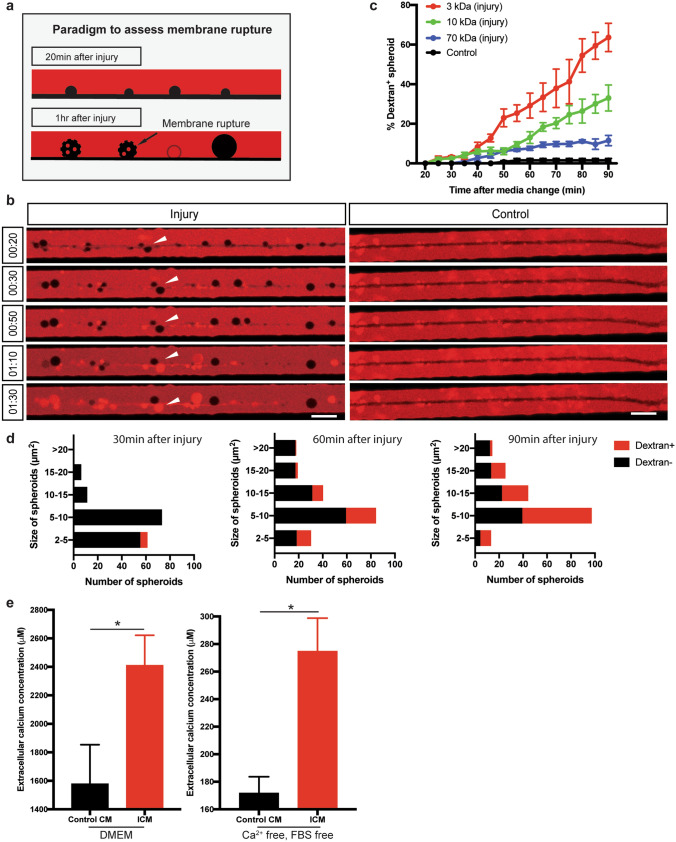
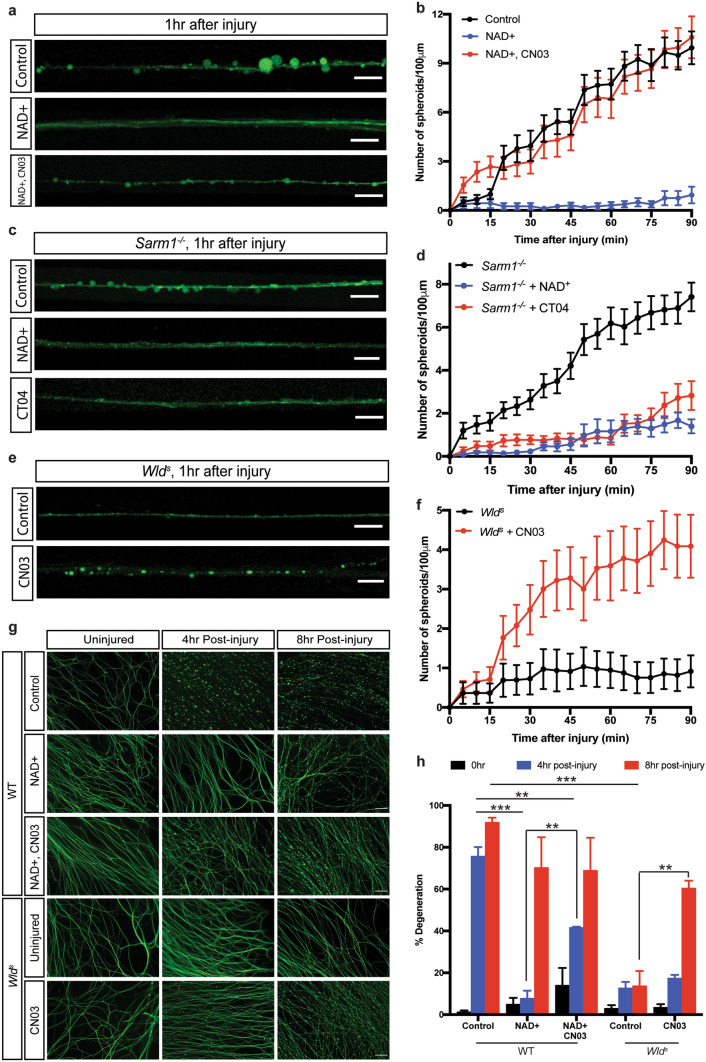
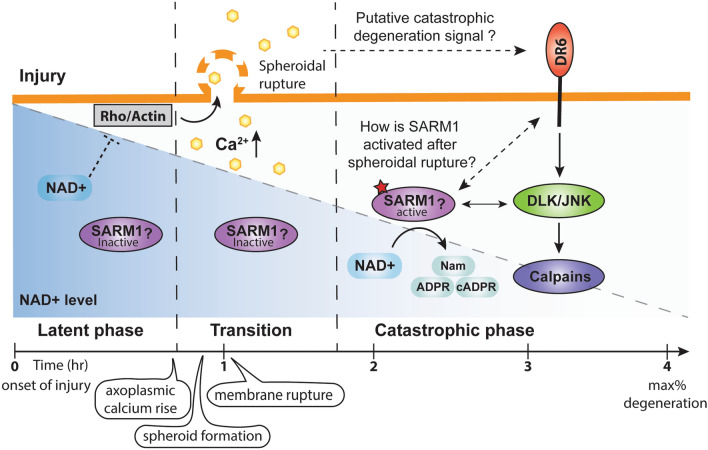
Neuronal injury leads to rapid, programmed disintegration of axons distal to the site of lesion. Much like other forms of axon degeneration (e.g. developmental pruning, toxic insult from neurodegenerative disorder), Wallerian degeneration associated with injury is preceded by spheroid formation along axons. The mechanisms by which injury leads to formation of spheroids and whether these spheroids have a functional role in degeneration remain elusive. Here, using neonatal mouse primary sympathetic neurons, we investigate the roles of players previously implicated in the progression of Wallerian degeneration in injury-induced spheroid formation. We find that intra-axonal calcium flux is accompanied by actin-Rho dependent growth of calcium rich axonal spheroids that eventually rupture, releasing material to the extracellular space prior to catastrophic axon degeneration. Importantly, after injury, Sarm1-/- and DR6-/-, but not Wlds (excess NAD+) neurons, are capable of forming spheroids that eventually rupture, releasing their contents to the extracellular space to promote degeneration. Supplementation of exogenous NAD+ or expressing WLDs suppresses Rho-dependent spheroid formation and degeneration in response to injury. Moreover, injured or trophically deprived Sarm1-/- and DR6-/-, but not Wlds neurons, are resistant to degeneration induced by conditioned media collected from wild-type axons after spheroid rupture. Taken together, these findings place Rho-actin and NAD+ upstream of spheroid formation and may suggest that other mediators of degeneration, such as DR6 and SARM1, mediate post-spheroid rupture events that lead to catastrophic axon disassembly.


Conflict of interest statement

The authors declare no competing interests.

Figures

Figure 1
Figure 1
Axoplasmic calcium dynamics and formation of spheroids prior to catastrophic degeneration in response to injury. (a) Schematic representation of injury paradigm in microfluidic devices. Cell bodies (CB) and distal axons (DA) are seperated. All the cultures were maintained in the presence of 45 ng/mL NGF. For the “injury” condition, neurons were enucleated by aspiration in PBS. (b) Representative images of β3-tubulin immuno-stained distal sympathetic axons before treatment (0 h), 2, 4 and 6 h after injury. Scale bar = 50 µm. (c) Degeneration time course after injury. Catastrophic phase and maximum of degeneration are noted. Nonlinear regression curve was drawn according to the Hill equation. n = 3 for each time point. (d) Fluo4-AM calcium imaging of sympathetic axons at the indicated times after injury. For the “injury” condition, neurons were enucleated by aspiration in PBS and then incubated with Fluo4-AM for calcium imaging. For the “Control” condition, no injury was performed. Red box indicates the individual axon as a region of interest. Yellow box indicates axonal spheroid as a region of interest. White arrowheads indicate the formation and growth of spheroid. Scale bar = 10 µm. (e) Calcium fluorescence change of control or injured axons over time. Total number of n = 76 (injury) and n = 30 (control) of axons from 3 independent litters were quantified. (f) Quantification of axonal spheroid number per 100 µm of axon at the indicated times after injury. Total number of n = 47 axons from 3 independent litters were counted. (g) Calcium fluorescence and size change of axonal spheroid at the indicated times after injury. Total number of n = 14 axonal spheroids from 3 independent litters were quantified. (h) Quantification of normalized calcium fluorescence of axonal spheroids from 20 to 90 min after injury. Individual axonal spheroids were quantified: n = 14 spheroids from 3 independent replicates. Data are reported as mean ± SEM, *p < 0.05; ***p < 0.0001, two-way ANOVA with Sidak’s multiparisons test.
Figure 2
Figure 2
Rho activation and actin remodeling are required for axonal spheroid formation in response to injury. (a) Representative axons/spheroids visualized for bright field, Phalloidin and β3-tubulin (Tuj1) 1 h after injury. Scale bar = 5 μm. Percentages of Phalloidin positive and Tuj1 positive spheroids were quantified next to the images, respectively. Total number of n = 10 axons were quantified. (b) Fluo4-AM calcium imaging of wild-type sympathetic axons with or without drug treatment. For the “CT04” group, wild-type axons were incubated in SCG media containing 1 µg/mL Rho inhibitor CT04, for 2 h prior to injury. For the “Cytochalasin D” group, wild-type axons were incubated in SCG media containing 10 µg/mL actin polymerization inhibitor for 2 h prior to injury. Scale bar = 10 µm. (c) Quantification of axonal spheroid number per 100 µm of wild-type sympathetic axons at the indicated times after injury in the absence and presence of CT04 or Cytochalasin D. Total number of n = 50 (control), n = 28 (cytochalasin D), n = 32 (CT04) axons from cultured neurons harvested from 3 independent litters were quantified. (d) Representative images and (e) quantification of degeneration of wild-type distal sympathetic axons immuno-stained for β3-tubulin in the absence and presence of CT04 or Cytochalasin D. Scale bar = 50 µm. Compared to Control, 4 h post-injury (n = 4), p < 0.0001, n = 6 for Cytochalasin D, 4 h post-injury; p < 0.0001, n = 5 for CT04, 4 h post-injury, two-way ANOVA with Dunnett’s multiple comparisons test. Data are reported as mean ± SEM, *p < 0.05; ***p < 0.0001.
Figure 3
Figure 3
Axonal spheroids develop membrane rupture after injury. (a) Schematic representation of the experimental paradigm to assess membrane rupture model using fluorescent dextran. 20 min after injury, fluorescent dextran (red) is not taken up by the axon (black, negative space). However, by 1 h after injury, as the plasma membrane loses integrity and ruptures, fluorescent dextran (red) can diffuse into spheroids, turning them red. Spheroids with intact membrane remain black. (b) Representative images of dextran 3 kDa (red) entry to axonal spheroids (black) from 20 to 90 min after injury (left column), and dextran exclusion in untreated axons (right column). White arrowheads indicate that dextran 3 kDa enter axonal spheroids 1 h after injury. Scale bar = 10 μm. (c) Quantification of the percentages of fluorescent 3 kDa (red), 10 kDa (green), and 70 kDa (blue) dextran positive spheroids 20–90 min after injury. Black line (control) indicates the percentages of fluorescent 3 kDa dextran positive spheroids without injury. Total number of n = 12 (3 kDa), n = 12 (10 kDa), n = 9 (70 kDa), and n = 27 (control) axons from 3 independent litters were counted. (d) Histogram of 3 kDa dextran negative (black) and positive (red) spheroids 30, 60, and 90 min after injury. (e) Measurements of extracellular calcium expelled from axons into regular SCG culture media (DMEM, left) and calcium free, FBS free media (right). In the “Control CM” group, media was collected from uninjured axons. In the “ICM” group, media was collected 1 h after injury. For DMEM groups, compared to Control CM (n = 4), p = 0.0414, n = 4 for ICM; For calcium free, FBS free groups, compared to Control CM (n = 3), p = 0.0185, n = 3 for ICM, unpaired t test. Data are reported as mean ± SEM, *p < 0.05; ***p < 0.0001.
Figure 4
Figure 4
DR6−/− and Sarm1−/− develop axonal spheroids and spheroidal rupture after injury, while Wlds does not. (a) Fluo4-AM calcium imaging of wild-type, Wlds, DR6−/−, and Sarm1−/− sympathetic axons 1 h after injury. Scale bar = 10 µm. (b) Quantification of numbers of axonal spheroids, (c) spheroidal calcium level, (d) interspheroidal calcium level, and (e) size change of axonal spheroids on the wild-type, Wlds, DR6−/−, and Sarm1−/− axons 1 h after injury, respectively. Total number of n = 29 (WT), n = 17 (Wlds), n = 57 for (DR6−/−), and n = 54 (Sarm1−/−) axons from 3 independent litters were counted. (f) Representative images of dextran 3 kDa (red) entry to axonal spheroids (black) on wild-type, Wlds, DR6−/−, and Sarm1−/− axons 1 h after injury. Scale bar = 10 µm. (g) Normalized numbers of 3 kDa dextran negative (black) and positive (red) axonal spheroids on wild-type, Wlds, DR6−/−, and Sarm1−/− axons 1 h after injury. Compared to WT, Dextran+, p < 0.0001, n = 21 for Wlds, Dextran+. Compared to WT, Dextran-, p < 0.0001, n = 22 for Wlds, Dextran-; p = 0.0003, n = 17 for Sarm1−/−, Dextran-, two-way ANOVA with Dunnett’s multiple comparisons test. (h) Measurement of extracellular calcium concentration in media surrounding injured and uninjured Wlds, DR6−/− and Sarm1−/− axons. All injured conditioned media was collected from distal axon chamber 1 h after injury. Compared to Control CM, p = 0.9982, n = 3 for Wlds, ICM; p = 0.1440, n = 6 for DR6−/−, ICM; p = 0.0141, n = 3 for Sarm1−/−, ICM, two-way ANOVA with Sidak’s multiple comparisons test. Data are reported as mean ± SEM, *p < 0.05; **p < 0.001; ***p < 0.0001.
Figure 5
Figure 5
NAD+ acts on upstream of Rho activation to suppresses spheroid formation after injury. (a) Fluo4-AM calcium imaging of wild-type sympathetic axons 1 h after injury with or without drug treatment. Scale bar = 10 µm. (b) Quantification of axonal spheroid number per 100 µm of wild-type sympathetic axons at the indicated times after injury in the absence and presence of NAD+ or CN03. Total number of n = 23 (Control), n = 13 (NAD+), n = 21 (NAD+, CN03) axons from cultured neurons harvested from 3 independent litters were quantified. (c) Fluo4-AM calcium imaging of Sarm1−/− sympathetic axons 1 h after injury with or without drug treatment. Scale bar = 10 µm. (d) Quantification of axonal spheroid number per 100 µm of Sarm1−/− sympathetic axons at the indicated times after injury in the absence and presence of NAD+ or CT04. Total number of n = 30 (Control), n = 16 (NAD+), n = 25 (CT04) Sarm1−/− axons from cultured neurons harvested from 3 independent litters were quantified. (e) Fluo4-AM calcium imaging of Wlds sympathetic axons 1 h after injury in the presence and absence of CN03. Scale bar = 10 µm. (f) Quantification of axonal spheroid number per 100 µm of Wlds sympathetic axons at the indicated times after injury in the absence and presence of CN03. Total number of n = 25 (Control), n = 24 (CN03) Wlds axons from cultured neurons harvested from 3 independent litters were quantified. (g) Representative images and (h) quantification of degeneration of wild-type and Wlds distal sympathetic axons immuno-stained for β3-tubulin with different treatments. Scale bar = 50 µm. For the “NAD+” group, axons were incubated in SCG media containing 1 mM NAD+ supplement overnight prior to injury. For the “CN03” and CT04″ groups, axons were incubated in SCG media containing 1 µg/mL Rho activator CN03 and Rho inhibitor CT04 for 2 h prior to injury, respectively. Data are reported as mean ± SEM, *p < 0.05; **p < 0.001; ***p < 0.0001, two-way ANOVA with Tukey’s multiple comparisons test.
Figure 6
Figure 6
DR6−/− and Sarm1−/− suppress ICM induced axon degeneration, while Wlds does not. (a) Wild-type and (d) mutant sympathetic neurons were globally deprived of NGF for 12 h followed by addition of conditioned media collected from distal axons for 5 h, respectively. (b) Representative images and (c) quantification of β3-tubulin immunostained trophic deprived distal sympathetic axons from wild-type animals after treatment with ICM and Control CM collected from DR6−/−, Sarm1−/− and Wlds neurons. Compared to Wlds, Control CM (n = 4), p = 0.9811, n = 5 for Wlds, ICM. Compared to DR6−/−, Control CM (n = 3), p < 0.0001, n = 5 for DR6−/−, ICM. Compared to Sarm1−/−, Control CM (n = 3), p < 0.0001, n = 5 for Sarm1−/−, ICM. (e) Representative images and (f) quantification of β3-tubulin immunostained trophic deprived distal sympathetic axons from DR6−/−, Sarm1−/− and Wlds animals after treatment with ICM and Control CM collected from wild-type neurons. Compared to Control CM, Wlds (n = 5), p < 0.0001, n = 5 for ICM, Wlds. Compared to Control CM, DR6−/− (n = 3), p = 0.8921, n = 4 for ICM, DR6−/−. Compared to Control CM, Sarm1−/− (n = 7), p = 0.9988, n = 6 for ICM, Sarm1−/−. (g) Mutant neurons were injured for 4 h in the presence of NGF followed by addition of conditioned media collected from wild-type axons for 4 h. (h) Representative images and (i) quantification of β3-tubulin immunostained injured distal sympathetic axons from DR6−/−, Sarm1−/− and Wlds animals after treatment with ICM and Control CM collected from wild-type neurons. Compared to Control CM, Wlds (n = 7), p < 0.0001, n = 11 for ICM, Wlds. Compared to Control CM, DR6−/− (n = 2), p = 0.9983, n = 4 for ICM, DR6−/−. Compared to Control CM, Sarm1−/− (n = 7), p = 0.9951, n = 8 for ICM, Sarm1−/−. In the “Control CM” group, media was collected from uninjured axons. In the “ICM” group, media was collected 4 h after injury. Data are reported as mean ± SEM, *p < 0.05; ***p < 0.0001. Significant difference is determined by two-way ANOVA with Sidak’s multiple comparison test. Scale bar = 50 µm.
Figure 7
Figure 7
Proposed model for events associated with injury induced axon degeneration of sympathetic neurons. After injury, axoplasmic calcium is increased and enriched in spheroids prior to catastrophic phase. Spheroid formation is regulated by Rho activity and actin remodeling, which is suppressed by NAD+. The calcium electrochemical gradient across membrane is disrupted by spheroidal rupture. We speculate that axonal NAD+ level decreases via SARM1 independent catalysis while SARM1 stays inactive prior to spheroidal rupture. DR6 and SARM1 can be activated to promote further NAD+ depletion and catastrophic degeneration. However, how DR6 and SARM1 get activated downstream of spheroid rupture remains unclear. The schematic representation of the model was drawn in Adobe Illustrator.

References

    1. Waller A. Experiments on the section of the glosso-pharyngeal and hypoglossal nerves of the frog, and observations of the alterations produced thereby in the structure of their primitive fibres. Edinb. Med. Surg. J. 1851;76:369–376. - PMC - PubMed
    1. Beirowski B, et al. The progressive nature of Wallerian degeneration in wild-type and slow Wallerian degeneration (WldS) nerves. BMC Neurosci. 2005;6:6. doi: 10.1186/1471-2202-6-6. - DOI - PMC - PubMed
    1. Wang JT, Medress ZA, Barres BA. Axon degeneration: molecular mechanisms of a self-destruction pathway. J. Cell Biol. 2012;196:7–18. doi: 10.1083/jcb.201108111. - DOI - PMC - PubMed
    1. Vargas ME, Yamagishi Y, Tessier-Lavigne M, Sagasti A. Live Imaging of calcium dynamics during axon degeneration reveals two functionally distinct phases of calcium Influx. J. Neurosci. 2015;35:15026–15038. doi: 10.1523/JNEUROSCI.2484-15.2015. - DOI - PMC - PubMed
    1. Avery MA, et al. WldS prevents axon degeneration through increased mitochondrial flux and enhanced mitochondrial Ca2+ buffering. Curr. Biol. 2012;22:596–600. doi: 10.1016/j.cub.2012.02.043. - DOI - PMC - PubMed

Publication types

MeSH terms