

Photoperiodic effects on monoamine signaling and gene expression throughout development in the serotonin and dopamine systems
- PMID: 32963273
- PMCID: PMC7508939
- DOI: 10.1038/s41598-020-72263-5
Photoperiodic effects on monoamine signaling and gene expression throughout development in the serotonin and dopamine systems
Abstract
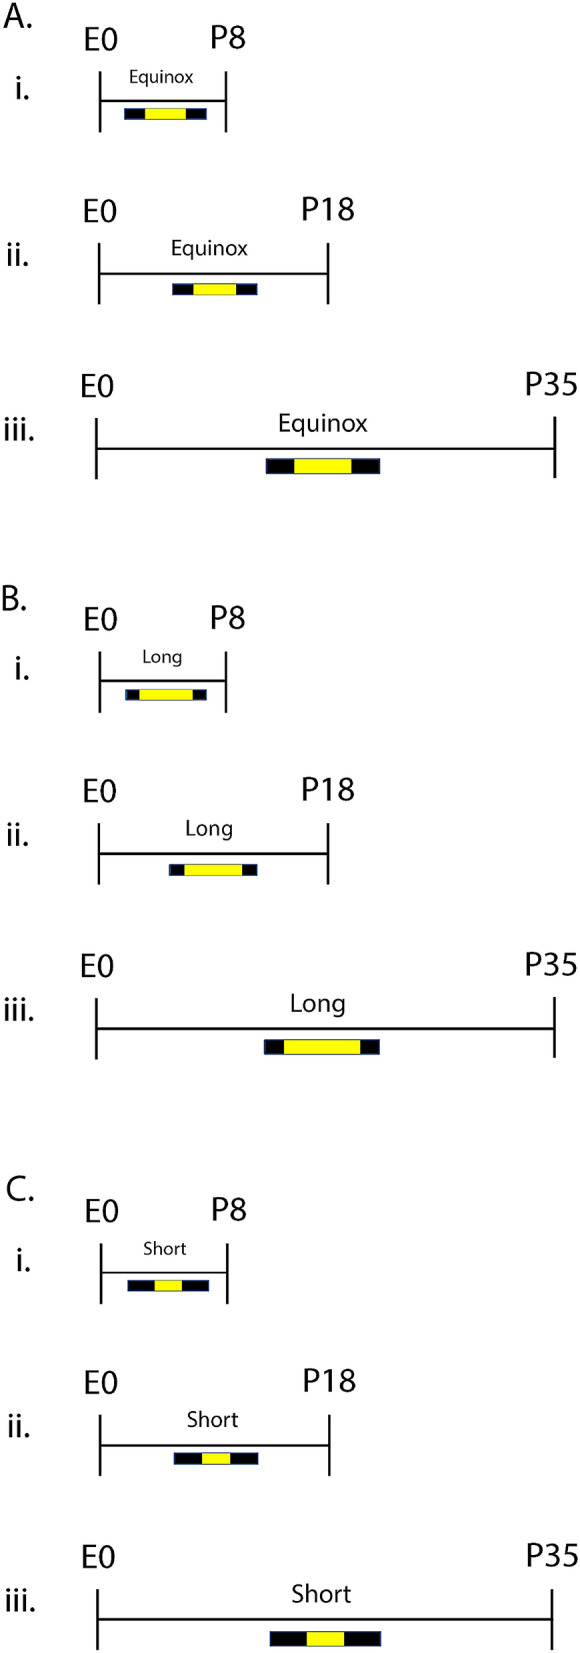
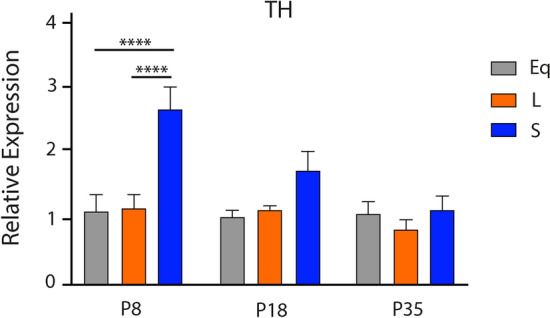
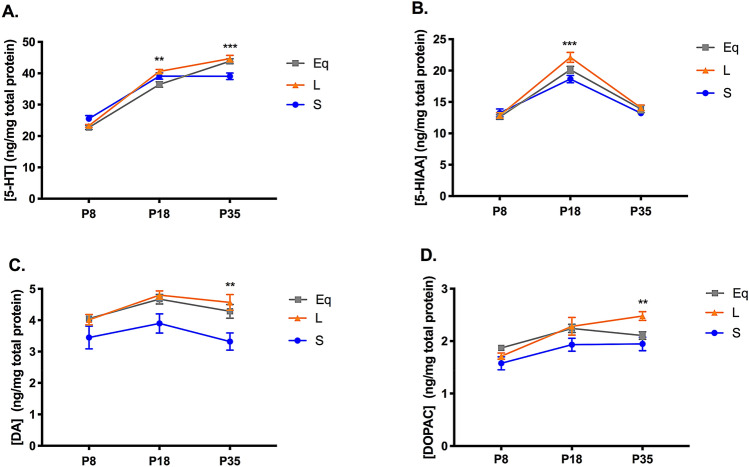
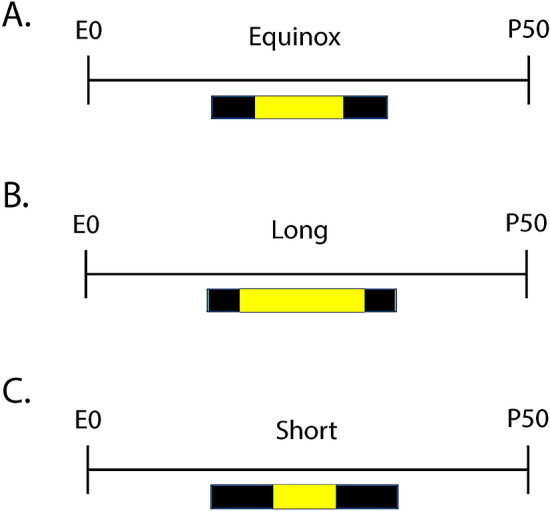
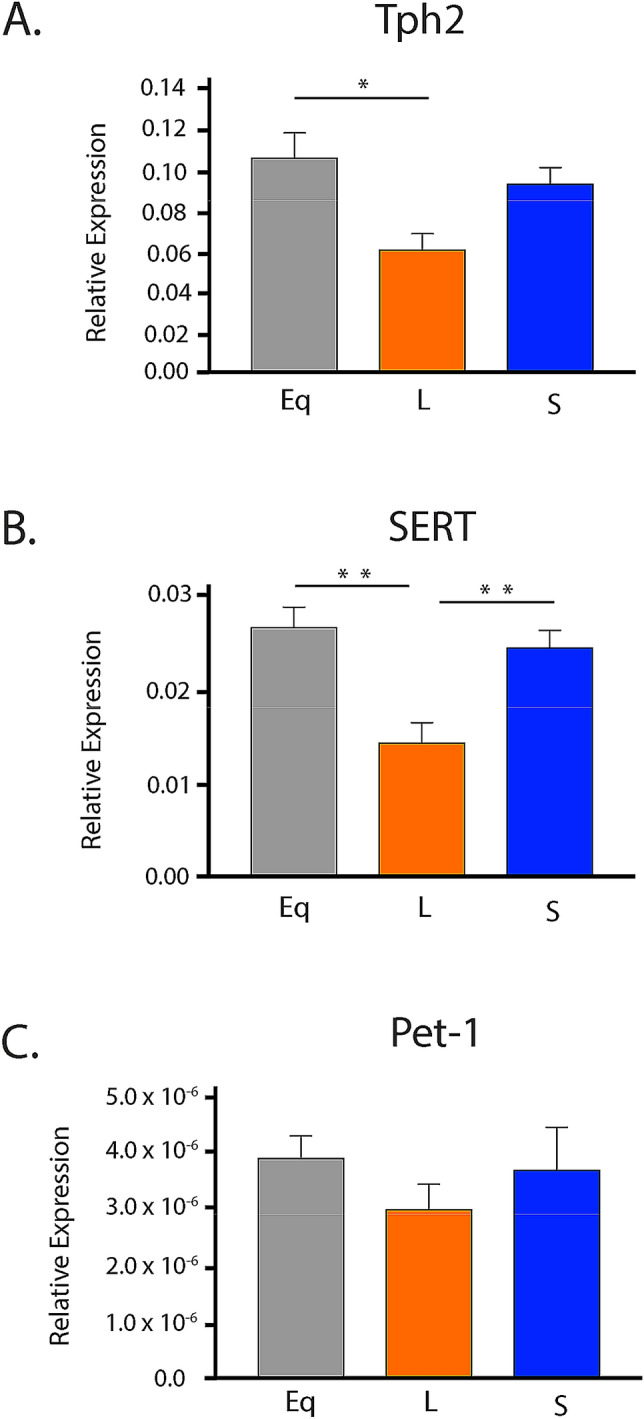
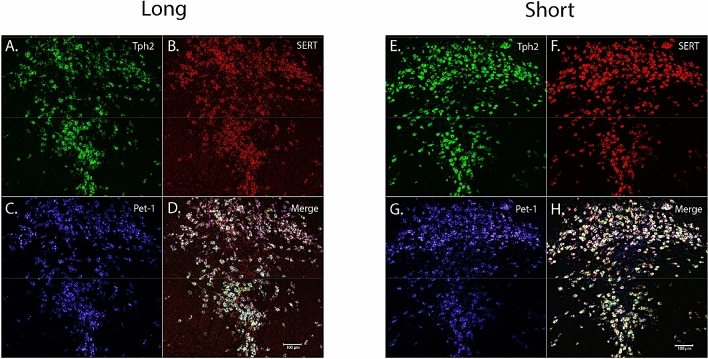
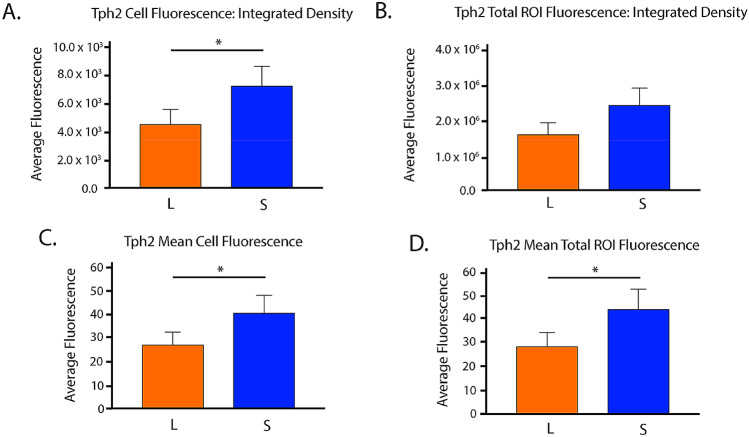
Photoperiod or the duration of daylight has been implicated as a risk factor in the development of mood disorders. The dopamine and serotonin systems are impacted by photoperiod and are consistently associated with affective disorders. Hence, we evaluated, at multiple stages of postnatal development, the expression of key dopaminergic (TH) and serotonergic (Tph2, SERT, and Pet-1) genes, and midbrain monoamine content in mice raised under control Equinox (LD 12:12), Short winter-like (LD 8:16), or Long summer-like (LD 16:8) photoperiods. Focusing in early adulthood, we evaluated the midbrain levels of these serotonergic genes, and also assayed these gene levels in the dorsal raphe nucleus (DRN) with RNAScope. Mice that developed under Short photoperiods demonstrated elevated midbrain TH expression levels, specifically during perinatal development compared to mice raised under Long photoperiods, and significantly decreased serotonin and dopamine content throughout the course of development. In adulthood, Long photoperiod mice demonstrated decreased midbrain Tph2 and SERT expression levels and reduced Tph2 levels in the DRN compared Short photoperiod mice. Thus, evaluating gene × environment interactions in the dopaminergic and serotonergic systems during multiple stages of development may lead to novel insights into the underlying mechanisms in the development of affective disorders.
Conflict of interest statement
The authors declare no competing interests.
Figures
Similar articles
-
Rhythms, Reward, and Blues: Consequences of Circadian Photoperiod on Affective and Reward Circuit Function.Neuroscience. 2021 Mar 1;457:220-234. doi: 10.1016/j.neuroscience.2020.12.010. Epub 2020 Dec 30. Neuroscience. 2021. PMID: 33385488 Free PMC article. Review.
-
Circadian photoperiod alters TREK-1 channel function and expression in dorsal raphe serotonergic neurons via melatonin receptor 1 signaling.J Pineal Res. 2021 Mar;70(2):e12705. doi: 10.1111/jpi.12705. Epub 2020 Dec 12. J Pineal Res. 2021. PMID: 33210730 Free PMC article.
-
Disfunction of dorsal raphe nucleus-hippocampus serotonergic-HTR3 transmission results in anxiety phenotype of Neuroplastin 65-deficient mice.Acta Pharmacol Sin. 2024 Jul;45(7):1393-1405. doi: 10.1038/s41401-024-01252-5. Epub 2024 Mar 25. Acta Pharmacol Sin. 2024. PMID: 38528118 Free PMC article.
-
Photoperiod Impacts Nucleus Accumbens Dopamine Dynamics.eNeuro. 2023 Feb 16;10(2):ENEURO.0361-22.2023. doi: 10.1523/ENEURO.0361-22.2023. Print 2023 Feb. eNeuro. 2023. PMID: 36781229 Free PMC article.
-
Serotonergic genes and suicide: a systematic review.Eur Neuropsychopharmacol. 2013 Oct;23(10):1125-42. doi: 10.1016/j.euroneuro.2013.03.013. Epub 2013 Jun 3. Eur Neuropsychopharmacol. 2013. PMID: 23742855
Cited by
-
Rhythms, Reward, and Blues: Consequences of Circadian Photoperiod on Affective and Reward Circuit Function.Neuroscience. 2021 Mar 1;457:220-234. doi: 10.1016/j.neuroscience.2020.12.010. Epub 2020 Dec 30. Neuroscience. 2021. PMID: 33385488 Free PMC article. Review.
-
Decoding serotonin: the molecular symphony behind depression.Front Cell Neurosci. 2025 Apr 24;19:1572462. doi: 10.3389/fncel.2025.1572462. eCollection 2025. Front Cell Neurosci. 2025. PMID: 40342516 Free PMC article. Review.
-
Effects of age and sex on photoperiod modulation of nucleus accumbens monoamine content and release in adolescence and adulthood.Neurobiol Sleep Circadian Rhythms. 2024 Mar 26;16:100103. doi: 10.1016/j.nbscr.2024.100103. eCollection 2024 May. Neurobiol Sleep Circadian Rhythms. 2024. PMID: 38585223 Free PMC article.
-
Photoperiodic Changes in Both Hypothalamus Neurotransmitters and Circulating Gonadal Steroids Metabolomic Profiles in Relation to Seasonal Reproduction in Male Quail.Front Physiol. 2022 Mar 25;13:824228. doi: 10.3389/fphys.2022.824228. eCollection 2022. Front Physiol. 2022. PMID: 35399254 Free PMC article.
-
The DNA methylation status of the serotonin metabolic pathway associated with reproductive inactivation induced by long-light exposure in Magang geese.BMC Genomics. 2023 Jun 26;24(1):355. doi: 10.1186/s12864-023-09342-0. BMC Genomics. 2023. PMID: 37365488 Free PMC article.
References
-
- (WHO), W. H. O. depression (2019).
-
- (NIMH), N. I. o. M. H. Major depression among adults (2019).
-
- (NIMH), N. I. o. M. H. Major depression among adolescents. (2019).
-
- (CDC), C. f. D. C. a. P. Data and Statistics on Children's Mental Health, https://www.cdc.gov/childrensmentalhealth/data.html (2019).
-
- Hammen, C., Garber, J. & Ingram, R. E. Vulnerability to depression across the lifespan. Vulnerability to psychopathology: Risk across the lifespan, 258–267 (2001).
Publication types
MeSH terms
Substances
Grants and funding
LinkOut - more resources
Full Text Sources
Research Materials
