. 2020 Sep 22;10(1):15413.
doi: 10.1038/s41598-020-72348-1.

Pancreatic β-cells respond to fuel pressure with an early metabolic switch

Affiliations

Pancreatic β-cells respond to fuel pressure with an early metabolic switch

Ronja M Malinowski et al. Sci Rep. .

Abstract

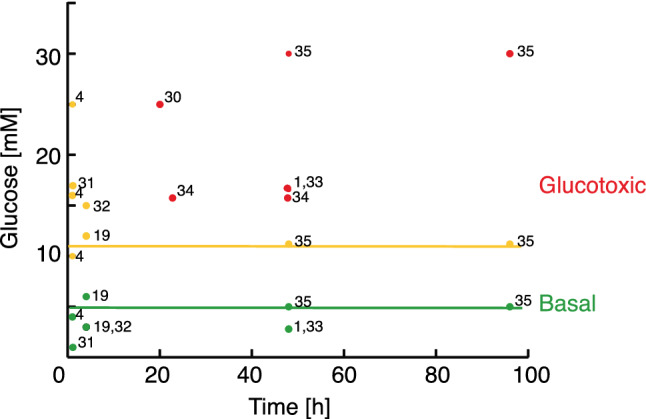
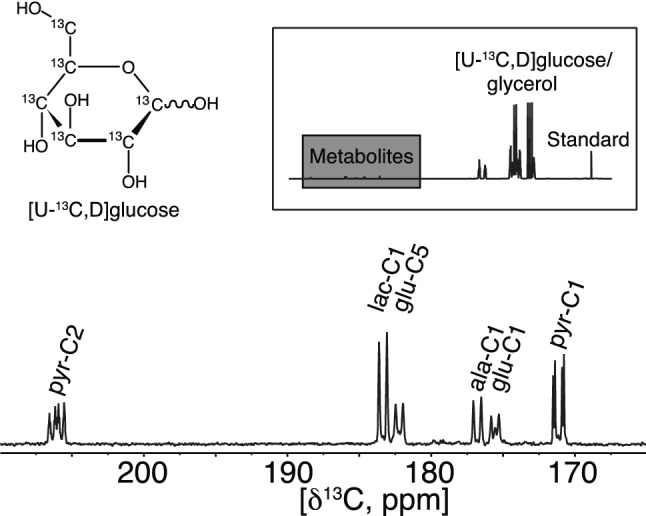
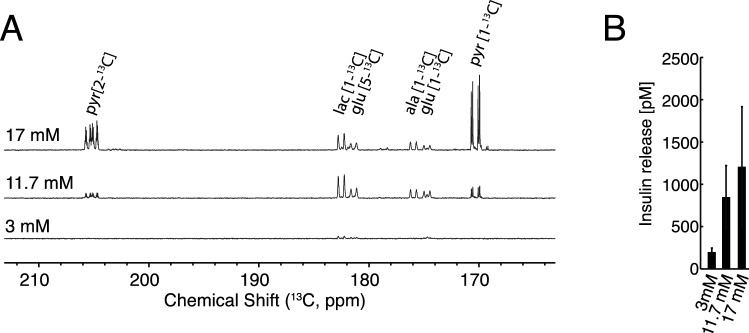
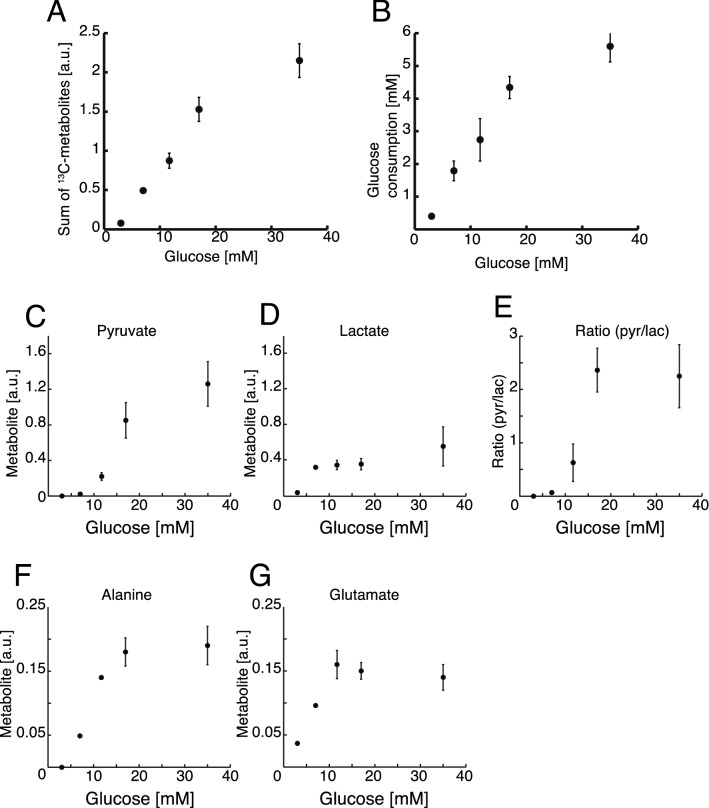
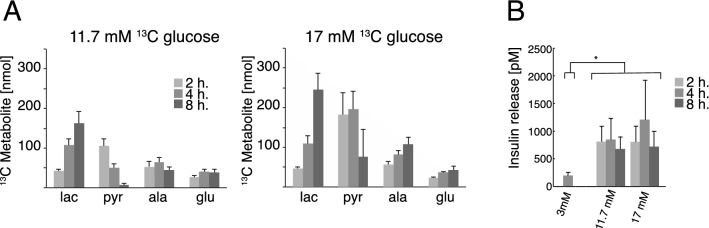
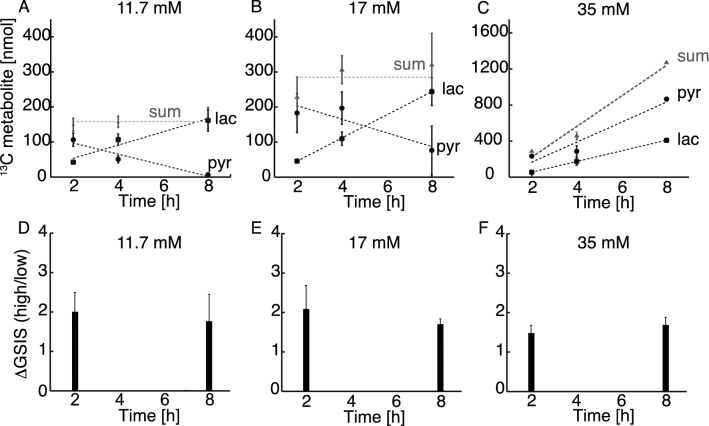
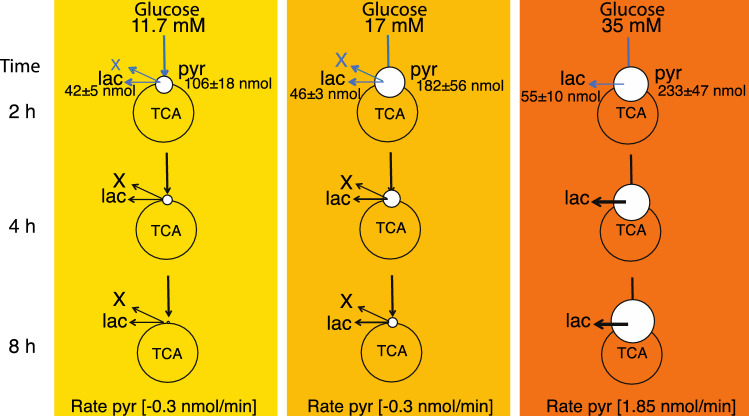
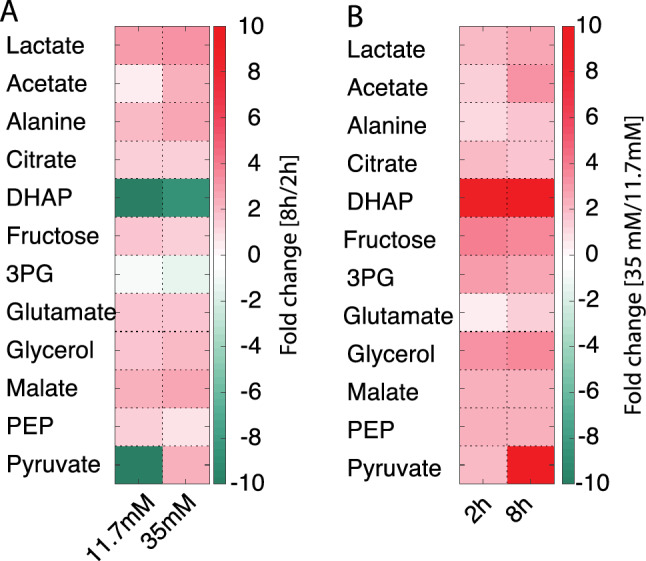
Pancreatic β-cells become irreversibly damaged by long-term exposure to excessive glucose concentrations and lose their ability to carry out glucose stimulated insulin secretion (GSIS) upon damage. The β-cells are not able to control glucose uptake and they are therefore left vulnerable for endogenous toxicity from metabolites produced in excess amounts upon increased glucose availability. In order to handle excess fuel, the β-cells possess specific metabolic pathways, but little is known about these pathways. We present a study of β-cell metabolism under increased fuel pressure using a stable isotope resolved NMR approach to investigate early metabolic events leading up to β-cell dysfunction. The approach is based on a recently described combination of 13C metabolomics combined with signal enhanced NMR via dissolution dynamic nuclear polarization (dDNP). Glucose-responsive INS-1 β-cells were incubated with increasing concentrations of [U-13C] glucose under conditions where GSIS was not affected (2-8 h). We find that pyruvate and DHAP were the metabolites that responded most strongly to increasing fuel pressure. The two major divergence pathways for fuel excess, the glycerolipid/fatty acid metabolism and the polyol pathway, were found not only to operate at unchanged rate but also with similar quantity.


Conflict of interest statement

The authors declare no competing interests.

Figures

Figure 1
Figure 1
Literature survey of insulin response to glucose loading in β-cells. Green represents basal blood glucose concentration (up to 5 mM); yellow represent glucose concentrations, where insulin response is increased compared to the basal condition. The yellow line is drawn at 11.7 mM glucose; red represents glucotoxic conditions where insulin secretion is reduced compared to the basal condition. Numbers refer to literature references. Additional information including cell line and incubation conditions for the referred studies are collected in Tab S1.
Figure 2
Figure 2
13C NMR spectrum of hyperpolarized metabolites after 4 h of incubation with 11.7 mM [U-13C,D] glucose. The metabolites were polarized for 90 min. after which they were subjected to rapid dissolution in hot phosphate buffer. Four metabolites were observed with distinct carbonyl shifts at: 2-13C-pyruvate (205.8 ppm), 1-13C-lactate (183.4 ppm), 5-13C-glutamate (182.2 ppm), 1-13C-alanine (176.8 ppm), 1-13C-glutamate (175.6 ppm) and 1-13C-pyruvate (171.2 ppm). The full spectrum is displayed in the insert where a grey box indicates the expanded region with the metabolites mentioned above. Other components in the sample were glucose, glycerol to mediate the hyperpolarization and an internal standard for quantification.
Figure 3
Figure 3
(A) 13C NMR spectrum of hyperpolarized metabolites after 4 h of incubation with 3, 11.7 and 17 mM [U-13C,D] glucose. The metabolites were polarized for 90 min after which they were subjected to rapid dissolution in hot phosphate buffer. (B) Corresponding accumulated insulin ELISA on extract supernatant and cell lysate from 3–17 mM glucose, n = 4. A statistically significant increase in insulin release was found by regression analysis (adjusted R = 0.999; ANOVA analysis p = 0.016). Insulin content was also determined (Fig S2).
Figure 4
Figure 4
(A) Sum of measured metabolites relative to an internal standard plotted against the glucose concentration (3 – 35 mM) after 4 h of incubation, n = 4. (B) Glucose consumption (mM) plotted against the glucose concentration after 4 h of incubation measured by UV-assay, n = 4. (CG) Individual metabolic profiles of 13C labelled metabolites contributing to the sum shown in A.
Figure 5
Figure 5
(A) Observed metabolites quantified relative to the internal standard. Cells were incubated for 2 – 8 h with respectively 11.7 mM and 17 mM [U-13C,D] glucose (n = 4). Lactate was significantly larger at 17 mM compared to 11.7 mM after 8 h (p < 0.05, Student’s t-test). Changes in glutamate and alanine with incubation time were not significant (p > 0.05) for 11.7 mM, whereas both glutamate (p = 0.01) and alanine (p = 0.002) levels increased significantly over time, if β-cells were exposed to 17 mM glucose (ANOVA). (B) Corresponding accumulated insulin release (n = 4). As expected, the insulin release was increased at the higher glucose levels (3 mM vs 11.7 mM and 17 mM; p < 0.001 (*). Insulin content was also determined (Fig S2).
Figure 6
Figure 6
(A–C) The two main metabolites lactate and pyruvate and their sum responding over time to various glucose concentrations (11.7, 17 and 35 mM). The sum of pyruvate and lactate did not change significantly over time (p > 0.05, ANOVA followed by Student’s t-tests). (D–F) The corresponding glucose stimulated insulin secretion (GSIS) as a ratio between high and low glucose stimulation (2 and 17 mM glucose respectively) from GSIS experiment carried out after either 2 or 8 h of incubation with the three glucose concentrations (n = 4). No significant change was found, neither as function of time (2–8 h) nor concentration (11.7–35 mM) (p = 0.8 for 11.7 mM, p = 0.5 for 17 mM and p = 0.4 for 35 mM ΔGSIS 2 h vs 8 h, Student’s t-tests). The responses to incubations are similar for all conditions.
Figure 7
Figure 7
Schematic representation of β-cell metabolism under increasing fuel pressure (11.7 to 35 mM glucose) in the time span of 2–8 h. Measured amounts of pyruvate and lactate (nmol) after 2 h incubation are displayed for the three glucose concentrations. After 2 h incubation there is: Constant glucose consumption, constant production of glutamate (TCA cycle), constant production of lactate but large plasticity in the pyruvate pool (white circle). To account for the loss in observed pyruvate a divergence pathway away from the central glycolysis must take place. This divergence pathway (depicted as “X”) has the rate corresponding to the determined loss of pyruvate (0.3 nmol/min) for 11.7 and 17 mM glucose. At very high fuel pressure (35 mM) this metabolic pathway is not used anymore and pyruvate accumulates. Blue arrows indicate undetermined rates from 0–2 h. All data are scaled relative to the mildest conditions at 11.7 mM and 2 h for visualization (see Tab. S3 for actual numbers).
Figure 8
Figure 8
Colour map of metabolites originating from [U-13C] glucose measured in 1H-13C-HSQC NMR spectra as mean of n = 3 replica. (A) For each metabolite, the ratio of concentrations between determinations after 8 h and 2 h incubation is shown. (B) For each metabolite, the ratio between 35 mM and 11.7 mM glucose is shown. Individual ratios with standard deviation are given in Fig S3.

References

    1. Göhring I, et al. Chronic high glucose and pyruvate levels differentially affect mitochondrial bioenergetics and fuel-stimulated insulin secretion from clonal INS-1 832/13 cells. J. Biol. Chem. 2014;289:3786. doi: 10.1074/jbc.M113.507335. - DOI - PMC - PubMed
    1. Poitout V, Robertson R. Glucolipotoxicity: fuel excess and b-cell dysfunction. Endocr. Rev. 2008;29:3. doi: 10.1210/er.2007-0023. - DOI - PMC - PubMed
    1. Robertson RP, Harmon J, Tran PO, Tanaka Y, Takahashi H. Glucose Toxicity in beta-cells: type 2 diabetes, good radicals gone bad, and the glutathione connection. Diabetes. 2003;52:581. doi: 10.2337/diabetes.52.3.581. - DOI - PubMed
    1. Mugabo Y, et al. Metabolic fate of glucose and candidate signaling and excess-fuel detoxification pathways in pancreatic beta-cells. J. Biol. Chem. 2017;292:18. doi: 10.1074/jbc.M116.763060. - DOI - PMC - PubMed
    1. Jensen MV, et al. Metabolic cycling in control of glucose-stimulated insulin secretion. Am J Physiol Endocrinol Metab. 2008;295:1287. doi: 10.1152/ajpendo.90604.2008. - DOI - PMC - PubMed

Publication types