. 2021 Jan;15(1):270-281.
doi: 10.1038/s41396-020-00780-2. Epub 2020 Sep 22.

Air pollution could drive global dissemination of antibiotic resistance genes

Affiliations

Air pollution could drive global dissemination of antibiotic resistance genes

Guibing Zhu et al. ISME J. 2021 Jan.

Abstract

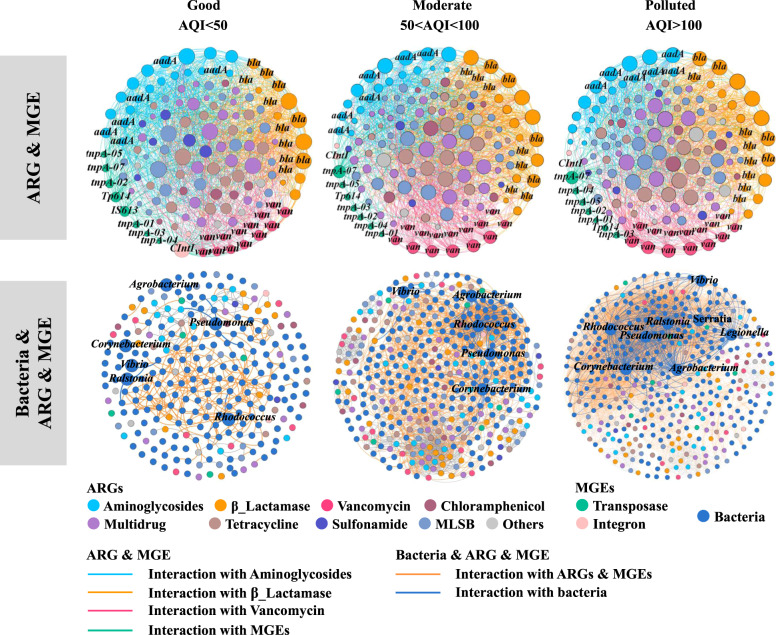
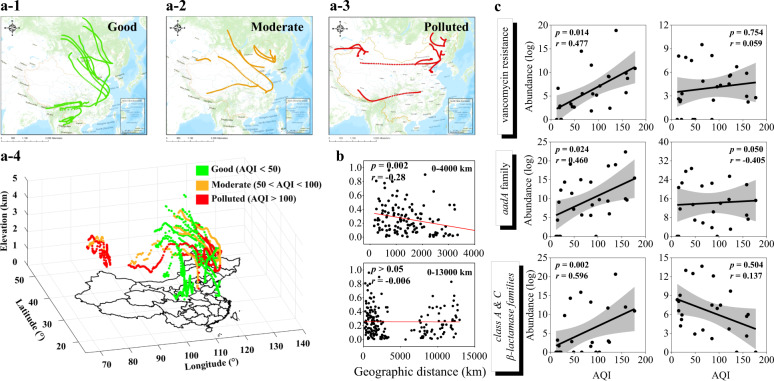
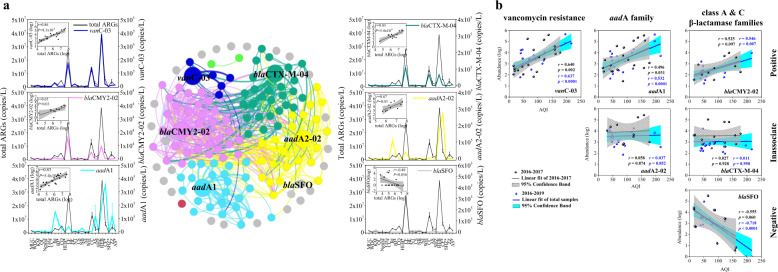
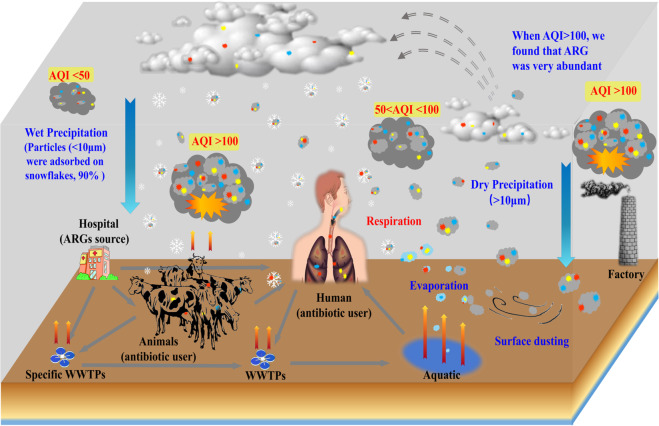
Antibiotic-resistant pathogens pose a significant threat to human health. Several dispersal mechanisms have been described, but transport of both microbes and antibiotic resistance genes (ARGs) via atmospheric particles has received little attention as a pathway for global dissemination. These atmospheric particles can return to the Earth's surface via rain or snowfall, and thus promote long-distance spread of ARGs. However, the diversity and abundance of ARGs in fresh snow has not been studied and their potential correlation with particulate air pollution is not well explored. Here, we characterized ARGs in 44 samples of fresh snow from major cities in China, three in North America, and one in Europe, spanning a gradient from pristine to heavily anthropogenically influenced ecosystems. High-throughput qPCR analysis of ARGs and mobile genetic elements (MGEs) provided strong indications that dissemination of ARGs in fresh snow could be exacerbated by air pollution, severely increasing the health risks of both air pollution and ARGs. We showed that snowfall did effectively spread ARGs from point sources over the Earth surface. Together our findings urge for better pollution control to reduce the risk of global dissemination of antibiotic resistance genes.


Conflict of interest statement

The authors declare that they have no conflict of interest.

Figures

Fig. 1
Fig. 1. Spatiotemporal distribution of antibiotic resistance genes (ARGs) and mobile genetic elements (MGEs) in global atmospheric snow under different air quality index (AQI) values.
a Sampling sites and years of atmospheric snow. A total of 48 snow sampling sites, 44 fresh snow samples from major cities in China and three in North America and one in Europe, were collected across the world, covering different climatic and geological zones. The sites were affected by different climatic, socio-economic, and physiochemical factors, at various degrees. The size of the solid circles represents the AQI value. b Absolute abundance, numbers of different ARGs and MGEs, and bacterial abundance at sampling sites, binned by different AQI values. Sampling sites are divided into different pollution levels based on AQI intervals of <50, 50–100, and >100, representing good, moderate, and polluted air, respectively. The unit of abundance was copies per liter of snow water. Error bars represent standard error (SE) of the replicates at each site (n = 3). c The pie charts show the proportions of four resistance mechanisms (antibiotic deactivation, efflux pumps, cellular protection, and others) under different pollution levels. d Heatmap of detected ARGs, classified by resistance mechanisms, from snow collected under different AQI values. Only ARGs of which the total abundance was accounted over 60% of each resistance mechanism were shown. The values of the heatmap was the log of ARG absolute abundance.
Fig. 2
Fig. 2. Overview of the networks of ARG and MGE and bacteria and ARG and MGE in snow under different categories of air quality.
In the ARG and MGE networks, nodes and edges are colored according to the homology of ARGs and MGEs. The nodes with a high degree of significance are labeled, being classified into the aadA family, vancomycin resistance, the class A and C β-lactamase families, and transposase, respectively. Node size was proportional to node degree; edges represent interactions between nodes. In the bacterial and ARG and MGE networks, nodes were colored for the types of ARGs and genera of bacteria. Edges were colored for the interactions with ARGs and bacteria, respectively (see Supplementary Tables S7 and S8 for detailed network parameters).
Fig. 3
Fig. 3. Global distribution of airflow trajectory under different pollution levels and correlation between antibiotic resistance genes (ARGs) and air quality index (AQI) in snow.
Plane graphs of airflow trajectory under different air qualities with a-1 AQI < 50 (good), a-2 50 < AQI < 100 (moderate), and a-3 AQI > 100 (polluted), and a-4 stereogram of the pressure variation of air trajectory under different pollution levels. The green bar indicates clean sampling sites where the airflow trajectory showed both horizontal and vertical dimensions; the orange bar indicates light pollution, and red bars indicate heavy pollution, where the airflow descent trajectory decreased. b Distance-decay analysis of ARG similarity revealed a significant spatial pattern of ARG distribution. National scale, from 0 to 4000 km, Pearson’s r = −0.28, p = 0.002. Global scale, from 0 to 13,000 km, Pearson’s r = −0.006, p > 0.05. c Correlation between AQI value and the abundance of typical ARG families (aadA family, vancomycin resistance, the class A and C β-lactamase families) (expressed as copies per L snow water, plotted on a log scale). The left column shows that parts of the ARG subtypes of the families were significantly positively related to AQI. The upper two graphs on the right column show that parts of the subtypes of the vancomycin resistance and aadA family showed no obvious difference as pollution increased, while the latter graph shows that some in the class A β-lactamase families decreased with increasing pollution levels.
Fig. 4
Fig. 4. Potential ARG biomarkers and their correlation with total ARGs and air pollution.
a Co-occurrence network analysis of ARG biomarkers and their correlation with total ARGs. The network shows the potential interaction among the ARG biomarkers (different colors). The line plots show the abundance of each biomarker (different colors) along with the total ARG abundance (gray) in all sampling sites. Biomarkers were colored differently for both the nodes in the network and the lines in the curves, with vanC-03 in blue, blaCMY2-02 in magenta, aadA1 in light cyan, blaCTX-M-04 in dark cyan, aadA2-02 in yellow, and blaSFO in light gray. The linear regression curves in the upper left of each line plot show the correlation between abundance of potential biomarkers and the total ARGs. b Correlation between potential biomarkers and AQI. Data for 2016–2017 and 2018–2019 are shown in the black and the blue plot, respectively. The blue line with light cyan represents the linear regression of biomarker and AQI in total snow samples from 2016 to 2019. The gray line with light gray represents the linear regression of biomarker and AQI in the snow samples from 2016 to 2017.
Fig. 5
Fig. 5. Schematic representation of the ARGs environmental loop.
The ARGs generated from hospitals, livestock farms, and sewage treatment plants (among others) could emit from terrestrial surface soil and water ecosystems into the atmosphere through wind action, water evaporation, and dust transport, and return to ground again via wet or dry precipitation. The increase of particulate matter (PM) in the air will significantly increase ARGs’ habitats. Particularly in winter, these ARGs mainly come back to the surface via snowfall deposition, making it more accessible again to the human, animals, and other pathogenic microorganisms. The ARGs cycle among the atmosphere, terrestrial and aquatic ecosystems will result in a continuity of hazardous exposure to ARGs. The red, yellow, and blue points represent various ARGs, and the gray irregular circle represents particulate matter.

References

    1. Tang XJ, Lou CL, Wang SX, Lu YH, Liu M, Hashmi MZ, et al. Effects of long-term manure applications on the occurrence of antibiotics and antibiotic resistance genes (ARGs) in paddy soils: evidence from four field experiments in south of China. Soil Biol Biochem. 2015;90:179–87.
    1. Baquero F, Martínez JL, Cantón R. Antibiotics and antibiotic resistance in water environments. Curr Opin Biotech. 2008;19:260–5. - PubMed
    1. Czekalski N, Diez EG, Buergmann H. Wastewater as a point source of antibiotic-resistance genes in the sediment of a freshwater lake. ISME J. 2014;8:1381–90. - PMC - PubMed
    1. Zhu YG, Zhao Y, Li B, Huang CL, Zhang SY, Yu S, et al. Continental-scale pollution of estuaries with antibiotic resistance genes. Nat Microbiol. 2017;2:3435–40.. - PubMed
    1. Marti E, Variatza E, Luis, Balcazar J. The role of aquatic ecosystems as reservoirs of antibiotic resistance. Trends Microbiol. 2014;2:36–41. - PubMed

Publication types

Substances