

Controlling the Spread of COVID-19: Optimal Control Analysis
- PMID: 32963585
- PMCID: PMC7499329
- DOI: 10.1155/2020/6862516
Controlling the Spread of COVID-19: Optimal Control Analysis
Abstract
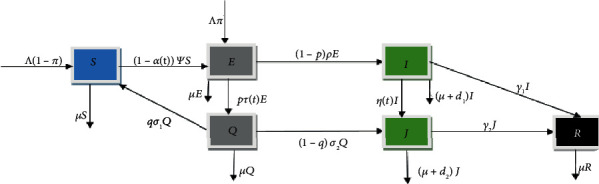
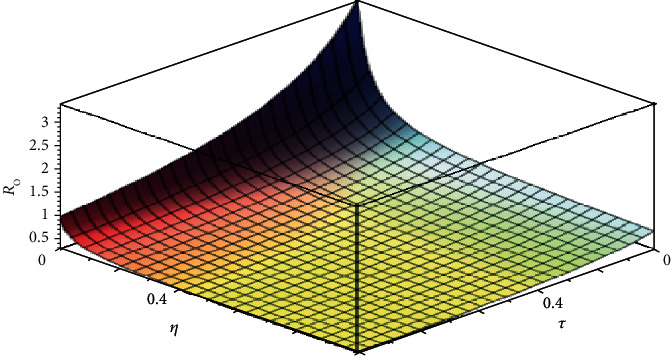
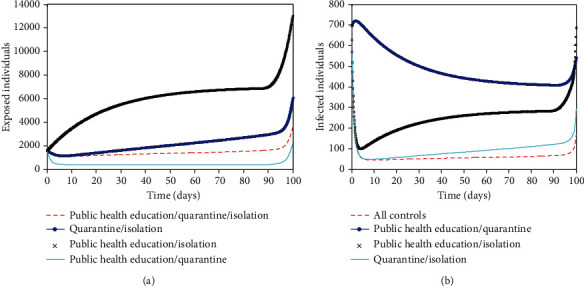
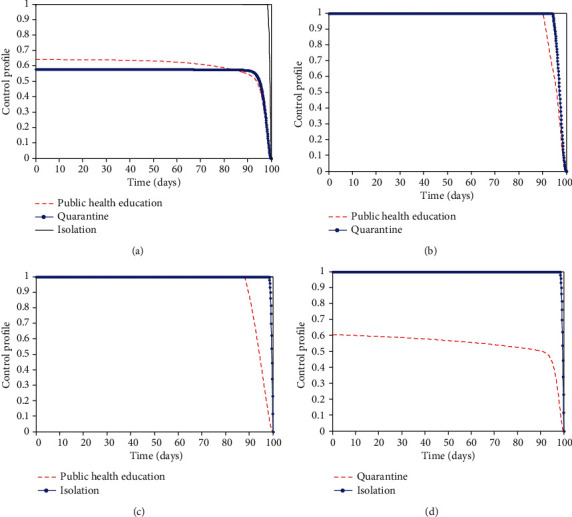
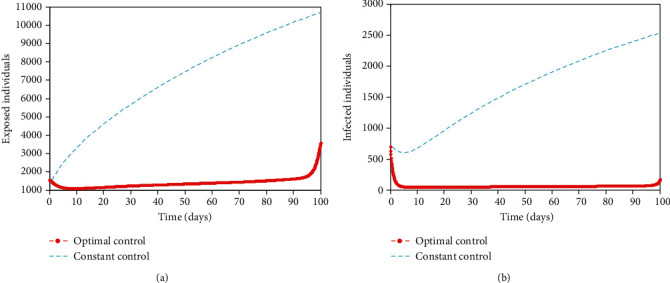
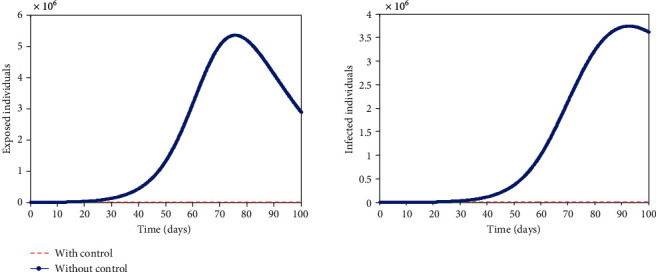
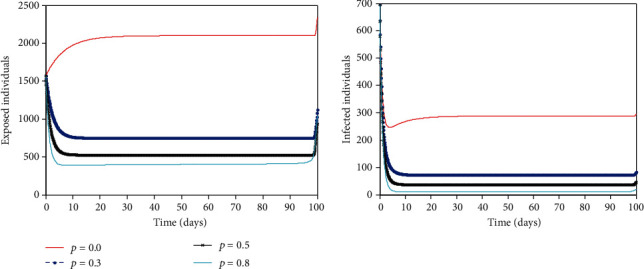
Coronavirus disease 2019 (COVID-19) is a disease caused by severe acute respiratory syndrome coronavirus 2 (SARS CoV-2). It was declared on March 11, 2020, by the World Health Organization as pandemic disease. The disease has neither approved medicine nor vaccine and has made governments and scholars search for drastic measures in combating the pandemic. Regrettably, the spread of the virus and mortality due to COVID-19 has continued to increase daily. Hence, it is imperative to control the spread of the disease particularly using nonpharmacological strategies such as quarantine, isolation, and public health education. This work studied the effect of these different control strategies as time-dependent interventions using mathematical modeling and optimal control approach to ascertain their contributions in the dynamic transmission of COVID-19. The model was proven to have an invariant region and was well-posed. The basic reproduction number and effective reproduction numbers were computed with and without interventions, respectively, and were used to carry out the sensitivity analysis that identified the critical parameters contributing to the spread of COVID-19. The optimal control analysis was carried out using the Pontryagin's maximum principle to figure out the optimal strategy necessary to curtail the disease. The findings of the optimal control analysis and numerical simulations revealed that time-dependent interventions reduced the number of exposed and infected individuals compared to time-independent interventions. These interventions were time-bound and best implemented within the first 100 days of the outbreak. Again, the combined implementation of only two of these interventions produced a good result in reducing infection in the population. While, the combined implementation of all three interventions performed better, even though zero infection was not achieved in the population. This implied that multiple interventions need to be deployed early in order to reduce the virus to the barest minimum.
Copyright © 2020 Chinwendu E. Madubueze et al.
Conflict of interest statement
The authors declared there are no conflicts of interest.
Figures
References
-
- World Health Organization. Coronavirus Disease 2019 (COVID-19), Situation Report -51, Data as reported by 11 March 2020. https://www.who.int/emergencies/disease/novel-coronavirus-2019/situation....
-
- 1mg. Coronavirus No-Panic Help guide. https://smef.org.uk/wp-content/uploads/2020/03/Corona-Ebook.pdf.pdf.pdf.
MeSH terms
LinkOut - more resources
Full Text Sources
Miscellaneous
