Multimodal Detection for Cryptogenic Epileptic Seizures Based on Combined Micro Sensors
- PMID: 32964037
- PMCID: PMC7492941
- DOI: 10.1155/2020/5734932
Multimodal Detection for Cryptogenic Epileptic Seizures Based on Combined Micro Sensors
Abstract
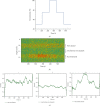
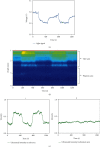
The cryptogenic epilepsy of the neocortex is a disease in which the seizure is accompanied by intense cerebral nerve electrical activities but the lesions are not observed. It is difficult to locate disease foci. Electrocorticography (ECoG) is one of the gold standards in seizure focus localization. This method detects electrical signals, and its limitations are inadequate resolution which is only 10 mm and lack of depth information. In order to solve these problems, our new method with implantable micro ultrasound transducer (MUT) and photoplethysmogram (PPG) device detects blood changes to achieve higher resolution and provide depth information. The basis of this method is the neurovascular coupling mechanism, which shows that intense neural activity leads to sufficient cerebral blood volume (CBV). The neurovascular coupling mechanism established the relationship between epileptic electrical signals and CBV. The existence of mechanism enables us to apply our new methods on the basis of ECoG. Phantom experiments and in vivo experiments were designed to verify the proposed method. The first phantom experiments designed a phantom with two channels at different depths, and the MUT was used to detect the depth where the blood concentration changed. The results showed that the MUT detected the blood concentration change at the depth of 12 mm, which is the position of the second channel. In the second phantom experiments where a PPG device and MUT were used to monitor the change of blood concentration in a thick tube, the results showed that the trend of superficial blood concentration change provided by the PPG device is the same as that provided by the MUT within the depth of 2.5 mm. Finally, in the verification of in vivo experiments, the blood concentration changes on the surface recorded by the PPG device and the changes at a certain depth recorded by the MUT all matched the seizure status shown by ECoG. These results confirmed the effectiveness of the combined micro sensors.
Copyright © 2020 Zhitian Shen et al.
Conflict of interest statement
The authors declare that they have no conflicts of interest.
Figures


References
-
- Goldensohn E. S., Salazar A. M. Temporal and spatial distribution of intracellular potentials during generation and spread of epileptogenic discharges. Advances in Neurology. 1986;44:559–582. - PubMed
-
- Carneiro Filho O., Vilela Filho O., Ragazzo P. C., Fonseca L. M. A new method for intraoperative localization of epilepsy focus by means of a gamma probe. Radiologia Brasileira. 2014;47(1):23–27. doi: 10.1590/S0100-39842014000100010. - DOI
MeSH terms
LinkOut - more resources
Full Text Sources
Medical

