. 2020 Nov 25;29(19):3249-3265.
doi: 10.1093/hmg/ddaa212.

Altered Capicua expression drives regional Purkinje neuron vulnerability through ion channel gene dysregulation in spinocerebellar ataxia type 1

Affiliations

Altered Capicua expression drives regional Purkinje neuron vulnerability through ion channel gene dysregulation in spinocerebellar ataxia type 1

Ravi Chopra et al. Hum Mol Genet. .

Abstract

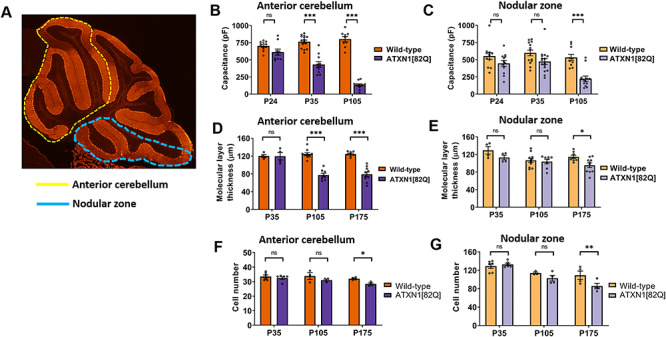
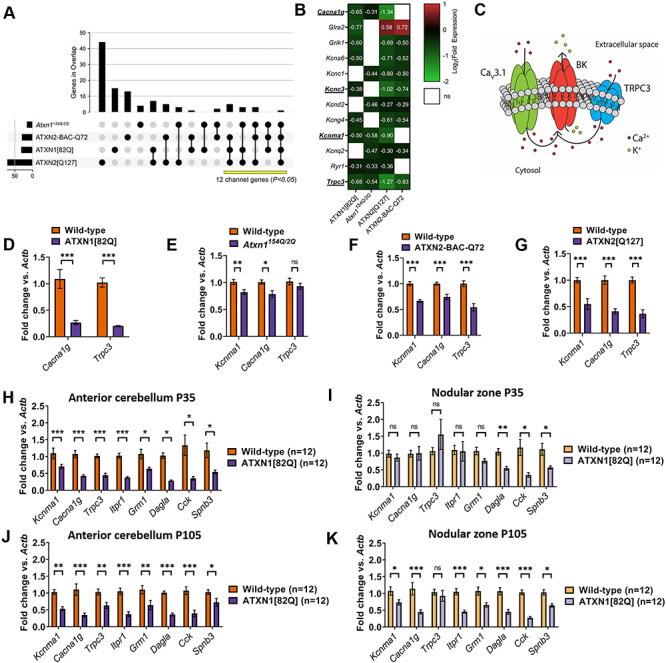
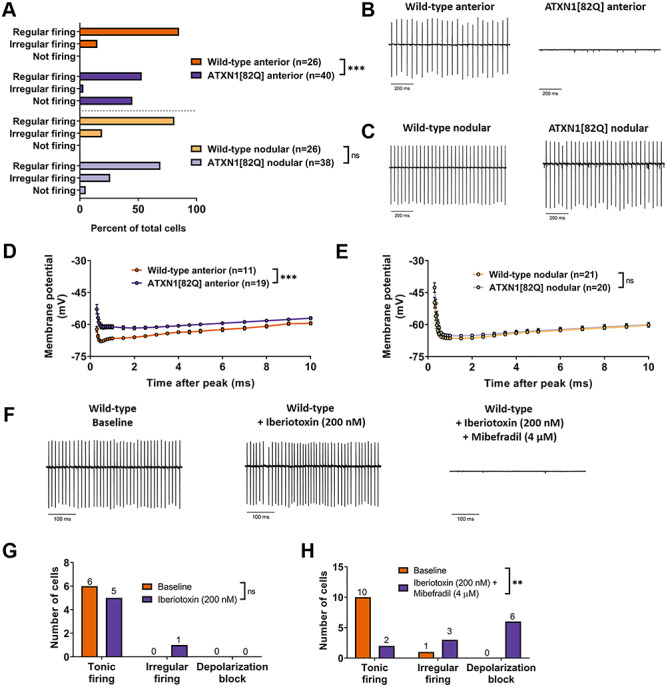
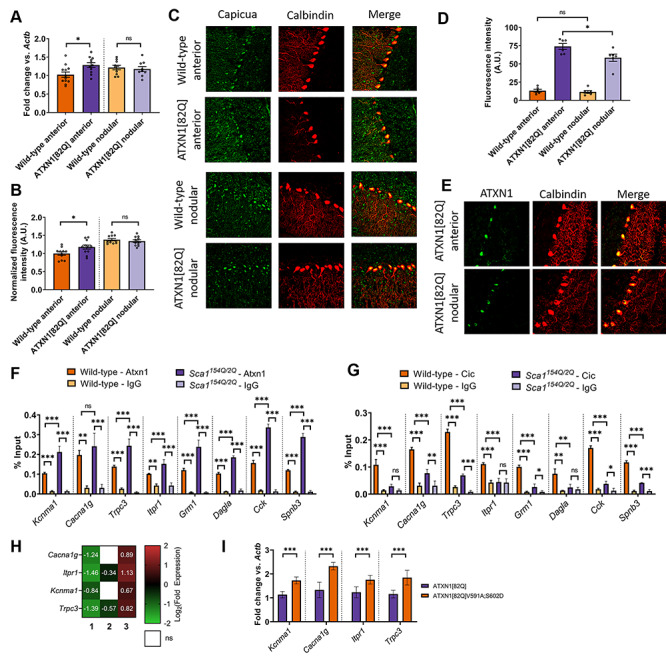
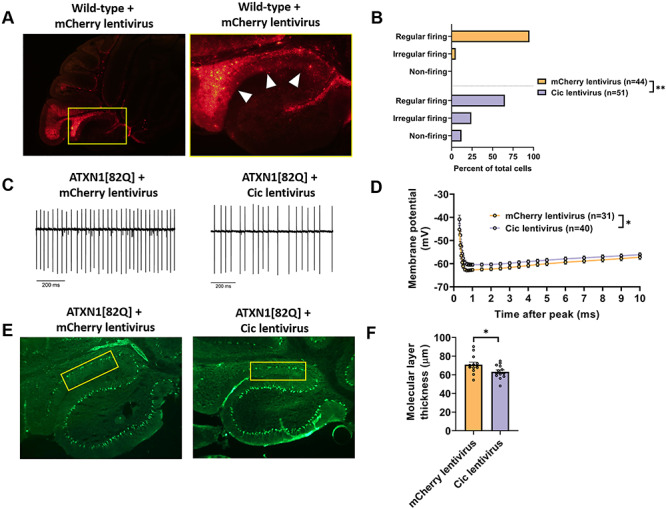
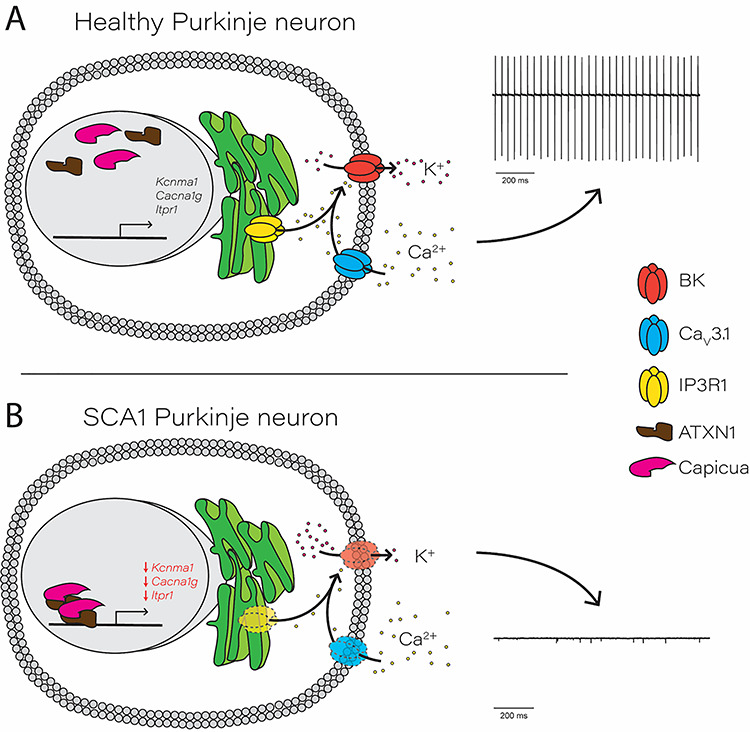
Selective neuronal vulnerability in neurodegenerative disease is poorly understood. Using the ATXN1[82Q] model of spinocerebellar ataxia type 1 (SCA1), we explored the hypothesis that regional differences in Purkinje neuron degeneration could provide novel insights into selective vulnerability. ATXN1[82Q] Purkinje neurons from the anterior cerebellum were found to degenerate earlier than those from the nodular zone, and this early degeneration was associated with selective dysregulation of ion channel transcripts and altered Purkinje neuron spiking. Efforts to understand the basis for selective dysregulation of channel transcripts revealed modestly increased expression of the ATXN1 co-repressor Capicua (Cic) in anterior cerebellar Purkinje neurons. Importantly, disrupting the association between ATXN1 and Cic rescued the levels of these ion channel transcripts, and lentiviral overexpression of Cic in the nodular zone accelerated both aberrant Purkinje neuron spiking and neurodegeneration. These findings reinforce the central role for Cic in SCA1 cerebellar pathophysiology and suggest that only modest reductions in Cic are needed to have profound therapeutic impact in SCA1.


Figures

Figure 1
Figure 1
Purkinje neuron degeneration is delayed in the nodular zone of ATXN1[82Q] mice. (A) Diagram outlining the anterior cerebellar lobules (yellow dotted line) and nodular zone (blue dotted line). (B and C) Total Purkinje neuron capacitance was measured in the anterior cerebellum (B) and nodular zone (C) of ATXN1[82Q] mice and wild-type controls at P24, P35 and P105. (D and E) Molecular layer thickness, a measurement which reflects the length of Purkinje neuron dendrites, was measured in the anterior cerebellum (D) and nodular zone (E) of ATXN1[82Q] mice and wild-type controls at P35, P105 and P175. (F and G) Cell number was measured in the anterior cerebellum (F) and nodular zone (G) of ATXN1[82Q] mice and wild-type controls at P35, P105 and P175. *Denotes P < 0.05, ***denotes P < 0.001, ns denotes P > 0.05; two-way repeated-measures ANOVA with Holm-Sidak correction for multiple comparisons.
Figure 2
Figure 2
A functionally related module of channels is dysregulated uniquely in the anterior cerebellum of SCA1 mice. (A) IUPHAR-recognized ion channel genes that are dysregulated across models of SCA1 and SCA2. Vertical bars represent the number of ion channel genes unique to each overlap, and each overlap is delineated by black dots and linkages below the graph. The total number of ion channel genes differentially expressed in each model is shown as horizontal bars. The number of the channels that are found in at least three of four models (yellow bar) is statistically significant, with P-value reflecting the likelihood of an equivalent number of channels (or more) being dysregulated in these overlaps by chance (see Materials and Methods section). (B) Twelve ion channel transcripts are among the genes that are differentially expressed in the original analyses from three or four models of SCA1 and SCA2. Four of these channel transcripts (Cacna1g, Kcnc3, Kcnma1 and Trpc3) are known ataxia genes and are underlined. (C) Proposed ion channel excitability module, highlighting a possible role for Cav3.1 (encoded by Cacna1g) and TRPC3 (Trpc3) in providing Ca2+ for activation of BK channels (Kcnma1). (DG) qRT-PCR for Kcnma1, Cacna1g and Trpc3 transcripts from cerebella of 15-week ATXN1[82Q] mice (D), 14-week Atxn1154Q/2Q mice (E), 16-week ATXN2-BAC-Q72 mice (F) and 24-week ATXN2[Q127] mice (G). These are ages at which Purkinje cell loss is not present in these models. (HK) Quantitative real-time PCR (qRT-PCR) was performed in macrodissected cerebella from ATXN1[82Q] mice and wild-type controls at P35 from (H) anterior cerebellum or (I) nodular zone and at P105 from (J) anterior cerebellum or (K) nodular zone. *Denotes P < 0.05; **denotes P < 0.01; ***denotes P < 0.001; ns denotes P > 0.05; two-tailed Student’s t-test with Holm-Sidak correction for multiple comparisons.
Figure 3
Figure 3
Regionally dysregulated ion channel genes form a functional module critical for Purkinje neuron pacemaking. (A) The distribution of regularly firing, irregularly firing and non-firing cells was recorded for Purkinje neurons in the anterior cerebellum and nodular zone. (B) Representative trace from a tonic firing wild-type and non-firing ATXN1[82Q] Purkinje neuron in the anterior cerebellum at P35. (C) Representative trace from wild-type and ATXN1[82Q] Purkinje neurons in the nodular zone at P35. (D and E) Membrane potential measurements during the AHP in wild-type Purkinje neurons (D) and ATXN1[82Q] Purkinje neurons (E) in the anterior cerebellum at P35. (F) Representative traces of wild-type Purkinje neurons in the anterior cerebellum at P35. Traces are shown at baseline (left), after perfusion of 200 nM iberiotoxin (middle) and after perfusion of 200 nM iberiotoxin +4 μM mibefradil. (G and H) Summary distribution of regularly firing, irregularly firing and non-firing Purkinje neurons before and after perfusion of 200 nM iberiotoxin (G) and after 200 nM iberiotoxin +4 μM mibefradil (H). **Denotes P < 0.01; ***denotes P < 0.001; ns denotes P > 0.05; Chi-square test (A, G and H); two-way repeated measures ANOVA with Holm-Sidak correction for multiple comparisons (D and E).
Figure 4
Figure 4
Higher Cic expression in Purkinje neurons from the anterior cerebellum of SCA1 mice is associated with the repression of key ion channel genes. (A) Quantification of relative expression of Cic mRNA in the anterior cerebellum and nodular zone of ATXN1[82Q] and wild-type cerebella at P35. (B) Quantification of relative expression of Cic protein in the somata of ATXN1[82Q] and wild-type Purkinje neurons at P35, normalized to values from wild-type anterior cerebellum. (C) Representative confocal images taken from ATXN1[82Q] and wild-type Purkinje neurons at P35 after immunostaining for Cic (green) and calbindin (red, to mark Purkinje neurons). (D) Quantification of relative expression of ATXN1 protein in the somata of ATXN1[82Q] and wild-type Purkinje neurons at P35. (E) Representative confocal images taken from ATXN1[82Q] mice at P35 after immunostaining for ATXN1 (green) and calbindin (red, to mark Purkinje neurons). (F and G) qChIP demonstrating the association of Cic and Atxn1 at the promoter of SCA1-associated genes from sonicated chromatin derived from P14 whole cerebellar extracts. Binding, represented as % input (y-axis) demonstrated for Atxn1 (F) and Cic (G) comparing their relative binding on SCA1-associated genes in Atxn1154Q/2Q mice and wild-type controls and binding over background relative to their respective isotype control IgG (rabbit IgG). (H) Log2 transformation of fold change expression demonstrating the role for the ATXN1-Cic complex in the dysregulation of Cacna1g, Itpr1, Kcnma1 and Trpc3. Each column represents a distinct comparison (numbered by column): 1. ATXN1[82Q] relative to wild-type; 2. ATXN1[82Q]V591A;S602D relative to wild-type and 3. ATXN1[82Q]V591A;S602D relative to ATXN1[82Q]. (I) qRT-PCR for Kcnma1, Cacna1g, Itpr1 and Trpc3 from ATXN1[82Q]V591A;S602D and ATXN1[82Q] cerebella. *Denotes P < 0.05; **denotes P < 0.01; ***denotes P < 0.001; ns denotes P > 0.05; two-tailed Student’s t-test (A and C); two tailed-Student’s t-test with Holm-Sidak correction for multiple comparisons (D–I).
Figure 5
Figure 5
Increased Cic expression results in Purkinje neuron hyperexcitability and accelerates Purkinje neuron degeneration. (A) Stereotaxic injection of a lentiviral construct containing mCherry results in widespread expression in lobule IX, but not in lobule X, 10 days after injection. (B) The distribution of regularly firing, irregularly firing and non-firing Purkinje neurons in the nodular zone of ATXN1[82Q] mice at 10 days post-injection with Cic lentivirus or mCherry lentivirus. (C) Representative traces of ATXN1[82Q] Purkinje neuron spiking in the nodular zone at 10 days post-injection with Cic lentivirus or mCherry lentivirus. (D) Quantification of the AHP from ATXN1[82Q] Purkinje neurons in the nodular zone at 10 days post-injection with Cic lentivirus or mCherry lentivirus. (E) Representative images of the nodular zone of ATXN1[82Q] mice at 70 days post-injection with Cic lentivirus or mCherry lentivirus. Yellow box indicates analyzed area of lobule IX. (F) Quantification of molecular layer thickness measurements as illustrated in panel (E). *Denotes P < 0.05; **denotes P < 0.01; Chi square test (B); two-tailed Student’s t-test (F).
Figure 6
Figure 6
Proposed role for Capicua in transcriptional repression of an essential Purkinje neuron ion channel gene module. (A) In healthy, wild-type Purkinje neurons, Capicua (Cic) exerts basal transcriptional repression but allows transcription of key Purkinje neuron ion channel genes. Cav3.1, located on the plasma membrane, and IP3R1, located on the endoplasmic reticulum membrane, act as Ca2+ sources for the BK channel. BK channel activation allows for normal potassium efflux during the action potential, which supports pacemaker firing (right). (B) In SCA1, increased repression of key Purkinje neuron ion channel genes is driven by the interaction between Capicua and polyglutamine-expanded ATXN1. Transcriptional repression results in reduced expression of ion channel proteins, leading to decreased BK channel activity and an inability to support pacemaker firing.

Similar articles

Cited by

References

    1. Saxena S. and Caroni P. (2011) Selective neuronal vulnerability in neurodegenerative diseases: from stressor thresholds to degeneration. Neuron, 71, 35–48. - PubMed
    1. Fu H., Hardy J. and Duff K.E. (2018) Selective vulnerability in neurodegenerative diseases. Nat. Neurosci., 21, 1350–1358. - PMC - PubMed
    1. Orr H.T., Chung M.Y., Banfi S., Kwiatkowski T.J. Jr., Servadio A., Beaudet A.L., McCall A.E., Duvick L.A., Ranum L.P. and Zoghbi H.Y. (1993) Expansion of an unstable trinucleotide CAG repeat in spinocerebellar ataxia type 1. Nat. Genet., 4, 221–226. - PubMed
    1. Rub U., Burk K., Timmann D., Dunnen W., Seidel K., Farrag K., Brunt E., Heinsen H., Egensperger R., Bornemann A. et al. (2012) Spinocerebellar ataxia type 1 (SCA1): new pathoanatomical and clinico-pathological insights. Neuropathol. Appl. Neurobiol., 38, 665–680. - PubMed
    1. Servadio A., Koshy B., Armstrong D., Antalffy B., Orr H.T. and Zoghbi H.Y. (1995) Expression analysis of the ataxin-1 protein in tissues from normal and spinocerebellar ataxia type 1 individuals. Nat. Genet., 10, 94–98. - PubMed

Publication types

MeSH terms