. 2020 Nov;177(22):5224-5245.
doi: 10.1111/bph.15261. Epub 2020 Oct 19.

Arctigenin protects against depression by inhibiting microglial activation and neuroinflammation via HMGB1/TLR4/NF-κB and TNF-α/TNFR1/NF-κB pathways

Affiliations

Arctigenin protects against depression by inhibiting microglial activation and neuroinflammation via HMGB1/TLR4/NF-κB and TNF-α/TNFR1/NF-κB pathways

Xiang Xu et al. Br J Pharmacol. 2020 Nov.

Abstract

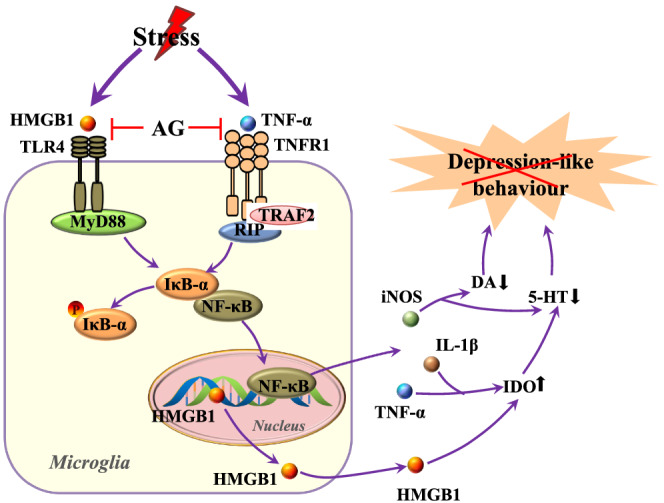
Background and purpose: Arctigenin, a major bioactive component of Fructus arctii, has been reported to have antidepressant-like effects. However, the mechanisms underlying these effects are still unclear. Neuroinflammation can be caused by excessive production of proinflammatory cytokines in microglia via high-mobility group box 1 (HMGB1)/TLR4/NF-κB and TNF-α/TNFR1/NF-κB signalling pathways, leading to depression. In this study, we have investigated the antidepressant mechanism of arctigenin by conducting in vitro and in vivo studies.

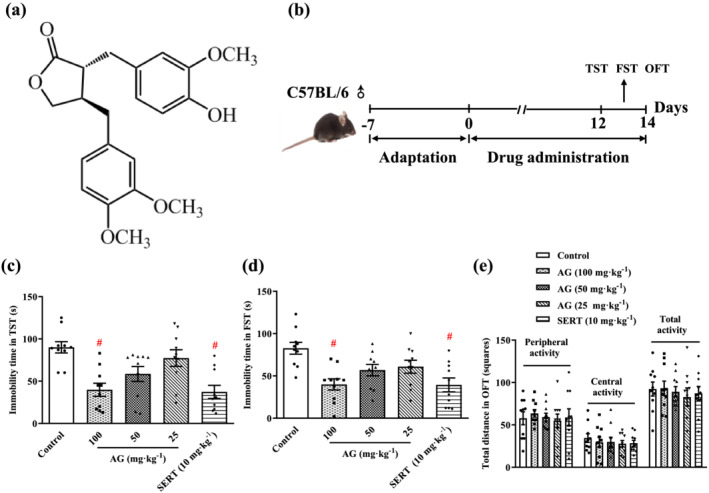
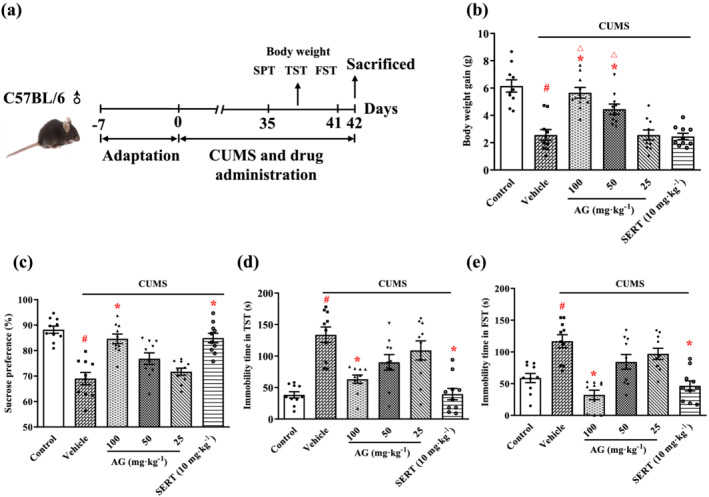
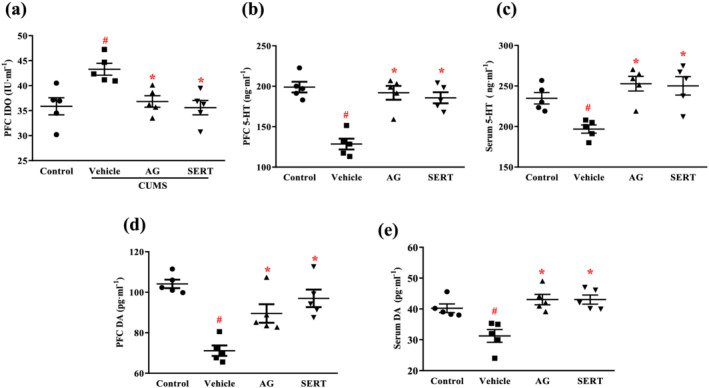
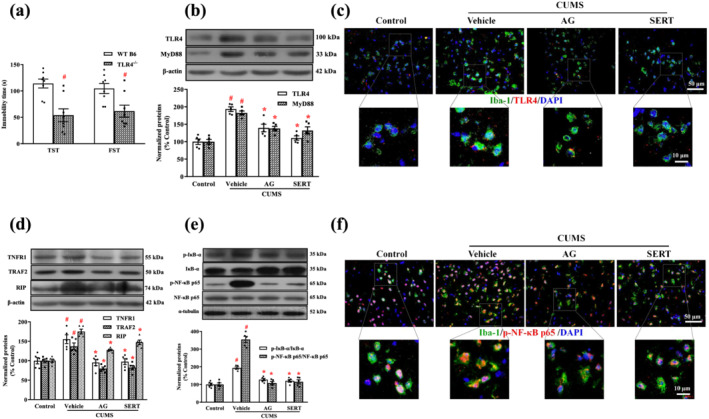
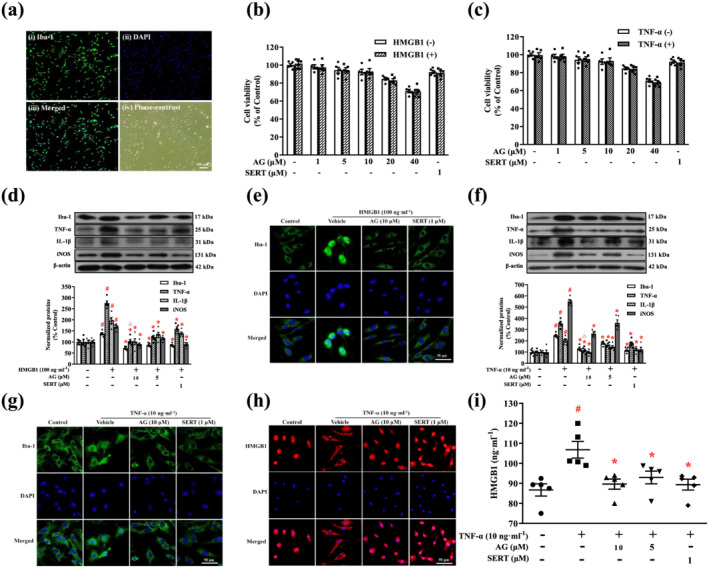
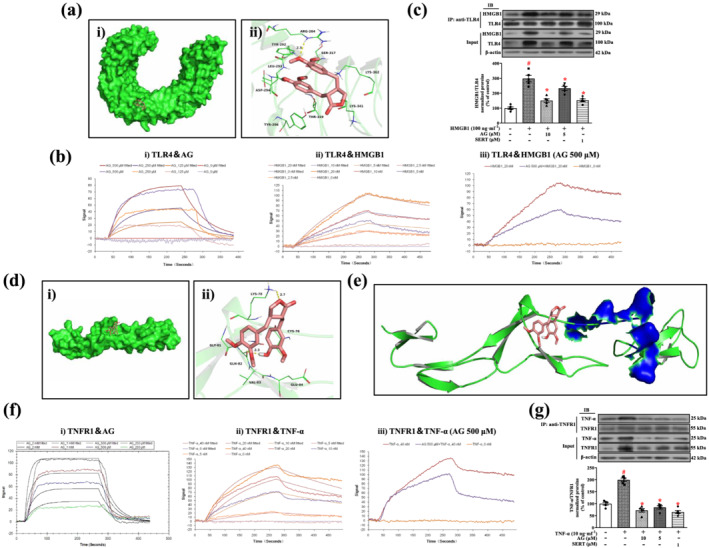
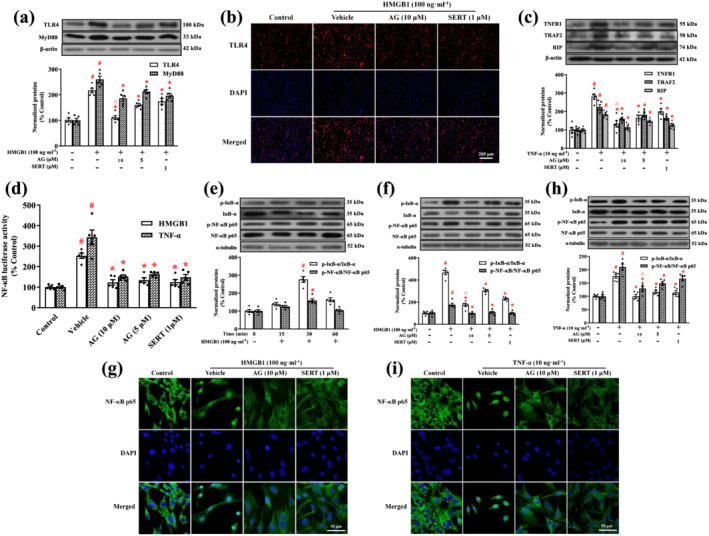
Experimental approach: The effects of chronic unpredictable mild stress (CUMS) on wild-type (WT) and TLR4-/- mice were examined. Antidepressant-like effects of arctigenin were tested using the CUMS-induced model of depression in WT mice. The effects of arctigenin were assessed on the HMGB1/TLR4/NF-κB and TNF-α/TNFR1/NF-κB signalling pathways in the prefrontal cortex (PFC) of mouse brain and HMGB1- or TNF-α-stimulated primary cultured microglia. The interaction between HMGB1 and TLR4 or TNF-α and TNFR1 with or without arctigenin was examined by localized surface plasmon resonance (LSPR) and co-immunoprecipitation assays.

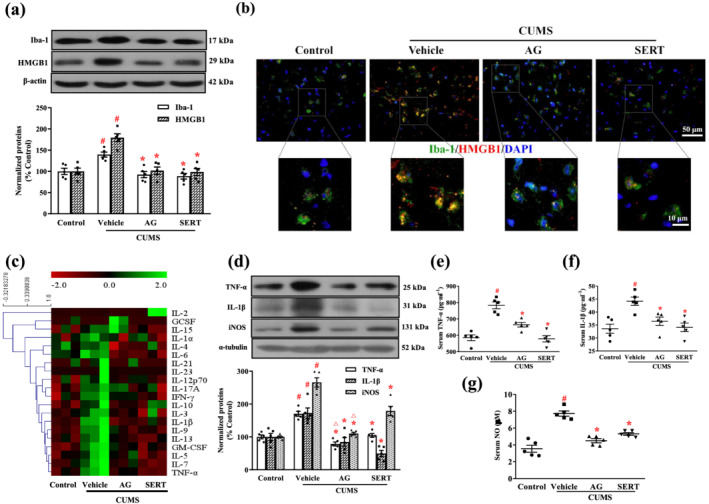
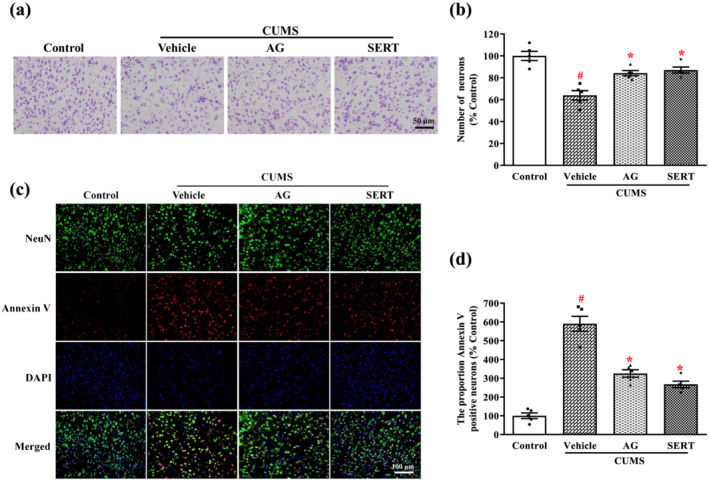
Key results: The immobility times in the tail suspension test (TST) and forced swimming test (FST) were reduced in TLR4-/- mice, compared with WT mice. Arctigenin exhibited antidepressant-like effects. Arctigenin also inhibited microglia activation and inflammatory responses in the PFC of mouse brain. Arctigenin inhibited HMGB1 and TLR4 or TNF-α and TNFR1 interactions, and suppressed both HMGB1/TLR4/NF-κB and TNF-α/TNFR1/NF-κB signalling pathways.

Conclusions and implications: Arctigenin has antidepressant-like effects by attenuating excessive microglial activation and neuroinflammation through the HMGB1/TLR4/NF-κB and TNF-α/TNFR1/NF-κB signalling pathways. This suggests that arctigenin has potential as a new drug candidate suitable for clinical trials to treat depression.

Keywords: HMGB1; TNF-α; antidepressant; arctigenin; microglia; neuroinflammation.


Conflict of interest statement

The authors declare no conflicts of interest.

Figures

FIGURE 1
FIGURE 1
Arctigenin produces antidepressant‐like effects in the TST and FST. (a) The chemical structure of arctigenin. (b) Schematic timeline of experimental procedures. arctigenin (AG; 25, 50, or 100 mg·kg−1) or sertraline (SERT; 10 mg·kg−1) decreased the immobility time in the TST (c) and FST (d) in a dose‐dependent manner. (e) Arctigenin (25, 50, or 100 mg·kg−1) or sertraline (10 mg·kg−1) had no effect on the spontaneous locomotor activity in the OFT. The data are expressed as means ± SEM (n = 10). # P < 0.05, significantly different from control group; one‐way ANOVA followed by post hoc Tukey's test
FIGURE 2
FIGURE 2
Arctigenin reverses depression‐like behaviours in the CUMS‐exposed mice. (a) Schematic timeline of the experimental procedures. (b) Antidepressant‐like effects of arctigenin (AG; 25, 50, or 100 mg·kg−1) or sertraline (SERT; 10 mg·kg−1) on body weight gain of CUMS‐exposed mice. (c) Antidepressant‐like effects of arctigenin (25, 50, or 100 mg·kg−1) or sertraline (10 mg·kg−1) on the SPT of CUMS‐exposed mice. Antidepressant‐like effects of arctigenin (25, 50, or 100 mg·kg−1) or sertraline (10 mg·kg−1) on the TST (d) and FST (e) of CUMS‐exposed mice. The data are expressed as means ± SEM (n = 10). # P < 0.05, significantly different from control group; *P < 0.05, significantly different from vehicle group; P < 0.05, significantly different from sertraline group; one‐way ANOVA followed by post hoc Tukey's test
FIGURE 3
FIGURE 3
Arctigenin suppressed CUMS‐induced microglial activation and production of inflammatory mediators in the PFC or serum of mice. Effects of arctigenin (AG; 100 mg·kg−1) were compared with those of sertraline (SERT; 10 mg·kg−1) given for 6 weeks. (a) Representative western blotting results for Iba‐1 and HMGB1 in the PFC. Protein levels were normalized to the level of β‐actin (n = 5). (b) Representative microscopic images showed double immunohistochemical staining for Iba‐1 (green) and HMGB1 (red) in the PFC. The smaller areas in the square were shown below at higher magnification (n = 5). (c) Heat map of differentially expressed cytokines in the PFC of mice (n = 3). The colour intensity is proportional to the relative expression level (red: underexpressed; green: overexpressed). (d) Representative western blot results. Protein levels were normalized to the level of α‐tubulin (n = 5). (e) The levels of TNF‐α in the serum of mice (n = 5). (f) The levels of IL‐1β in the serum of mice (n = 5). (g) The levels of NO in the serum of mice (n = 5). The data are expressed as means ± SEM. # P < 0.05, significantly different from control group; *P < 0.05, significantly different from vehicle group; P < 0.05, significantly different from sertraline group; one‐way ANOVA followed by post hoc Tukey's test
FIGURE 4
FIGURE 4
Arctigenin suppressed CUMS‐induced neuron damage in the PFC of mice. Arctigenin (AG;100 mg·kg−1) or sertraline (SERT; 10 mg·kg−1) was administered once daily for 6 weeks. (a) Nissl staining was performed on sections of the PFC. Representative photomicrographs of cresyl violet‐stained sections of the PFC were shown. (b) Density analysis revealed that the CUMS‐induced decrease in neurons in the PFC was significantly inhibited by arctigenin or sertraline. Data shown are means ± SEM (n = 5). (c) Representative microscopic images showed double immunohistochemical staining for NeuN (green) and Annexin V (red) in the PFC. (d) Density analysis revealed that the CUMS‐induced increase in the rate of neuronal apoptosis in the PFC was significantly inhibited by arctigenin or sertraline. The data are expressed as means ± SEM (n = 5). # P < 0.05, significantly different from control group; *P < 0.05, significantly different from vehicle group; one‐way ANOVA followed by post hoc Tukey's test
FIGURE 5
FIGURE 5
Arctigenin reversed CUMS‐induced IDO increase and monoamine decrease in the PFC or serum of mice. Arctigenin (AG;100 mg·kg−1) or sertraline (SERT; 10 mg·kg−1) was administered once daily for 6 weeks. (a) The levels of IDO in the PFC of mice. The levels of 5‐HT in the PFC (b) and serum (c) of mice. The levels of dopamine (DA) in the PFC (d) and serum (e) of mice. The data are expressed as means ± SEM (n = 5). # P < 0.05, significantly different from control group; *P < 0.05, significantly different from vehicle group; one‐way ANOVA followed by post hoc Tukey's test
FIGURE 6
FIGURE 6
Arctigenin inhibited CUMS‐induced HMGB1/TLR4/NF‐κB or TNF‐α/TNFR1/NF‐κB signalling pathway in the PFC of mice. Arctigenin (AG;100 mg·kg−1) or sertraline (SERT; 10 mg·kg−1) was administered once daily for 6 weeks. (a) WT B6 and TLR4−/− mice were exposed to CUMS for 6 weeks, and despair behaviours in CUMS‐induced WT B6 and TLR4−/− mice were assessed with the TST and FST. The data are expressed as means ± SEM (n = 8). # P < 0.05, significantly different from WT B6 mice; Student's unpaired t test. (b) The expression of TLR4 and MyD88 was analysed by western blot. The protein levels were normalized to the level of β‐actin (n = 5). (c) Representative microscopic images showed double immunohistochemical staining for Iba‐1 (green) and TLR4 (red) in the PFC. The smaller areas in the square were shown below at higher magnification (n = 5). (d) The expression of TNFR1, TRAF2, and RIP was analysed by western blot. The protein levels were normalized to the level of β‐actin. (e) The total p‐IκB‐α and p‐NF‐κB p65 protein levels in the PFC of mice were analysed by western blot. Each immunoreactive band of the phosphorylated protein was normalized against unphosphorylated protein (n = 5). (f) Representative microscopic images showed double immunohistochemical staining for Iba‐1 (green) and p‐NF‐κB p65 (red) in the PFC. The smaller areas in the square were shown below at higher magnification (n = 5). The data are expressed as means ± SEM. # P < 0.05, significantly different from control group; *P < 0.05, significantly different from vehicle group; one‐way ANOVA followed by post hoc Tukey's test
FIGURE 7
FIGURE 7
Arctigenin inhibited HMGB1‐ or TNF‐α‐stimulated microglial activation and production of inflammatory mediators in microglia. (a) Representative images showing microglial purity. Microglia were fixed and immunostained for Iba‐1 (i). Microglial nuclei were counterstained with DAPI (ii). Merged image of Iba‐1 and DAPI (iii). Phase‐contrast image of microglia (iv). (b, c) Microglia were treated with the indicated concentrations of arctigenin (AG; 0, 1, 5, 10, 20, or 40 μM) or sertraline (SERT; 1 μM) for 12 h prior to treatment with or without HMGB1 (100 ng·ml−1) or TNF‐α (10 ng·ml−1) for 24 h. Cell viability was assessed by MTS assay, and the results are expressed as the ratio, expressed as a percentage, of surviving cells to control cells. (d, f) Representative western blot of Iba‐1, TNF‐α, IL‐1β, and iNOS expression in HMGB1‐ or TNF‐α‐stimulated microglia. The protein levels were normalized to the level of β‐actin. (e, g) Representative microscopic images showed Iba‐1 (green) and DAPI (blue) in HMGB1‐ or TNF‐α‐stimulated microglia. (h) Representative microscopic images showed HMGB1 (red) and DAPI (blue) in TNF‐α‐stimulated microglia. (i) HMGB1 production by TNF‐α‐stimulated microglia was measured by elisa. The data are expressed as means ± SEM (n = 5). # P < 0.05, significantly different from control group; *P < 0.05, significantly different from vehicle group; P < 0.05, significantly different from sertraline group; one‐way ANOVA followed by post hoc Tukey's test
FIGURE 8
FIGURE 8
Arctigenin disrupts the interaction between HMGB1 and TLR4 or TNF‐α and TNFR1. (a) Arctigenin docked into the binding pocket of TLR4, the total view of arctigenin (i), the detailed view of arctigenin (ii). (b) Binding affinities of arctigenin for HMGB1 and TLR4. Arctigenin (AG) directly interacts with TLR4 in a dose‐dependent manner by LSPR (i), HMGB1 directly interacts with TLR4 in a dose‐dependent manner by LSPR (ii), and arctigenin blocked the binding capacity between HMGB1 and TLR4 by LSPR (iii). (c) Primary microglia were pretreated with arctigenin (AG; 5 or 10 μM) and sertraline (SERT; 1 μM) for 12 h, followed by HMGB1 (100 ng·ml−1) stimulation for 24 h; then cell lysates were immunoprecipitated with anti‐TLR4 antibody. HMGB1 and TLR4 were detected on the western blot with anti‐HMGB1 and anti‐TLR4 antibodies after immunoprecipitation with anti‐TLR4 antibody. Western blot analysis with anti‐HMGB1 and anti‐TLR4 antibodies was performed. IP, immunoprecipitation; IB, immunoblot (n = 5). (d) Arctigenin docked into the binding pocket of the TNFR1, the total view of arctigenin (i), the detailed view of arctigenin (ii). (e) Total view of the binding mode between arctigenin and TNFR1. TNFR1 is shown as green cartoon mode. Arctigenin is shown as salmon sticks; the TNF‐α binding sites are shown in blue surface mode. (f) Binding affinities of arctigenin for TNF‐α and TNFR1. Arctigenin directly interacts with TNFR1 in a dose‐dependent manner by LSPR (i), TNF‐α directly interacts with TNFR1 in a dose‐dependent manner by LSPR (ii), and arctigenin blocked the binding capacity between TNF‐α and TNFR1, as assayed by LSPR (iii). (g) Primary microglia were pretreated with arctigenin (AG; 5 or 10 μM) and sertraline (SERT; 1 μM) for 12 h, followed by TNF‐α (10 ng·ml−1) stimulation for 24 h; then cell lysates were immunoprecipitated with anti‐TNFR1 antibody. TNF‐α and TNFR1 were detected by western blot with anti‐TNF‐α and anti‐TNFR1 antibodies after immunoprecipitation with anti‐TNFR1 antibody. Western blot analysis with anti‐TNF‐α and anti‐TNFR1 antibodies was performed. IP, immunoprecipitation; IB, immunoblot (n = 5). The data are expressed as means ± SEM. # P < 0.05, significantly different from control group; *P < 0.05, significantly different from vehicle group; P < 0.05, significantly different from sertraline group; one‐way ANOVA followed by post hoc Tukey's test
FIGURE 9
FIGURE 9
Arctigenin inhibited HMGB1/TLR4/NF‐κB or TNF‐α/TNFR1/NF‐κB signalling pathway in HMGB1‐ or TNF‐α‐stimulated microglia. (a) Expression of TLR4 and MyD88 in HMGB1‐stimulated microglia was assessed by western blot. The protein levels were normalized to the level of β‐actin. (b) Representative immunofluorescence microscopic images showed TLR4 (red) and DAPI (blue) in HMGB1‐stimulated microglia. (c) Expression of TNFR1, TRAF2, and RIP in TNF‐α‐stimulated microglia was assessed by western blot. The protein levels were normalized to the level of β‐actin. (d) Primary microglia were transfected with an NF‐κB luciferase reporter plasmid. After 24 h of transfection, the cells were pretreated with arctigenin (AG; 10 μM) and sertraline (SERT; 1 μM) for 12 h, followed by HMGB1 (100 ng·ml−1) or TNF‐α (10 ng·ml−1) stimulation for 12 h. Luciferase activity was determined by using the Luciferase Assay System. (e) The total p‐IκB‐α and p‐NF‐κB p65 protein levels in HMGB1‐stimulated microglia were assessed for the indicated time by western blot. Each immunoreactive band of the phosphorylated protein was normalized against unphosphorylated protein. (f, h) The total p‐IκB‐α and p‐NF‐κB p65 protein levels in HMGB1‐ or TNF‐α‐stimulated microglia were assessed by western blot. Each immunoreactive band of the phosphorylated protein was normalized against unphosphorylated protein. (g, i) Representative immunofluorescence microscopic images showed NF‐κB p65 (green) and DAPI (blue) in HMGB1‐ or TNF‐α‐stimulated microglia. The data are expressed as means ± SEM (n = 5). # P < 0.05, significantly different from control group; *P < 0.05, significantly different from vehicle group; P < 0.05, significantly different from sertraline group; one‐way ANOVA followed by post hoc Tukey's test
FIGURE 10
FIGURE 10
Arctigenin acts on signalling mechanisms of stress‐induced depression‐like behaviours. Stress activates TLR4 and TNFR1, possibly through HMGB1 and TNF‐α, resulting in the phosphorylation and degradation of IκB‐α, which leads to the nuclear translocation of NF‐κB and the expression of inflammatory mediators. This results in perturbed neurotransmission and neuronal damage, ultimately leading to depression‐like behaviours. Arctigenin (AG) inhibits microglial activation and protects against CUMS‐induced depression‐like behaviours by inhibiting the HMGB1/TLR4/NF‐κB pathway as well as the TNF‐α/TNFR1/NF‐κB signalling pathway. DA, dopamine

References

    1. Akira, S. , & Sato, S. (2003). Toll‐like receptors and their signaling mechanisms. Scandinavian Journal of Infectious Diseases, 35(9), 555–562. 10.1080/00365540310015683 - DOI - PubMed
    1. Alexander, S. P. H. , Kelly, E. , Mathie, A. , Peters, J. A. , Veale, E. L. , Armstrong, J. F. , … CGTP Collaborators . (2019). The Concise Guide to PHARMACOLOGY 2019/20: Introduction and other protein targets. British Journal of Pharmacology, 176(Suppl 1), S1–S20. 10.1111/bph.14747 - DOI - PMC - PubMed
    1. Alexander, S. P. H. , Roberts, R. E. , Broughton, B. R. S. , Sobey, C. G. , George, C. H. , Stanford, S. C. , … Ahluwalia, A. (2018). Goals and practicalities of immunoblotting and immunohistochemistry: A guide for submission to the British Journal of Pharmacology . British Journal of Pharmacology, 175, 407–411. 10.1111/bph.14112 - DOI - PMC - PubMed
    1. Aosai, F. , Chen, M. , Kang, H. K. , Mun, H. S. , Norose, K. , Piao, L. X. , … Yano, A. (2002). Toxoplasma gondii‐derived heat shock protein HSP70 functions as a B cell mitogen. Cell Stress & Chaperones, 7(4), 357–364. 10.1379/1466-1268(2002)007<0357:tgdhsp>2.0.co;2 - DOI - PMC - PubMed
    1. Baud, V. , & Karin, M. (2001). Signal transduction by tumor necrosis factor and its relatives. Trends in Cell Biology, 11(9), 372–377. 10.1016/s0962-8924(01)02064-5 - DOI - PubMed

Publication types