

m6 A RNA methyltransferases METTL3/14 regulate immune responses to anti-PD-1 therapy
- PMID: 32964498
- PMCID: PMC7560214
- DOI: 10.15252/embj.2020104514
m6 A RNA methyltransferases METTL3/14 regulate immune responses to anti-PD-1 therapy
Abstract
An impressive clinical success has been observed in treating a variety of cancers using immunotherapy with programmed cell death-1 (PD-1) checkpoint blockade. However, limited response in most patients treated with anti-PD-1 antibodies remains a challenge, requiring better understanding of molecular mechanisms limiting immunotherapy. In colorectal cancer (CRC) resistant to immunotherapy, mismatch-repair-proficient or microsatellite instability-low (pMMR-MSI-L) tumors have low mutation burden and constitute ~85% of patients. Here, we show that inhibition of N6 -methyladenosine (m6 A) mRNA modification by depletion of methyltransferases, Mettl3 and Mettl14, enhanced response to anti-PD-1 treatment in pMMR-MSI-L CRC and melanoma. Mettl3- or Mettl14-deficient tumors increased cytotoxic tumor-infiltrating CD8+ T cells and elevated secretion of IFN-γ, Cxcl9, and Cxcl10 in tumor microenvironment in vivo. Mechanistically, Mettl3 or Mettl14 loss promoted IFN-γ-Stat1-Irf1 signaling through stabilizing the Stat1 and Irf1 mRNA via Ythdf2. Finally, we found a negative correlation between METTL3 or METTL14 and STAT1 in 59 patients with pMMR-MSI-L CRC tumors. Altogether, our findings uncover a new awareness of the function of RNA methylation in adaptive immunity and provide METTL3 and METTL14 as potential therapeutic targets in anticancer immunotherapy.
Keywords: CD8+ T cells; colorectal carcinoma; immunotherapy; m6A methylation.
© 2020 The Authors. Published under the terms of the CC BY NC ND 4.0 license.
Conflict of interest statement
T.M.R. is a founder of ViRx Pharmaceuticals and has an equity interest in the company. The terms of this arrangement have been reviewed and approved by the University of California San Diego in accordance with its conflict of interest policies.
Figures
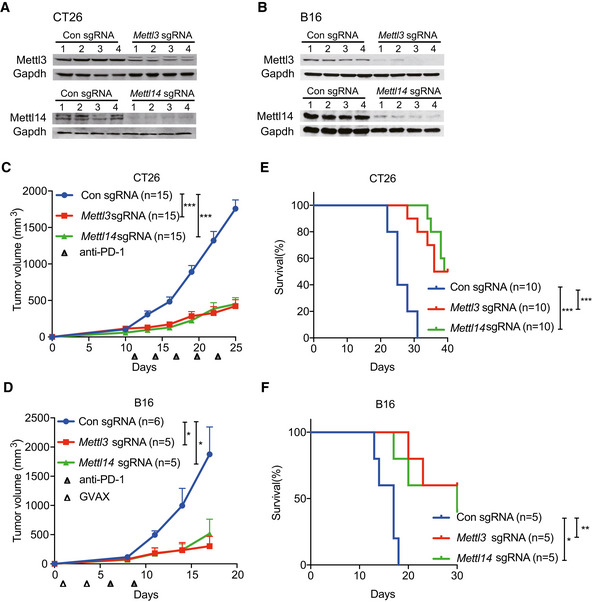
- A, B
Immunoblotting were performed to validate Mettl3 or Mettl14 expression levels in CT26 and B16 cells as indicated. Gapdh served as a loading control.
- C, D
Tumor volume was monitored for control and Mettl3‐ or Mettl14‐depleted tumors with treatment as indicated in CT26 colon cancer and B16 melanoma, respectively. Data are mean ± SEM of the indicated number of mice in each group. n, the numbers of mice. *P < 0.05; ***P < 0.001 by Student's t‐tests.
- E, F
Survival analysis of control tumors and those with depleted genes were recorded as indicated in CT26 colon cancer and B16 melanoma, respectively. Data are mean ± SEM of the indicated number of mice in each group. n, the numbers of mice. *P < 0.05; **P < 0.01; ***P < 0.001 by Student's t‐tests.
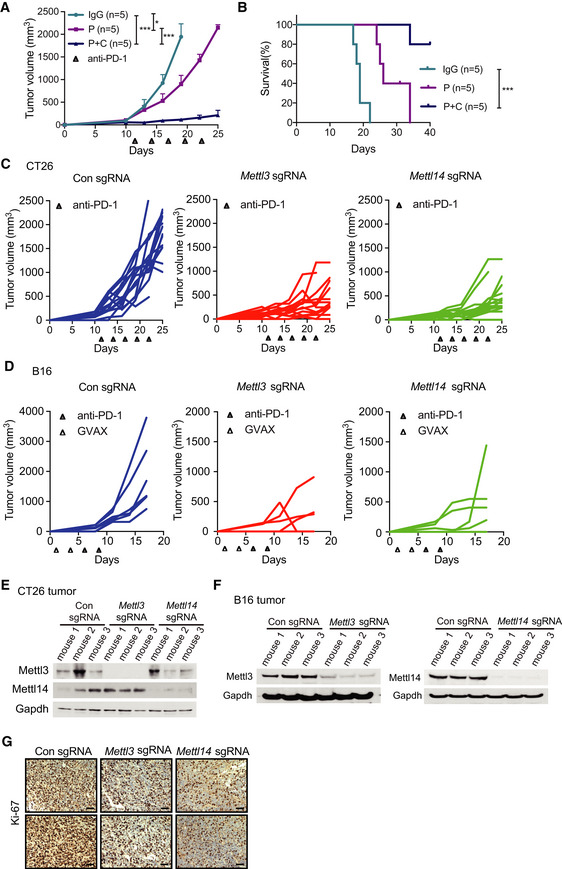
- A
CT26 tumor volume was measured from tumor‐bearing mice treated with IgG (IgG control), P (anti‐PD-1 antibody), and P plus C (anti‐CTLA-4 antibody) therapeutic modalities. n, the numbers of mice. Data are mean ± SEM of the indicated number of mice. *P < 0.05; ***P < 0.001 by Student's t‐tests.
- B
Survival analysis after various treatments of mice bearing CT26 tumors. n, the numbers of mice. Data are mean ± SEM of the indicated number of mice. ***P < 0.001 by Student's t‐tests.
- C, D
C57BL/6J or BALB/c mice bearing control and Mettl3‐ or Mettl14‐depleted tumors (C, CT26; D, B16) were treated with various therapeutic modalities as indicated. Tumor volume was recorded over time as indicated. Each line represents one mouse.
- E, F
Immunoblots of Mettl3 and Mettl14 were carried out in the indicated CT26 and B16 mouse tumors in triplicates with Gapdh as a loading control.
- G
Representative images of Ki‐67 were stained by IHC analysis. Tissue sections from BALB/c mice bearing the indicated knockout of genes with treatment of PD1 antibody. Scale bars, 50 μm.
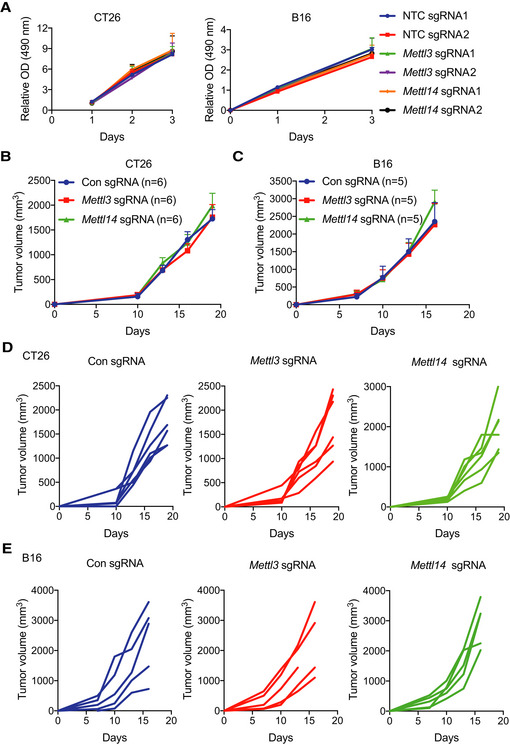
- A
Cell proliferation was assessed in knockout of Mettl3, Mettl14, and non‐targeting control (NTC) CT26 and B16 cells using MTS assay in vitro. Mean ± SD of n = 3.
- B, C
Tumor growth of xenografts from CT26 and B16 cells with Mettl3‐ or Mettl14‐depleted genes and control as indicated. n, the numbers of mice. Data are mean ± SEM of the indicated number of mice.
- D, E
Tumor growth from C57BL/6J or BALB/c mice with control and Mettl3 or Mettl14‐depleted tumors (D, CT26; E, B16). Tumor volume was recorded over time as indicated. Each line represents one mouse.
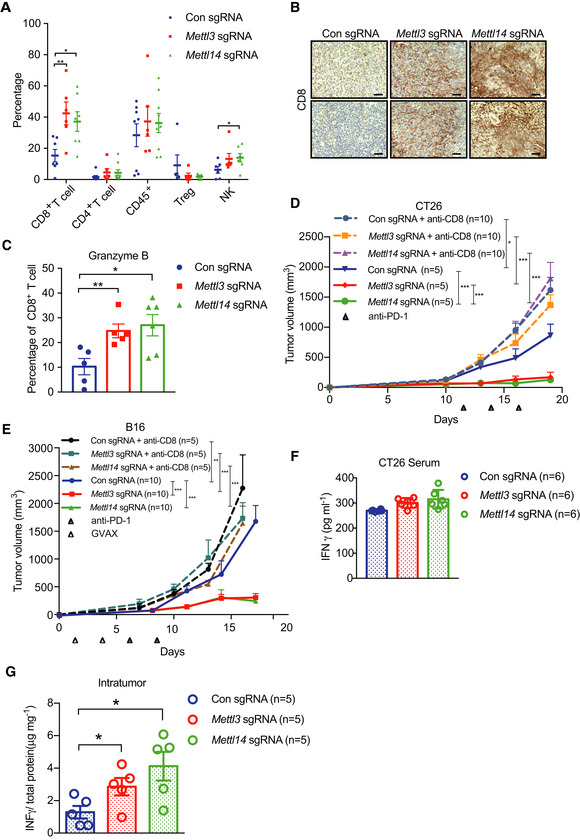
- A
Percentage of tumor‐infiltrating T cells, Treg, and NK cells were identified by flow cytometry from CT26 tumors as indicated. Each spot represents one mouse. *P < 0.05; **P < 0.01 by Student's t‐tests.
- B
Representative images of CD8 by IHC staining. Tissue sections from BALB/c mice bearing the indicated knockout of genes with treatment of PD1 antibody. Scale bars, 50 μm.
- C
Percentage of granzyme B‐expressing CD8+ T cells from control and Mettl3‐ or Mettl14‐deficient CT26 tumors. Each spot represents one mouse. *P < 0.05; **P < 0.01 by Student's t‐tests.
- D, E
Mice bearing control and Mettl3 or Mettl14 null tumors were treated with CD8‐depleting antibody and PD‐1 antibody or PD‐1/GVAX as indicated. Tumor volume was measured over time points. n, the numbers of mice. *P < 0.05; **P < 0.01; ***P < 0.001 by Student's t‐tests.
- F, G
IFN‐γ production in serum (F) and intratumor (G) from BALB/c mice by ELISA. The results are representatives of at least three independent experiments. n, the numbers of mice. Data are mean ± SEM. *P < 0.05 by Student's t‐tests.
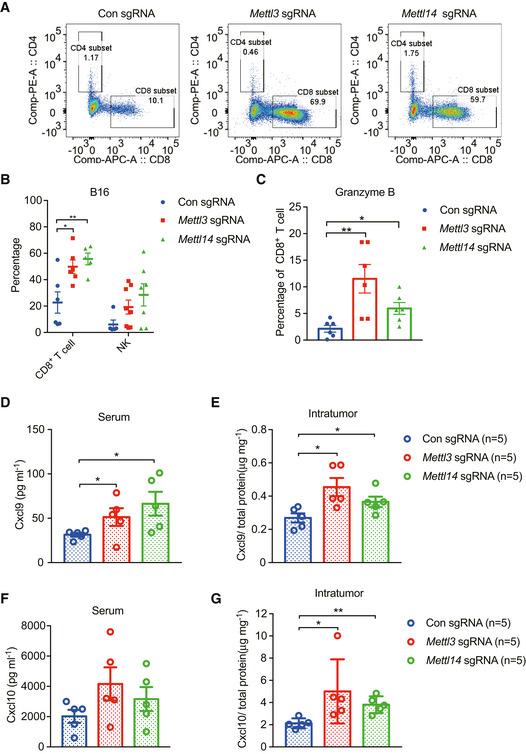
Representative examples for CD8+ T cells from FACS analyses in CT26 tumors.
Percentage of tumor‐infiltrating CD8+ T cells and NK cells were analyzed from control and Mettl3‐ or Mettl14‐deficient B16 tumors using flow cytometry. Each spot represents one mouse. Data are mean ± SEM of the indicated number of mice. *P < 0.05; **P < 0.01 by Student's t‐tests.
Percentage of granzyme B‐expressing CD8+ T cells from B16 tumors as indicated. Each spot represents one mouse. *P < 0.05; **P < 0.01 by Student's t‐tests.
Secretion of Cxcl9 in serum from the indicated BALB/c mice by ELISA. Each spot represents one mouse. *P < 0.05 by Student's t‐tests.
Intratumoral Cxcl9 concentration were determined by ELISA in the indicated CT26 tumor extracts and then calculated by the total protein concentration. Each spot represents one mouse. n, the numbers of mice. *P < 0.05 by Student's t‐tests.
Secretion of Cxcl10 in serum from the indicated BALB/c mice by ELISA. Each spot represents one mouse.
Intratumoral Cxcl10 concentration were determined by ELISA in the indicated CT26 tumor extracts and then calculated by the total protein concentration. Each spot represents one mouse. n, the numbers of mice. *P < 0.05; **P < 0.01 by Student's t‐tests.
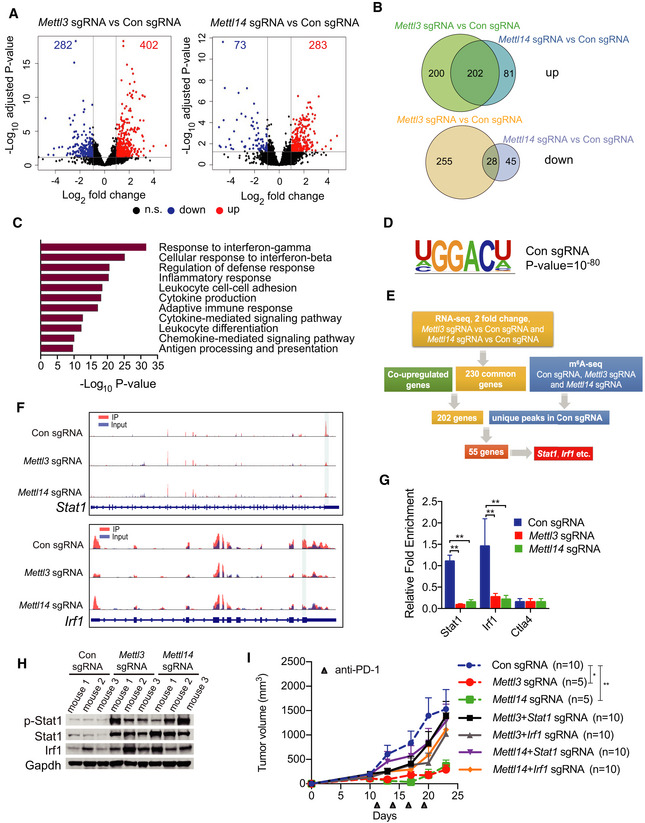
Volcano plot of differentially expressed genes obtained by DESeq2 analysis in Mettl3 or Mettl14 null tumors compared to control tumors. Significantly upregulated or downregulated genes are plotted in red and blue points, respectively. n.s, non‐significant.
Venn diagrams showing 202 significantly co‐upregulated genes and 28 significantly co‐downregulated genes in the indicated tumors.
Meta‐enrichment analysis summary for 202 significantly co‐upregulated genes as indicated in (C).
Consensus m6A motifs and P value identified by HOMER from two biological replicates, Student's t‐tests.
Schematic workflow for analysis of Mettl3 and Mettl14 downstream genes and identified genes or peaks number.
Representative genes with m6A sites generated by integrative genomics viewer. Data are representative of duplicates with similar results. Red represents reads coverage of IP sample and blue represents reads coverage of input sample. Rectangular cyan shade represents the m6A peaks located on transcripts.
m6A enrichment of Stat1 and Irf1 was examined by m6A RIP‐qPCR in control, Mettl3‐, or Mettl14‐depleted CT26 tumors as indicated. Ctla4 functioned as a m6A negative control (Wang et al, 2019). Data are mean ± SD. **P < 0.01 by Student's t‐tests.
Immunoblots of p‐Stat1 (phosphorylated), Stat1, and Irf1 were carried out in the indicated tumors in triplicate with Gapdh as a loading control.
Tumor growth from CT26 cells with Mettl3‐, Mettl14‐, Mettl3/Stat1‐, Mettl3/Irf1-, Mettl14/Stat1‐, or Mettl14/Irf1‐depleted genes and control under treatment of PD‐1 antibody as indicated. n, the numbers of mice. Data are mean ± SEM of the indicated number of mice in each group. *P < 0.05; **P < 0.01 by Student's t‐tests.
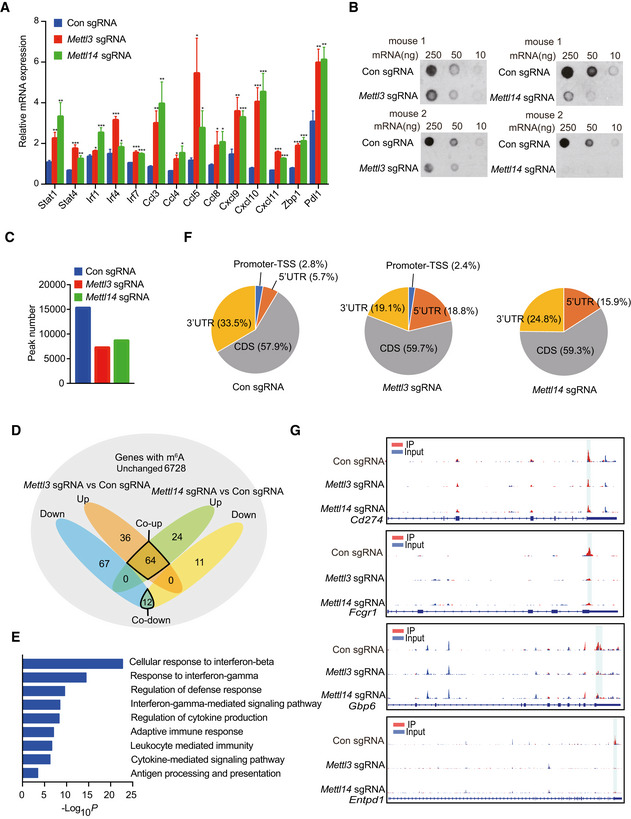
Transcriptional analysis of the indicated genes identified from the RNA‐seq data using quantitative RT–PCR. mRNA levels in Mettl3‐ or Mettl14‐deficient tumors are presented as the relative fold change compared to control sgRNA tumor. The mean ± SD of five replicates is shown. *P < 0.05; **P < 0.01; ***P < 0.001 by Student's t‐tests.
Dot blot of the total m6A levels in mRNA extracted from Mettl3‐ or Mettl14‐depleted and control tumors.
Number of consensus m6A peaks identified from two biological replicates in the indicated tumors.
Venn diagram of upregulated m6A containing genes, downregulated m6A containing genes, and common m6A genes without expression level changes as indicated. Orange shade represents upregulated m6A containing genes from Mettl3‐depleted tumors compared to control, blue shade represents downregulated m6A containing genes from Mettl3‐depleted tumors compared to control. Green shade represents upregulated m6A containing genes from Mettl14‐depleted tumors compared to control, yellow shade represents downregulated m6A containing genes from Mettl14‐depleted tumors compared to control. Gray shade represents common m6A genes without any changes from Mettl3‐ and Mettl14‐depleted tumors compared to control.
GO analysis was performed on 64 co‐upregulated m6A containing genes from D as indicated.
Distribution of m6A peaks in the indicated tumors. Pie charts show the proportion of m6A peaks in the 5′‐UTR (orange), CDS (gray), 3′‐UTR (yellow), and promoter‐TSS (blue).
Representative genes with m6A sites generated by integrative genomics viewer. Blue represents reads coverage of input sample and red represents reads coverage of IP sample. Rectangular cyan shade represents the m6A peaks located on transcripts.
- A, B
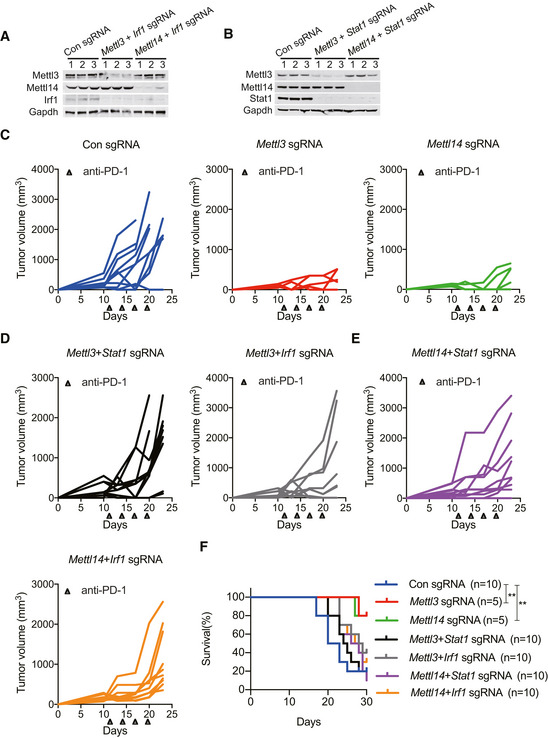
Immunoblot analysis of the protein levels of Mettl3, Mettl14, Irf1, and Stat1 in CT26 cells as indicated. Gapdh served as a control.
- C–E
Tumor growth in BALB/c mice bearing the lacking indicated genes treated with PD‐1 antibody. Each line represents one mouse.
- F
Survival analysis of tumors with the lacking indicated genes and control were observed in CT26 colon cancer. n, the numbers of mice. Data are mean ± SEM of the indicated number of mice in each group. **P < 0.01 by Student's t‐tests.
- A
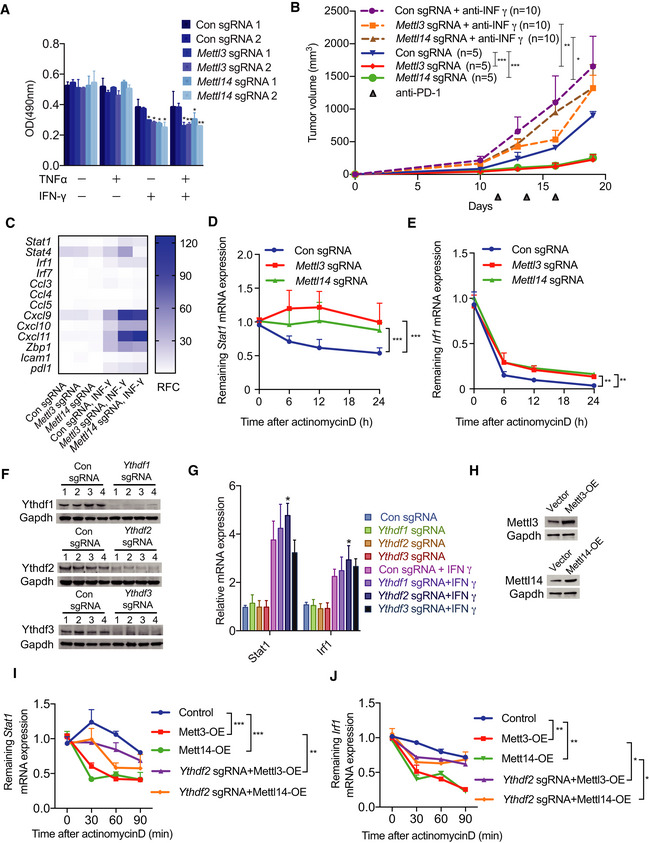
Cellular proliferation analysis of Mettl3‐ or Mettl14‐depleted and control CT26 cells treated with indicated combinations of cytokines for 48 h. The mean ± SD of three replicates is shown. *P < 0.05; **P < 0.01 by Student's t‐tests.
- B
BALB/c mice bearing Mettl3‐ or Mettl14‐deficient and control tumors were treated with IFNγ‐blocking antibody and PD‐1 antibody as indicated. Tumor size was measured over time. n, the numbers of mice. Data are mean ± SEM of the indicated number of mice. *P < 0.05; **P < 0.01; ***P < 0.001 by Student's t‐tests.
- C
Quantitative RT–PCR was performed to identify transcriptional changes of the IFN‐γ response gene expression (n = 3). Data are shown as the relative fold change (RFC, color coded bar).
- D, E
mRNA stability of Stat1 and Irf1 were measured by qRT–PCR in tumor cells treated with IFN‐γ and actinomycin D. Mean ± SD of n = 3. **P < 0.01; ***P < 0.001 by Student's t‐tests.
- F
Validation the effect of knockout of Ythdf1‐3 using Western blotting, Gapdh served as a loading control.
- G
qPCR analysis of Stat1 and Irf1's expression in the indicated depletion of CT26 cells with/without stimulation of IFN‐γ. Mean ± SD of n = 3. *P < 0.05 by Student's t‐tests.
- H
Western blot analysis of Mettl3 and Mettl14 in overexpressed CT26 cells. Gapdh served as a loading control for each.
- I, J
qPCR analysis of the mRNA stability of Stat1 and Irf1 in the indicated CT26 cells treated with IFN‐γ and actinomycin D. Mean ± SD of n = 3. *P < 0.05; **P < 0.01; ***P < 0.001 by Student's t‐tests.
- A, B
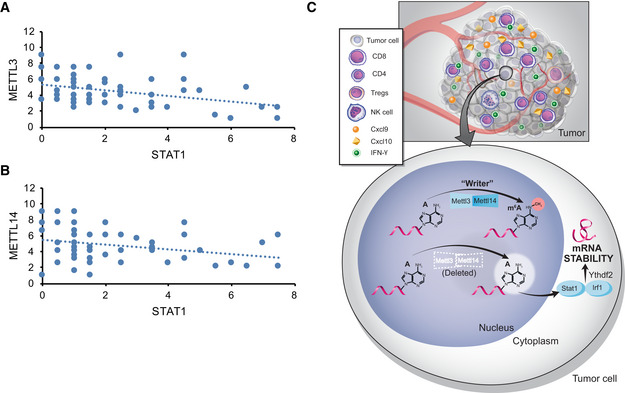
The protein level of STAT1 was negatively correlated with METTL3 and METTL14 in human pMMR‐MSI-L CRC colon tissues (r 2 = −3.2477 for METTL3, r 2 = −2.7491 for METTL14). Each dot represents one tumor tissue.
- C
Schematic showing the functional and molecular mechanisms of Mettl3 and Mettl14 in antitumor immunotherapy.
Similar articles
-
Targeting METTL3 as a checkpoint to enhance T cells for tumour immunotherapy.Clin Transl Med. 2024 Nov;14(11):e70089. doi: 10.1002/ctm2.70089. Clin Transl Med. 2024. PMID: 39568154 Free PMC article.
-
METTL14 regulates CD8+T-cell activation and immune responses to anti-PD-1 therapy in lung cancer.World J Surg Oncol. 2024 May 10;22(1):128. doi: 10.1186/s12957-024-03402-9. World J Surg Oncol. 2024. PMID: 38725005 Free PMC article.
-
METTL3 Inhibition Restores PD-L1 Expression and CD8+ T-cell Cytotoxic Function in Immunotherapy-Treated Gastric Cancer.Cancer Immunol Res. 2025 Jul 2;13(7):1037-1052. doi: 10.1158/2326-6066.CIR-24-1179. Cancer Immunol Res. 2025. PMID: 40299705
-
Is There a Role for Programmed Death Ligand-1 Testing and Immunotherapy in Colorectal Cancer With Microsatellite Instability? Part II-The Challenge of Programmed Death Ligand-1 Testing and Its Role in Microsatellite Instability-High Colorectal Cancer.Arch Pathol Lab Med. 2018 Jan;142(1):26-34. doi: 10.5858/arpa.2017-0041-RA. Epub 2017 Nov 9. Arch Pathol Lab Med. 2018. PMID: 29120224 Review.
-
The Potential Value of Immunotherapy in Colorectal Cancers: Review of the Evidence for Programmed Death-1 Inhibitor Therapy.Clin Colorectal Cancer. 2016 Dec;15(4):285-291. doi: 10.1016/j.clcc.2016.07.007. Epub 2016 Jul 22. Clin Colorectal Cancer. 2016. PMID: 27553906 Review.
Cited by
-
The crucial roles of N6-methyladenosine (m6A) modification in the carcinogenesis and progression of colorectal cancer.Cell Biosci. 2021 Apr 9;11(1):72. doi: 10.1186/s13578-021-00583-8. Cell Biosci. 2021. PMID: 33836813 Free PMC article. Review.
-
Role of RNA N6-Methyladenosine Modification in Male Infertility and Genital System Tumors.Front Cell Dev Biol. 2021 May 19;9:676364. doi: 10.3389/fcell.2021.676364. eCollection 2021. Front Cell Dev Biol. 2021. PMID: 34124065 Free PMC article. Review.
-
Targeting the RNA m6A modification for cancer immunotherapy.Mol Cancer. 2022 Mar 16;21(1):76. doi: 10.1186/s12943-022-01558-0. Mol Cancer. 2022. PMID: 35296338 Free PMC article. Review.
-
YTHDF2 orchestrates tumor-associated macrophage reprogramming and controls antitumor immunity through CD8+ T cells.Nat Immunol. 2023 Feb;24(2):255-266. doi: 10.1038/s41590-022-01398-6. Epub 2023 Jan 19. Nat Immunol. 2023. PMID: 36658237 Free PMC article.
-
Small-molecule PTPN2 Inhibitors Sensitize Resistant Melanoma to Anti-PD-1 Immunotherapy.Cancer Res Commun. 2023 Jan 24;3(1):119-129. doi: 10.1158/2767-9764.CRC-21-0186. eCollection 2023 Jan. Cancer Res Commun. 2023. PMID: 36968224 Free PMC article.
References
Publication types
MeSH terms
Substances
Associated data
- Actions
Grants and funding
LinkOut - more resources
Full Text Sources
Medical
Molecular Biology Databases
Research Materials
Miscellaneous
