Tumor heterogeneity estimation for radiomics in cancer
- PMID: 32964647
- PMCID: PMC8244619
- DOI: 10.1002/sim.8749
Tumor heterogeneity estimation for radiomics in cancer
Abstract
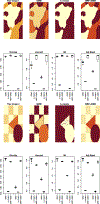
Radiomics is an emerging field of medical image analysis research where quantitative measurements are obtained from radiological images that can be utilized to predict patient outcomes and inform treatment decisions. Cancer patients routinely undergo radiological evaluations when images of various modalities including computed tomography, positron emission tomography, and magnetic resonance images are collected for diagnosis and for evaluation of disease progression. Tumor characteristics, often referred to as measures of tumor heterogeneity, can be computed using these clinical images and used as predictors of disease progression and patient survival. Several approaches for quantifying tumor heterogeneity have been proposed, including intensity histogram-based measures, shape and volume-based features, and texture analysis. Taking into account the topology of the tumors we propose a statistical framework for estimating tumor heterogeneity using clustering based on Markov random field theory. We model the voxel intensities using a Gaussian mixture model using a Gibbs prior to incorporate voxel neighborhood information. We propose a novel approach to choosing the number of mixture components. Subsequently, we show that the proposed procedure outperforms the existing approaches when predicting lung cancer survival.
Keywords: Markov random fields; cancer imaging; computed tomography; image segmentation; machine learning.
© 2020 John Wiley & Sons Ltd.
Figures


Similar articles
-
Plausibility and redundancy analysis to select FDG-PET textural features in non-small cell lung cancer.Med Phys. 2021 Mar;48(3):1226-1238. doi: 10.1002/mp.14684. Epub 2021 Feb 6. Med Phys. 2021. PMID: 33368399 Free PMC article.
-
Robust imaging habitat computation using voxel-wise radiomics features.Sci Rep. 2021 Oct 11;11(1):20133. doi: 10.1038/s41598-021-99701-2. Sci Rep. 2021. PMID: 34635786 Free PMC article.
-
Radiomics-based features for pattern recognition of lung cancer histopathology and metastases.Comput Methods Programs Biomed. 2018 Jun;159:23-30. doi: 10.1016/j.cmpb.2018.02.015. Epub 2018 Feb 27. Comput Methods Programs Biomed. 2018. PMID: 29650315
-
Update on quantitative radiomics of pancreatic tumors.Abdom Radiol (NY). 2022 Sep;47(9):3118-3160. doi: 10.1007/s00261-021-03216-3. Epub 2021 Jul 22. Abdom Radiol (NY). 2022. PMID: 34292365 Review.
-
A narrative review of radiomics and deep learning advances in neuroblastoma: updates and challenges.Pediatr Radiol. 2023 Dec;53(13):2742-2755. doi: 10.1007/s00247-023-05792-6. Epub 2023 Nov 10. Pediatr Radiol. 2023. PMID: 37945937 Review.
Cited by
-
radioGWAS links radiome to genome to discover driver genes with somatic mutations for heterogeneous tumor image phenotype in pancreatic cancer.Sci Rep. 2024 May 29;14(1):12316. doi: 10.1038/s41598-024-62741-5. Sci Rep. 2024. PMID: 38811597 Free PMC article.
-
Artificial intelligence-driven radiomics study in cancer: the role of feature engineering and modeling.Mil Med Res. 2023 May 16;10(1):22. doi: 10.1186/s40779-023-00458-8. Mil Med Res. 2023. PMID: 37189155 Free PMC article. Review.
-
Radiomic Analysis of Magnetic Resonance Imaging for Breast Cancer with TP53 Mutation: A Single Center Study.Diagnostics (Basel). 2025 Feb 10;15(4):428. doi: 10.3390/diagnostics15040428. Diagnostics (Basel). 2025. PMID: 40002579 Free PMC article.
-
Comparative Analysis of Repeatability in CT Radiomics and Dosiomics Features under Image Perturbation: A Study in Cervical Cancer Patients.Cancers (Basel). 2024 Aug 18;16(16):2872. doi: 10.3390/cancers16162872. Cancers (Basel). 2024. PMID: 39199643 Free PMC article.
-
Multiparametric MRI Radiomics for the Early Prediction of Response to Chemoradiotherapy in Patients With Postoperative Residual Gliomas: An Initial Study.Front Oncol. 2021 Nov 18;11:779202. doi: 10.3389/fonc.2021.779202. eCollection 2021. Front Oncol. 2021. PMID: 34869030 Free PMC article.
References
-
- Aerts H, Rios Velazquez E, Leijenaar RT, Parmar C, Grossmann P, Carvalho S, and Lambin P. Data from nsclc-radiomics. Cancer Imaging Archive, 2015.
-
- Andersen PK and Gill RD. Cox’s regression model for counting processes: a large sample study. The annals of statistics, pages 1100–1120, 1982.
-
- Binder H, Allignol A, Schumacher M, and Beyersmann J. Boosting for high-dimensional time-to-event data with competing risks. Bioinformatics, 25(7):890–896, 2009. - PubMed
-
- Binder H, Benner A, Bullinger L, and Schumacher M. Tailoring sparse multivariable regression techniques for prognostic single-nucleotide polymorphism signatures. Statistics in medicine, 32(10):1778–1791, 2013. - PubMed
Publication types
MeSH terms
Grants and funding
LinkOut - more resources
Full Text Sources
Medical
