. 2020 Sep 21;19(10):e13239.
doi: 10.1111/acel.13239. Online ahead of print.

Klotho overexpression improves amyloid-β clearance and cognition in the APP/PS1 mouse model of Alzheimer's disease

Affiliations

Klotho overexpression improves amyloid-β clearance and cognition in the APP/PS1 mouse model of Alzheimer's disease

Yue Zhao et al. Aging Cell. .

Abstract

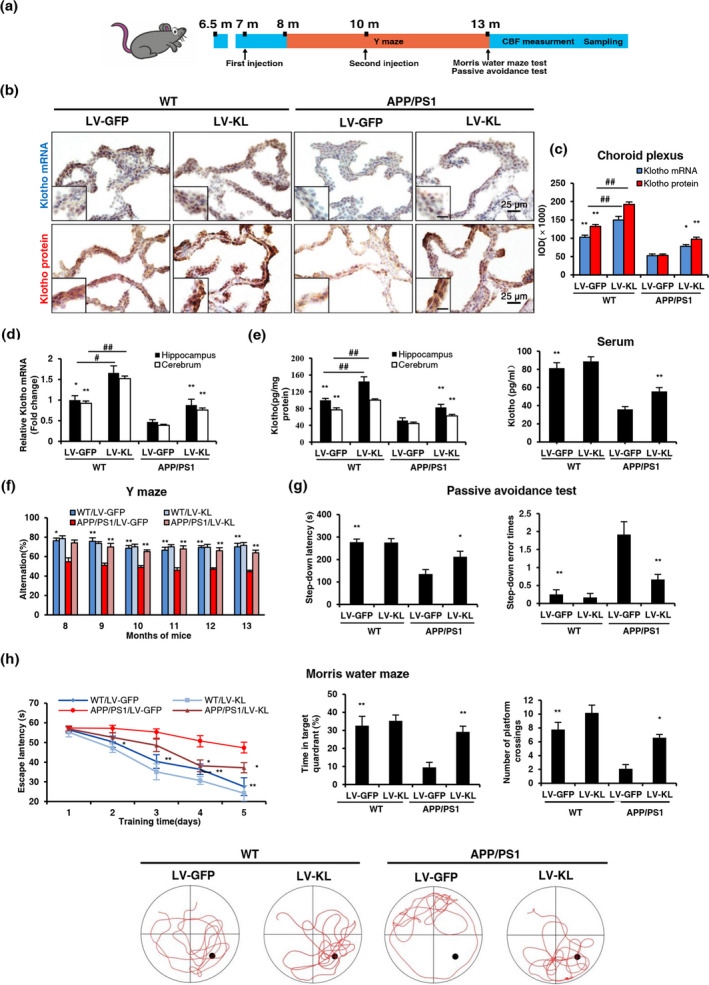
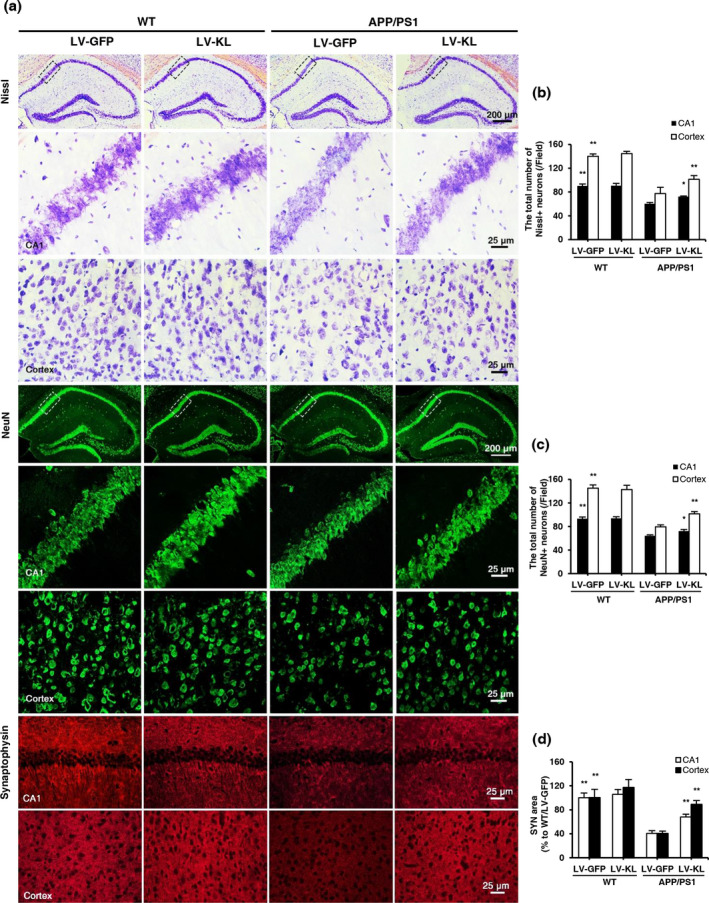
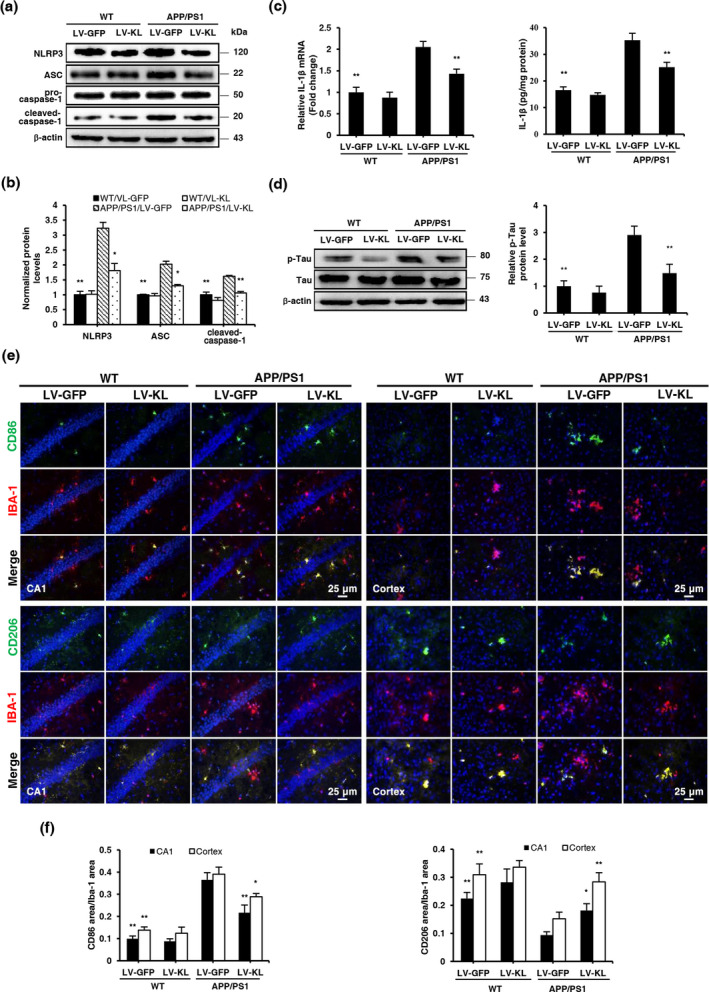
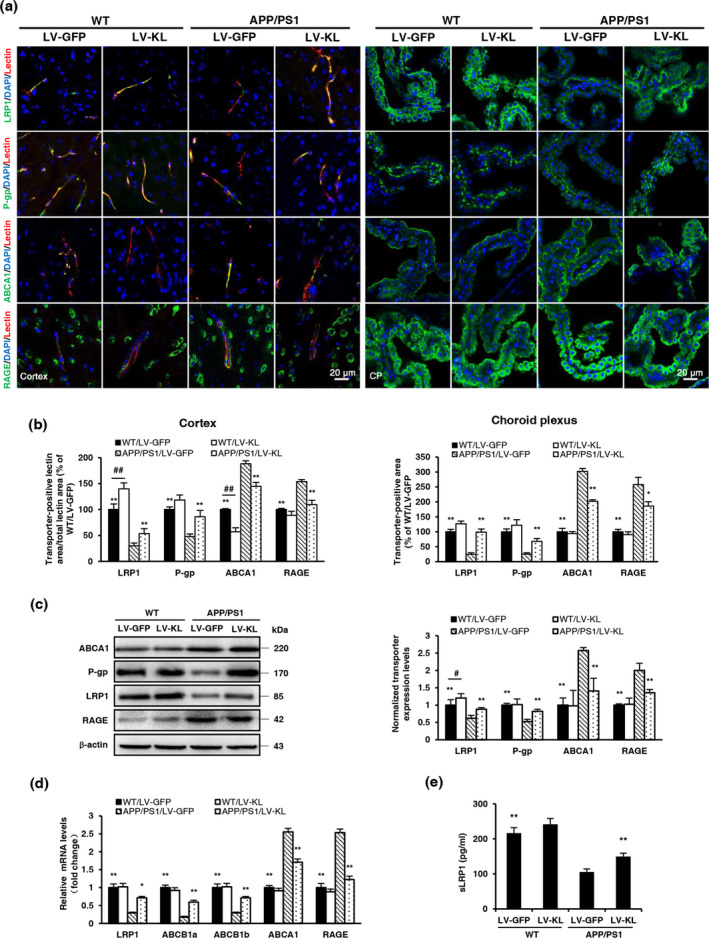
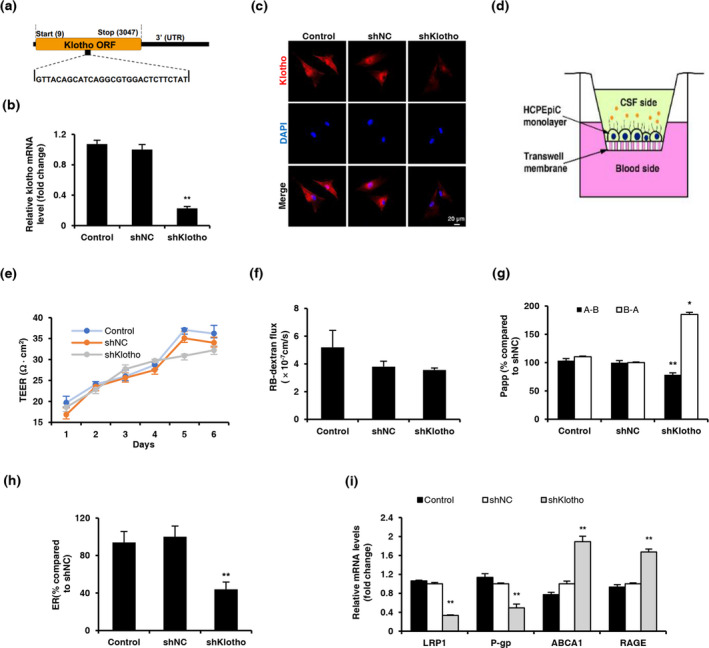
Alzheimer's disease (AD) is the most prevalent type of dementia, characterized by the presence of amyloid-β (Aβ) plaques. We previously reported that Klotho lowered Aβ levels in the brain and protected against cognitive deficits in amyloid precursor protein/presenilin 1(APP/PS1) mice. However, the underlying mechanism remains unclear. In this study, we induced intracerebral Klotho overexpression in 13-month-old APP/PS1 mice by injecting lentivirus that carried full-length mouse Klotho cDNA in the lateral ventricle of the brain. We examined the effects of Klotho overexpression on cognition, Aβ burden, Aβ-related neuropathology, microglia transformation, and Aβ transport systems in vivo. Additionally, we investigated the effects of Klotho on Aβ transport at the blood-cerebrospinal fluid barrier by knocking down Klotho in primary human choroid plexus epithelial cells (HCPEpiCs). The upregulation of Klotho levels in the brain and serum significantly ameliorated Aβ burden, neuronal and synaptic loss and cognitive deficits in aged APP/PS1 mice. Klotho treatment significantly inhibited NACHT, LRR, and PYD domain-containing protein 3 (NLRP3) and the subsequent transformation of microglia to the M2 type that may enhance microglia-mediated Aβ clearance. Meanwhile, Klotho overexpression also regulated Aβ transporter expression, which may promote Aβ transporter-mediated Aβ clearance. Moreover, the ability of HCPEpiCs to transport Aβ in vitro was also significantly impaired by Klotho knockdown. Given the neuroprotective effect of Klotho overexpression, the present findings suggest that Klotho should be further investigated as a potential therapeutic target for AD.

Keywords: Alzheimer's disease; Aβ clearance; Klotho.


Conflict of interest statement

The authors declare no conflict of interests.

Figures

FIGURE 1
FIGURE 1
Klotho overexpression attenuated cognitive impairment in aged APP/PS1 mice. (a) Temporal schematic diagram of the experimental procedures. (b) Representative images of Klotho mRNA and protein levels in the choroid plexus, detected by in situ hybridization and immunohistochemistry, respectively. The inset shows representative overall staining intensity. Scale bar = 10 μm. (c) Quantitative image analysis of Klotho mRNA and protein levels based on the integrated optical density (IOD) of positive immunostaining (brown). (d) Analysis of Klotho mRNA levels in the hippocampus and cerebrum by quantitative real‐time polymerase chain reaction (qRT‐PCR). Relative Klotho mRNA levels were normalized to GAPDH and are expressed as fold changes relative to the WT/LV‐GFP group. (e) Klotho levels in the hippocampus, cerebrum and serum were measured by enzyme‐linked immunosorbent assay (ELISA). (f) Percentage of alternation in the Y‐maze test. (g) Latency and number of errors in the passive avoidance test. (h) Escape latency, time in the target quadrant, number of platform crossings, and characteristic swimming trails in the Morris water maze. n = 12/group, except n = 6/group in (d, e). The data are expressed as mean ± standard error of mean (SEM). The statistical analysis was performed using two‐way analysis of variance (ANOVA) and mixed‐design ANOVA (f, escape latencies in h) followed by the Bonferroni‐Holm post hoc test. *< 0.05, **p < 0.01, vs. APP/PS1/LV‐GFP group; ## p < 0.01, vs. WT/LV‐GFP group
FIGURE 2
FIGURE 2
Klotho overexpression reduced Aβ burden in aged APP/PS1 mice. (a) The distribution of amyloid plaques was detected using Thioflavine‐S staining and Aβ1‐42 monoclonal antibody in the hippocampus and cortex. (b) Quantitative image analysis of amyloid plaque accumulation based on Thioflavine‐S‐positive and Aβ1‐42‐positive fluorescence area in the hippocampus and cortex. The data are expressed as each normalized value relative to the APP/PS1/LV‐GFP group. (c) Levels of soluble and insoluble Aβ1‐40 and Aβ1‐42 in brain homogenates, measured by ELISA. (d) Serum levels of Aβ1‐40 and Aβ1‐42, measured by ELISA. (e) Representative images of cerebral amyloid angiopathy (CAA), revealed by double‐stained vessels (Laminin, green; aggregated Aβ peptide, Congo red). (f) Quantitative image analysis of CAA load in the total cerebral cortex area. (g) Cerebral blood flow (CBF) in the cortex. n = 6/group, except n = 12 in (g). The data are expressed as mean ± SEM. The statistical analysis was performed using two‐way ANOVA followed by the Bonferroni‐Holm post hoc test. *p < 0.05, **p < 0.01, vs. APP/PS1/LV‐GFP group
FIGURE 3
FIGURE 3
Klotho overexpression alleviated neuronal injury in the brain in aged APP/PS1 mice. (a) Representative images of Nissl staining, NeuN, and synaptophysin immunofluorescent staining in the hippocampal CA1 area and cortex. (b) Quantitative analysis of the number of Nissl‐positive neurons in the hippocampal CA1 area and cortex. (c) Quantitative analysis of the number of NeuN‐positive neurons in the hippocampal CA1 area and cortex. (d) Quantitative analysis of the synaptophysin (SYN)‐positive area in the hippocampal CA1 area and cortex. n = 6/group. The data are expressed as mean ± SEM. The statistical analysis was performed using two‐way ANOVA followed by the Bonferroni‐Holm post hoc test. **p < 0.01, vs. APP/PS1/LV‐GFP group
FIGURE 4
FIGURE 4
Klotho overexpression promoted microglial transformation and alleviated Tau pathology in the brain in aged APP/PS1 mice. (a, b) Representative Western blotting and quantification of NLRP3, ASC, cleaved caspase‐1, and β‐actin in brain tissues. The amount of NLRP3, ASC, and cleaved caspase‐1 were normalized to β‐actin. (c) Analyses of IL‐1β mRNA levels and protein concentrations in brain homogenates by qRT‐PCR and ELISA, respectively. Relative mRNA levels of IL‐1β were normalized to GAPDH and are expressed as fold changes relative to the WT/LV‐GFP group. (d) Representative Western blotting and quantification of p‐Tau and Tau in brain tissues. The amount of p‐Tau was normalized to Tau. (e) Representative images of CD86 and CD206 (green) counterstained with Iba‐1 (red) and nuclear DNA staining of DAPI (blue) in the hippocampal CA1 area and cortex. (f) Quantitative image analysis of CD86/Iba‐1 and CD206/Iba‐1 expression based on positive fluorescence area in the hippocampal CA1 area and cerebral cortex. The data are expressed as each normalized value relative to the WT/LV‐GFP group. n = 6/group, except n = 4/group in (a, b, d). The data are expressed as mean ± SEM. The statistical analysis was performed using two‐way ANOVA followed by the Bonferroni‐Holm post hoc test. *< 0.05, **p < 0.01, vs. APP/PS1/LV‐GFP group
FIGURE 5
FIGURE 5
Klotho overexpression affected the expression levels of Aβ transporters in aged APP/PS1 mice. (a) Representative immunofluorescence images of Aβ transporters (green) in the cortex (left) and choroid plexus (right), including low‐density lipoprotein receptor‐related protein 1 (LRP1), P‐glycoprotein (P‐gp), ATP‐binding cassette transporter A1 (ABCA1), and receptor for advanced glycation end products (RAGE). The lectin‐positive area (red) indicates micro‐vessels. Nuclei were stained with DAPI (blue). (b) Quantitative analysis of the levels of Aβ transporters in micro‐vessels and the choroid plexus. (c) Representative Western blotting and quantification of the relative protein levels of LRP1, P‐gp, ABCA1, and RAGE in brain tissue homogenates. Protein levels were normalized to GAPDH and are expressed as fold changes relative to the WT/LV‐GFP group. (d) Analyses of LRP1, P‐gp, ABCA1, and RAGE mRNA levels in brain tissue homogenates by qRT‐PCR. Relative mRNA levels were normalized to GAPDH and are expressed as fold changes relative to the WT/LV‐GFP group. (e) Soluble LRP1 (sLRP1) levels in serum, measured by ELISA. n = 6/group, except n = 4/group in (c). The data are expressed as mean ± SEM. The statistical analysis was performed using two‐way ANOVA followed by the Bonferroni‐Holm post hoc test. *< 0.05, **p < 0.01, vs. APP/PS1/LV‐GFP group; # p < 0.05, ## p < 0.01, vs. WT/LV‐GFP group
FIGURE 6
FIGURE 6
Klotho knockdown decreased the active transport of Aβ across the human blood–CSF barrier in an in vitro model. (a) Schematic representation of the location of the shRNA target within the Klotho coding sequence (shKlotho). (b) Analysis of Klotho mRNA levels in primary human choroid plexus epithelial cells (HCPEpiCs) infected with shKlotho or shNC at a multiplicity of infection (MOI) of 80. Relative mRNA levels were normalized to β‐actin and are expressed as fold changes relative to shNC‐treated cells. (c) Representative confocal images of Klotho (red) in HCPEpiCs, examined by immunofluorescence 5 days after infection. Nuclear DNA was stained with DAPI (blue). (d) Paradigm for the in vitro model of the human blood–cerebrospinal fluid barrier (BCSFB), consisting of a monolayer of HCPEpiCs. (e) Transepithelial electrical resistance (TEER) measured after seeding across the BCSFB monolayer. (f) Permeability of HCPEpiCs monolayer to 1 mg/ml RB‐dextran. (g) Bidirectional transfer of 0.5 μM FITC‐Aβ1‐42 across the BCSFB monolayer from the basolateral to apical side (B → A) and from the apical to basolateral side (A → B). (h) FITC‐Aβ1‐42 efflux rate across the BCSFB monolayer. The data were normalized to shNC‐treated cells. (i) Analyses of LRP1, P‐gp, ABCA1, and RAGE mRNA levels in primary human choroid plexus epithelial cells by qRT‐PCR. The data were normalized to β‐actin and are expressed as fold changes relative to shNC‐treated cells. The data are from three independent experiments and are expressed as mean ± SEM. *< 0.05, **p < 0.01, vs. shNC‐treated cells. Cells that were incubated in epithelial cell medium without vectors were used as the normal control. The statistical analysis was performed using one‐way ANOVA followed by the LSD test. Kruskal–Wallis test was used when variance was uneven

References

    1. Ahn, K. C. , Learman, C. R. , Dunbar, G. L. , Maiti, P. , Jang, W. C. , Cha, H. C. , & Song, M. S. (2018). Characterization of impaired cerebrovascular structure in APP/PS1 mouse brains. Neuroscience, 385, 246–254. 10.1016/j.neuroscience.2018.05.002 - DOI - PubMed
    1. Baluchnejadmojarad, T. , Eftekhari, S.‐M. , Jamali‐Raeufy, N. , Haghani, S. , Zeinali, H. , & Roghani, M. (2017). The anti‐aging protein klotho alleviates injury of nigrostriatal dopaminergic pathway in 6‐hydroxydopamine rat model of Parkinson's disease: Involvement of PKA/CaMKII/CREB signaling. Experimental Gerontology, 100, 70–76. 10.1016/j.exger.2017.10.023 - DOI - PubMed
    1. Bian, A. , Neyra, J. A. , Zhan, M. , & Hu, M. C. (2015). Klotho, stem cells, and aging. Clinical Interventions in Aging, 10, 1233–1243. 10.2147/CIA.S84978 - DOI - PMC - PubMed
    1. Cai, Z. , Liu, N. , Wang, C. , Qin, B. , Zhou, Y. , Xiao, M. , … Zhao, B. (2016). Role of RAGE in Alzheimer's disease. Cellular and Molecular Neurobiology, 36(4), 483–495. 10.1007/s10571-015-0233-3 - DOI - PMC - PubMed
    1. Chiu, C. , Miller, M. C. , Caralopoulos, I. N. , Worden, M. S. , Brinker, T. , Gordon, Z. N. , … Silverberg, G. D. (2012). Temporal course of cerebrospinal fluid dynamics and amyloid accumulation in the aging rat brain from three to thirty months. Fluids and Barriers of the CNS, 9(1), 3 10.1186/2045-8118-9-3 - DOI - PMC - PubMed

LinkOut - more resources