. 2020 Nov 1;124(5):1415-1448.
doi: 10.1152/jn.00753.2019. Epub 2020 Sep 23.

Situating the left-lateralized language network in the broader organization of multiple specialized large-scale distributed networks

Affiliations

Situating the left-lateralized language network in the broader organization of multiple specialized large-scale distributed networks

Rodrigo M Braga et al. J Neurophysiol. .

Abstract

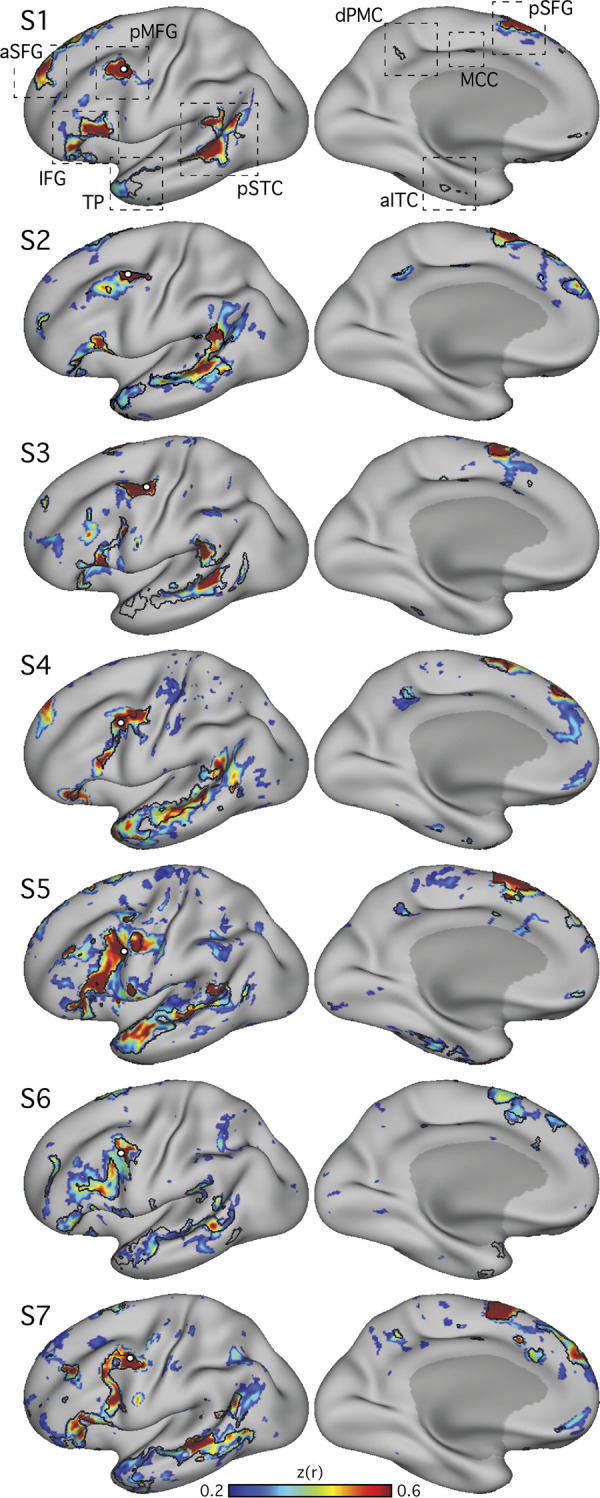
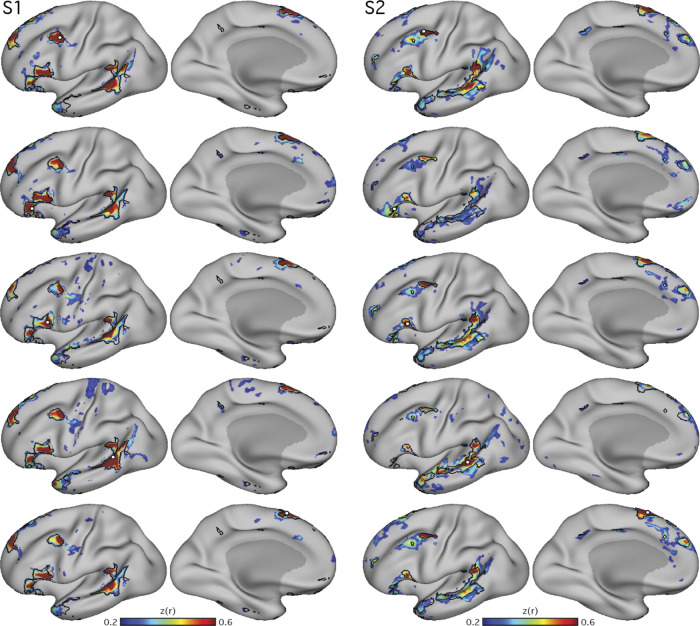
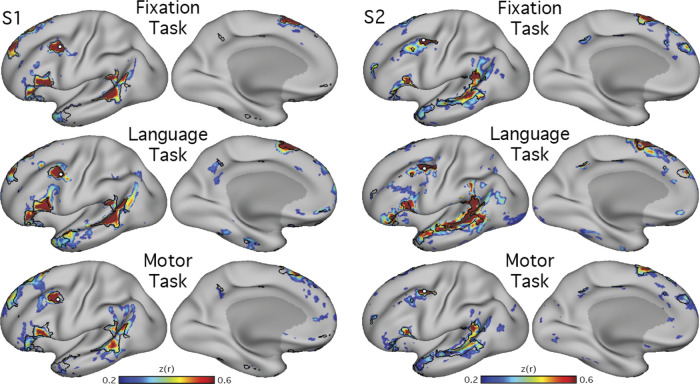
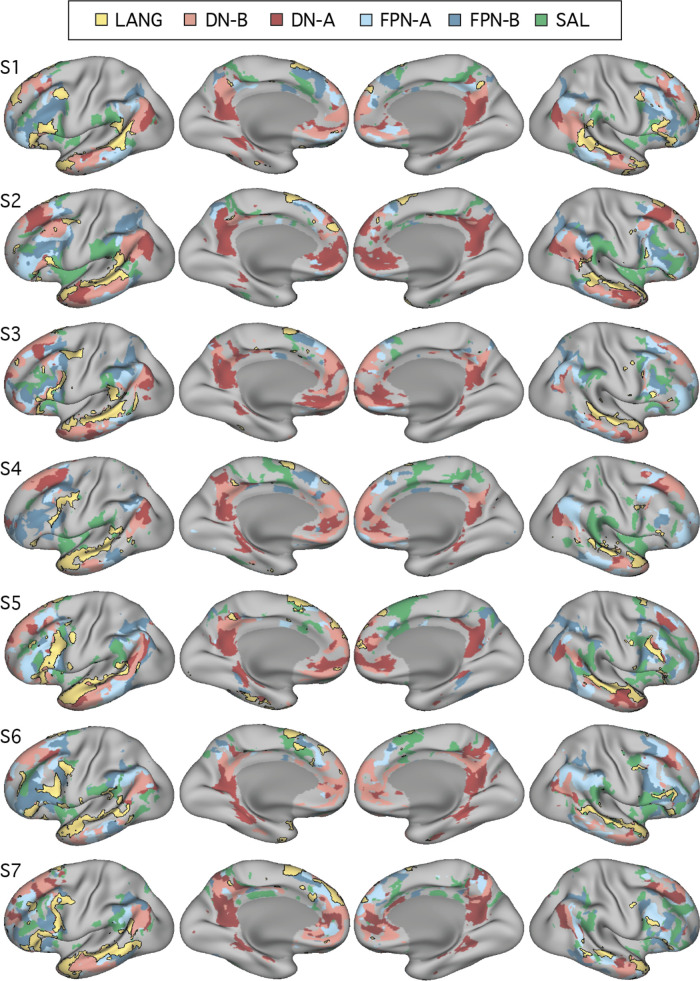
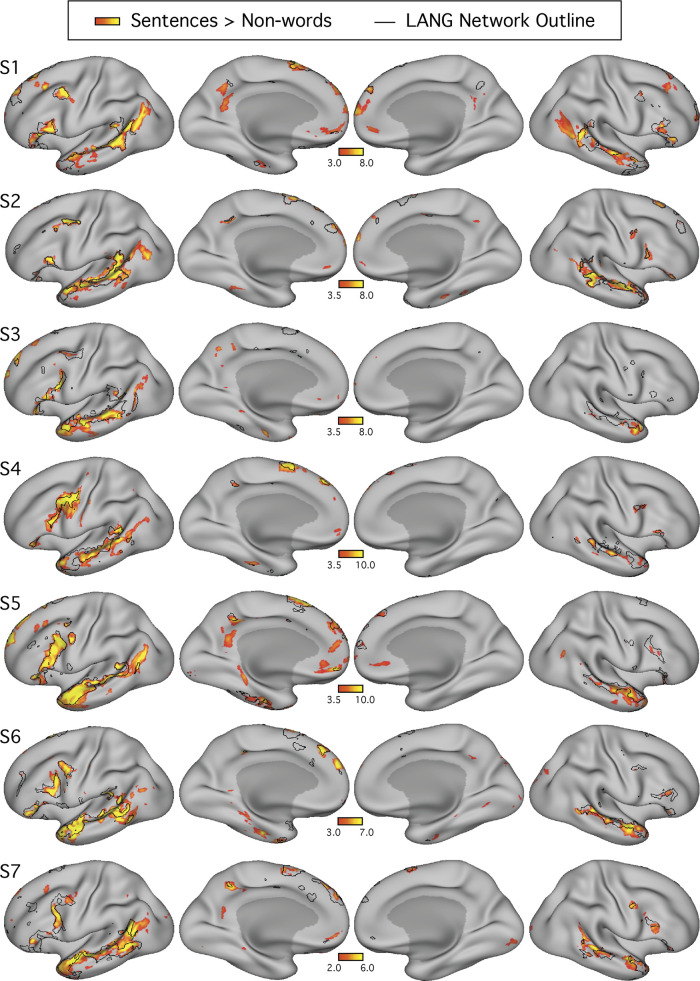
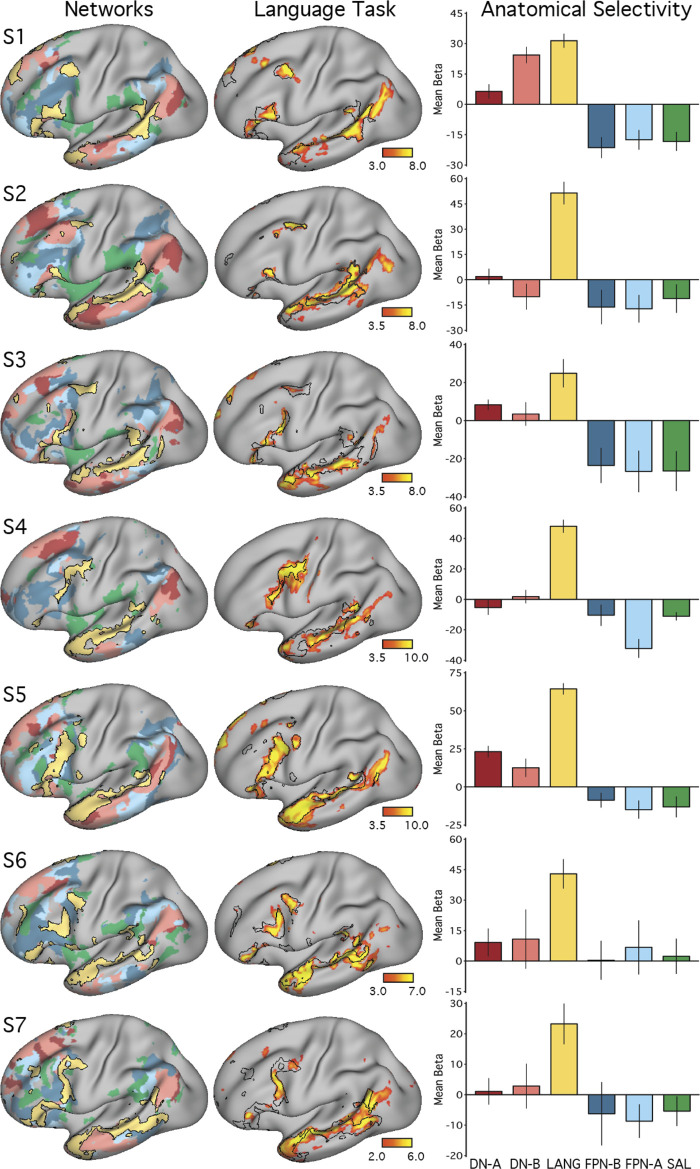
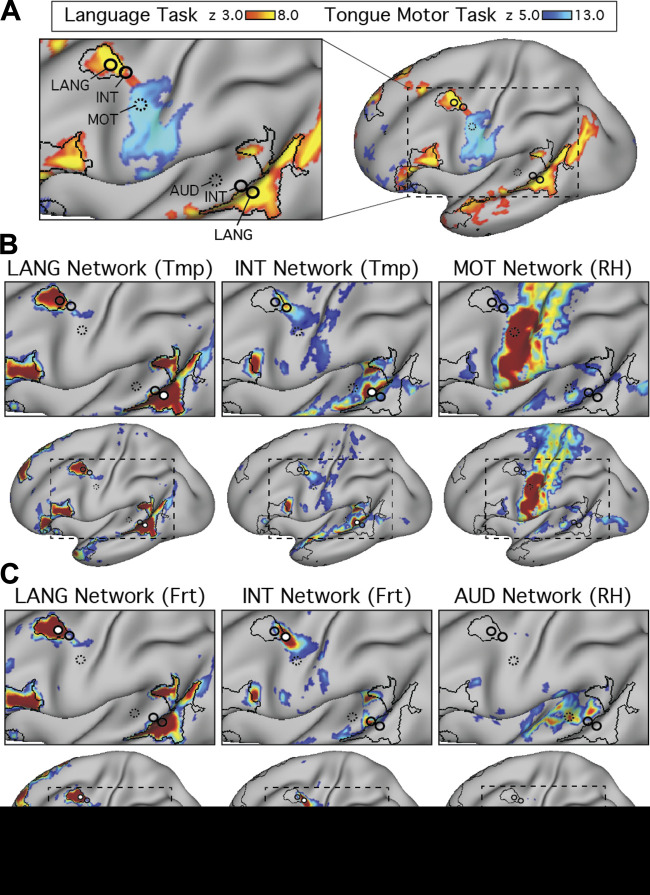
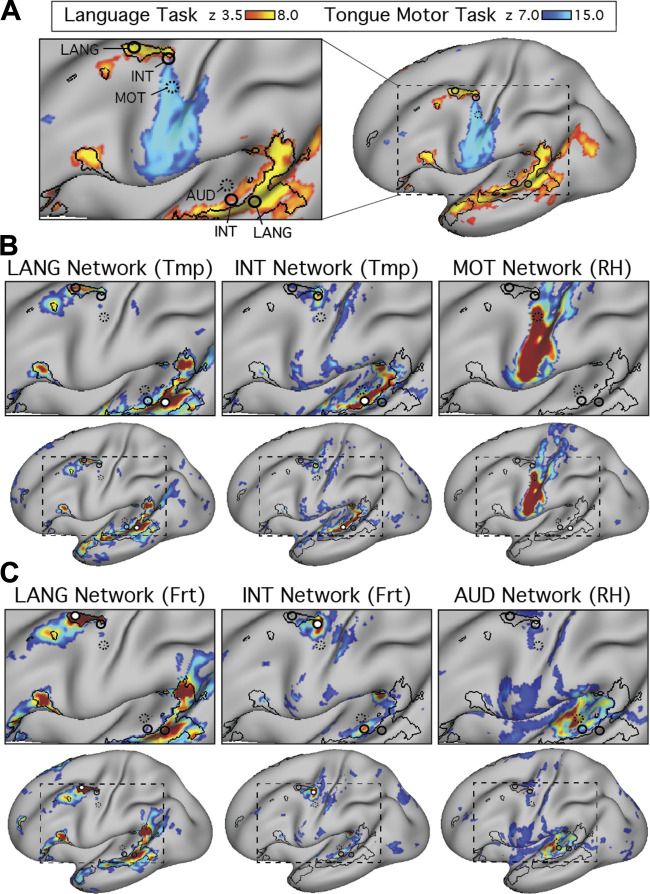
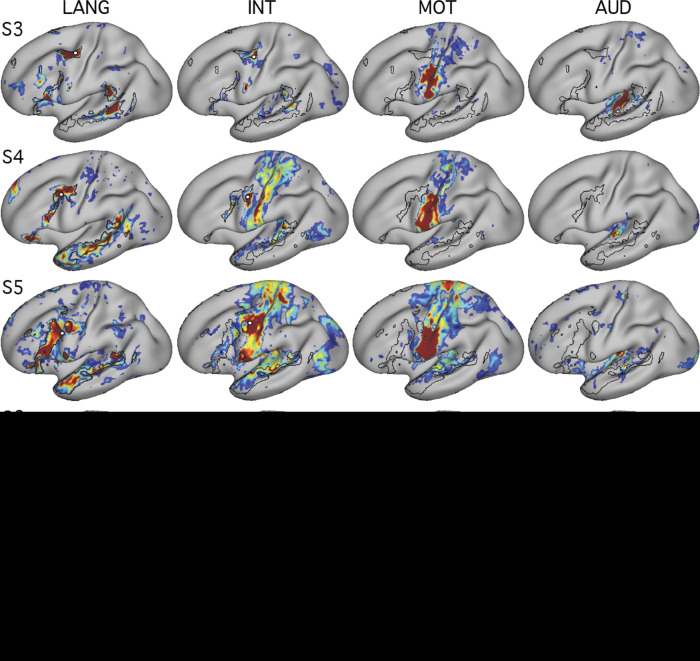
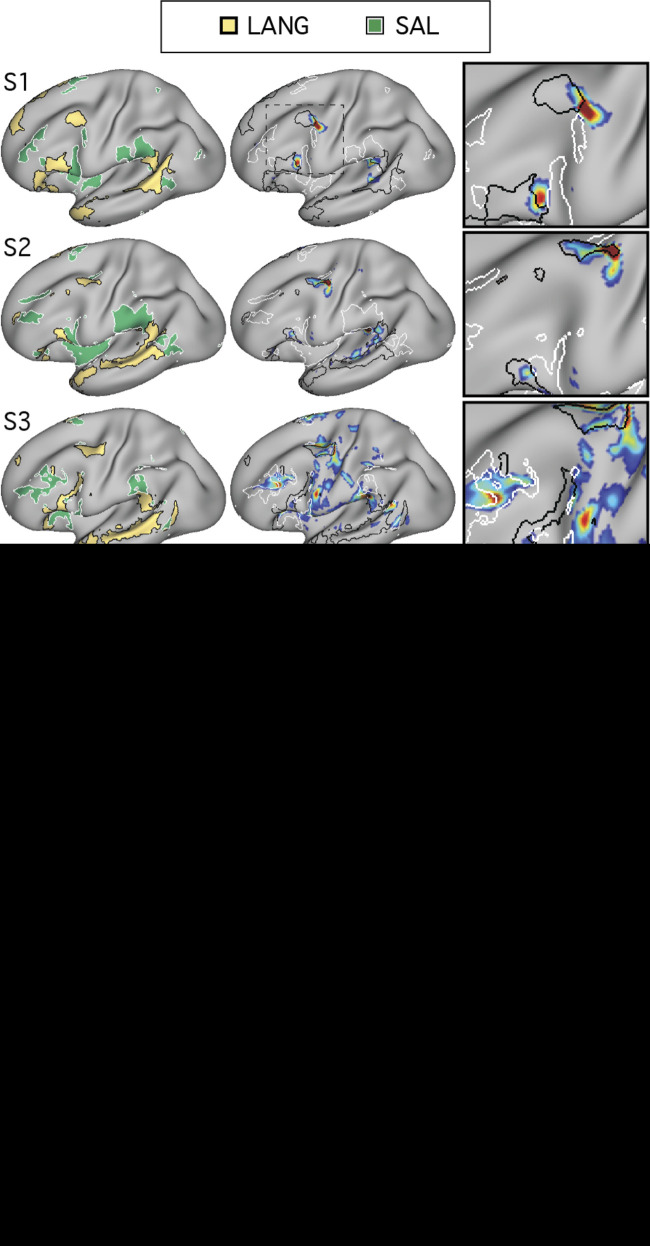
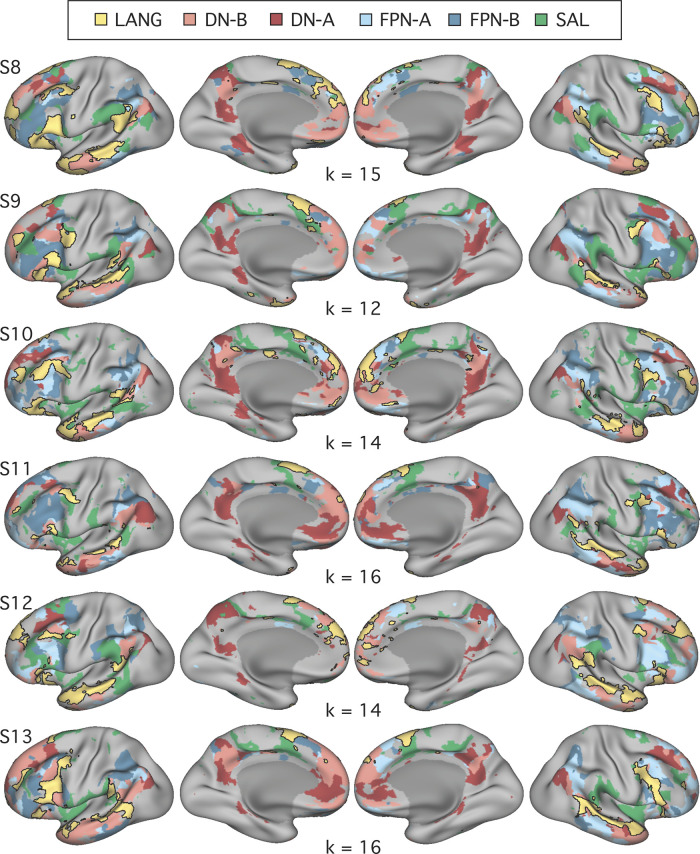
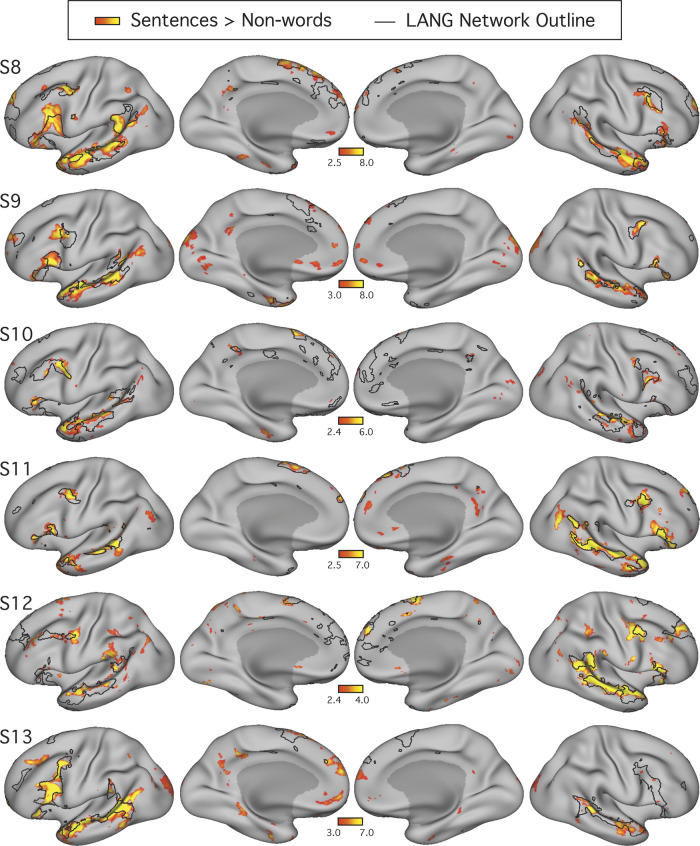
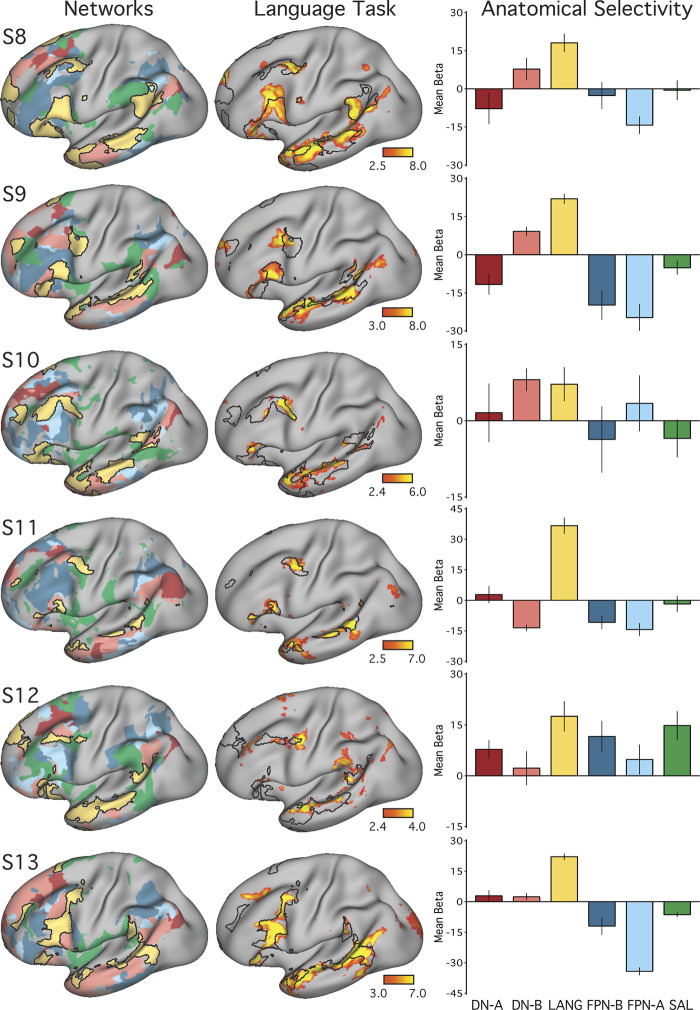
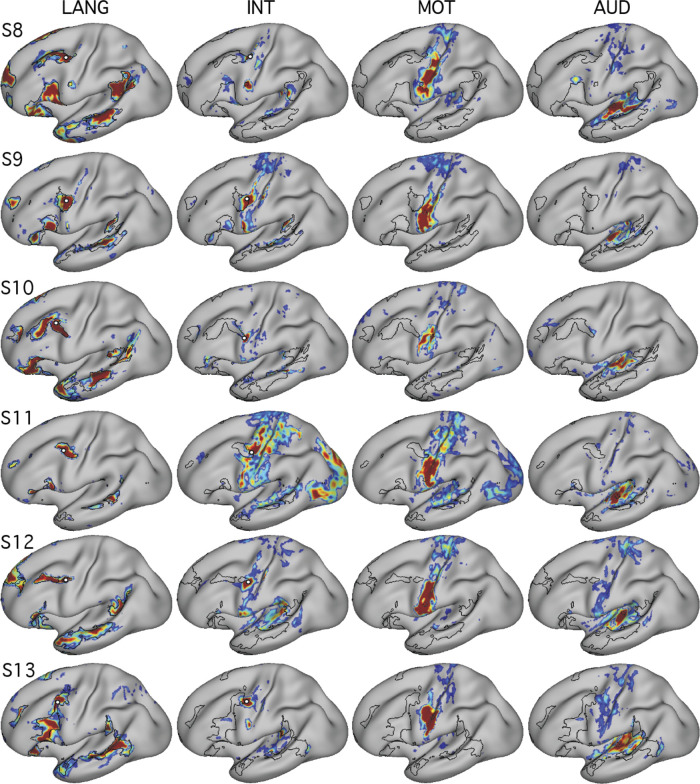
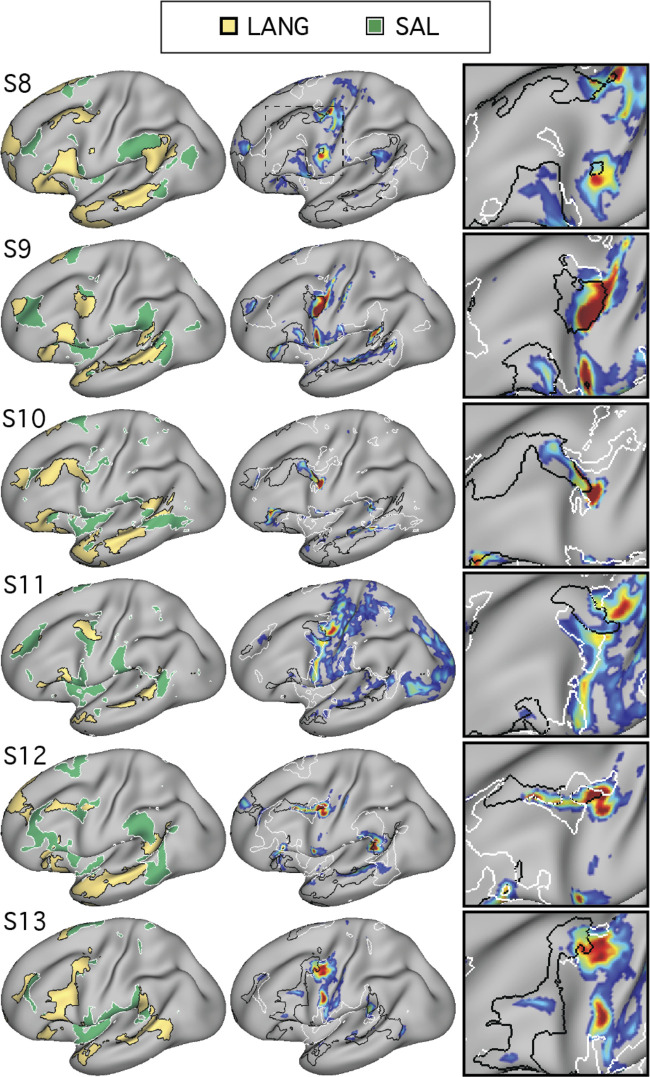
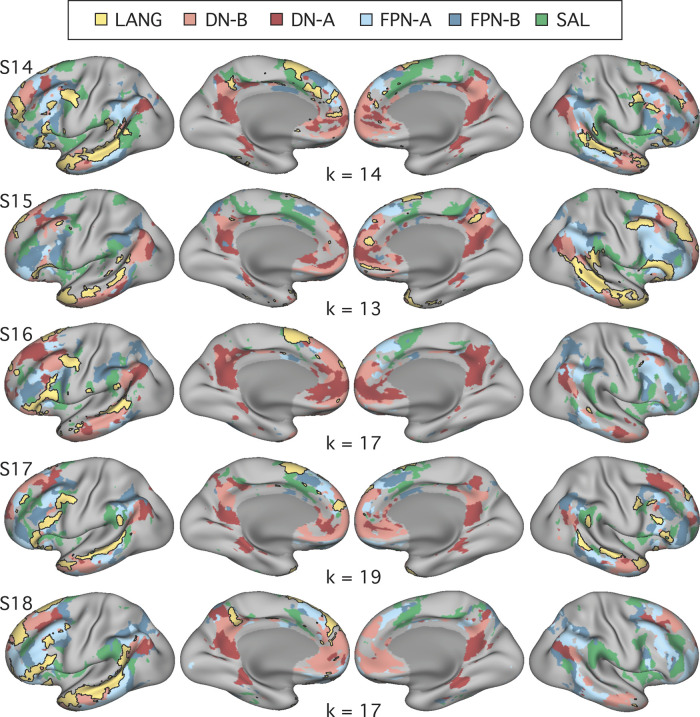
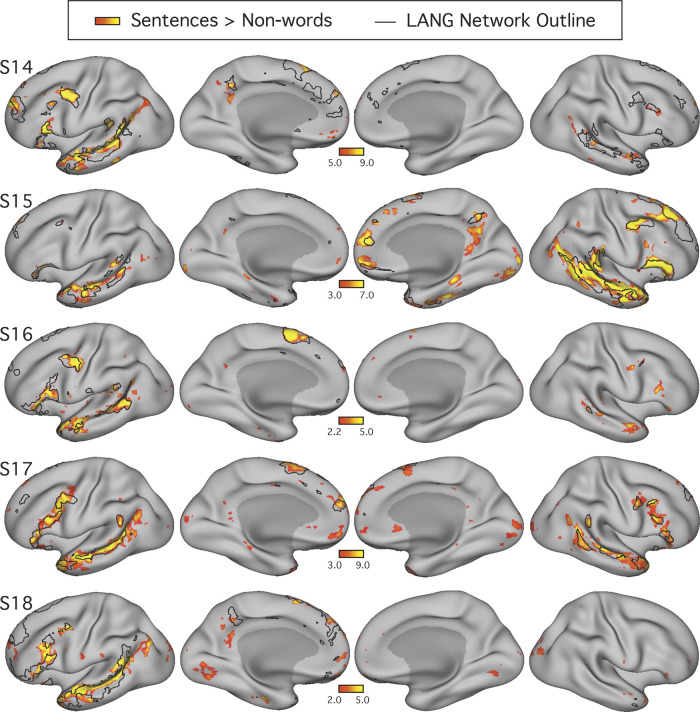
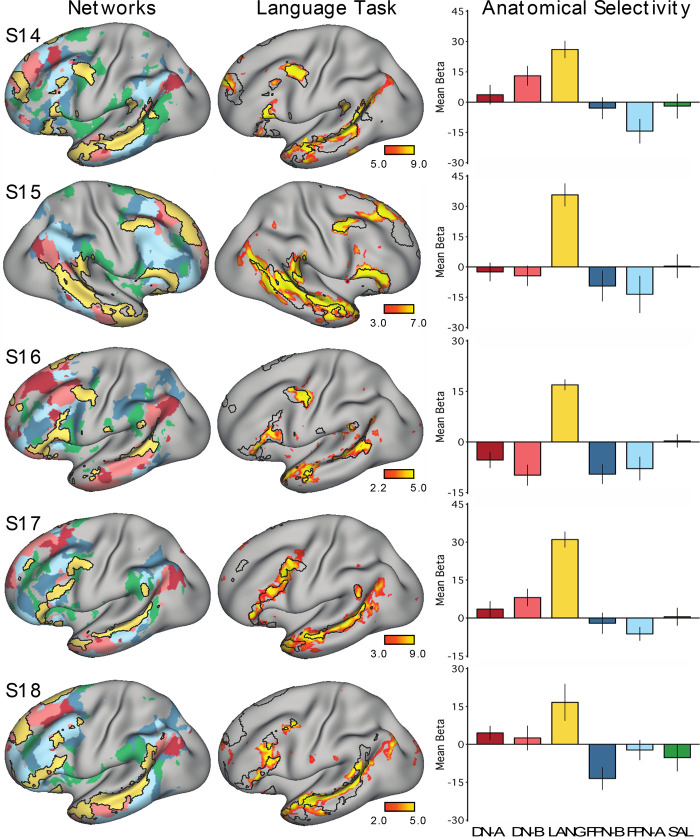
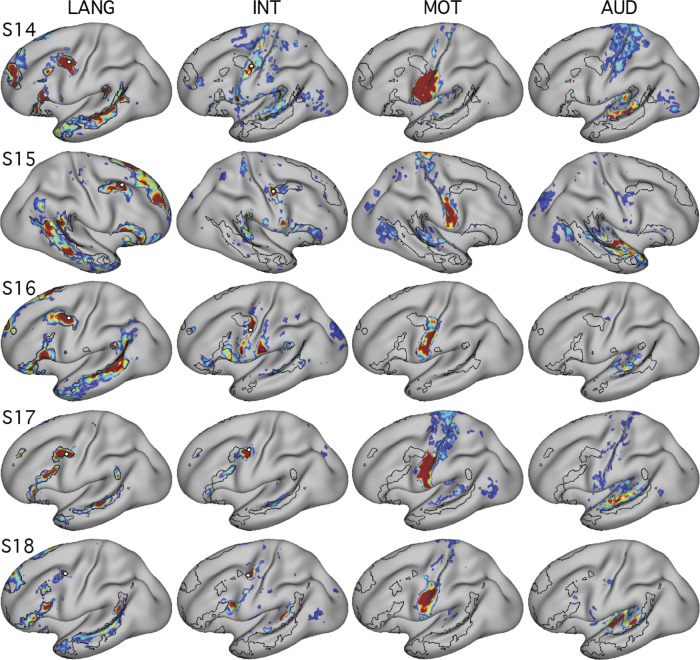
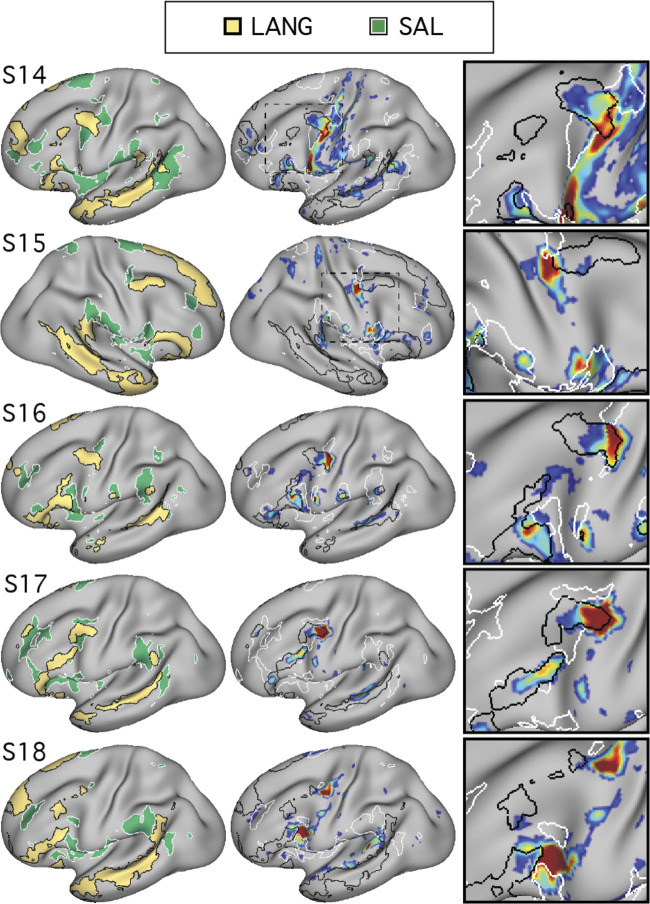
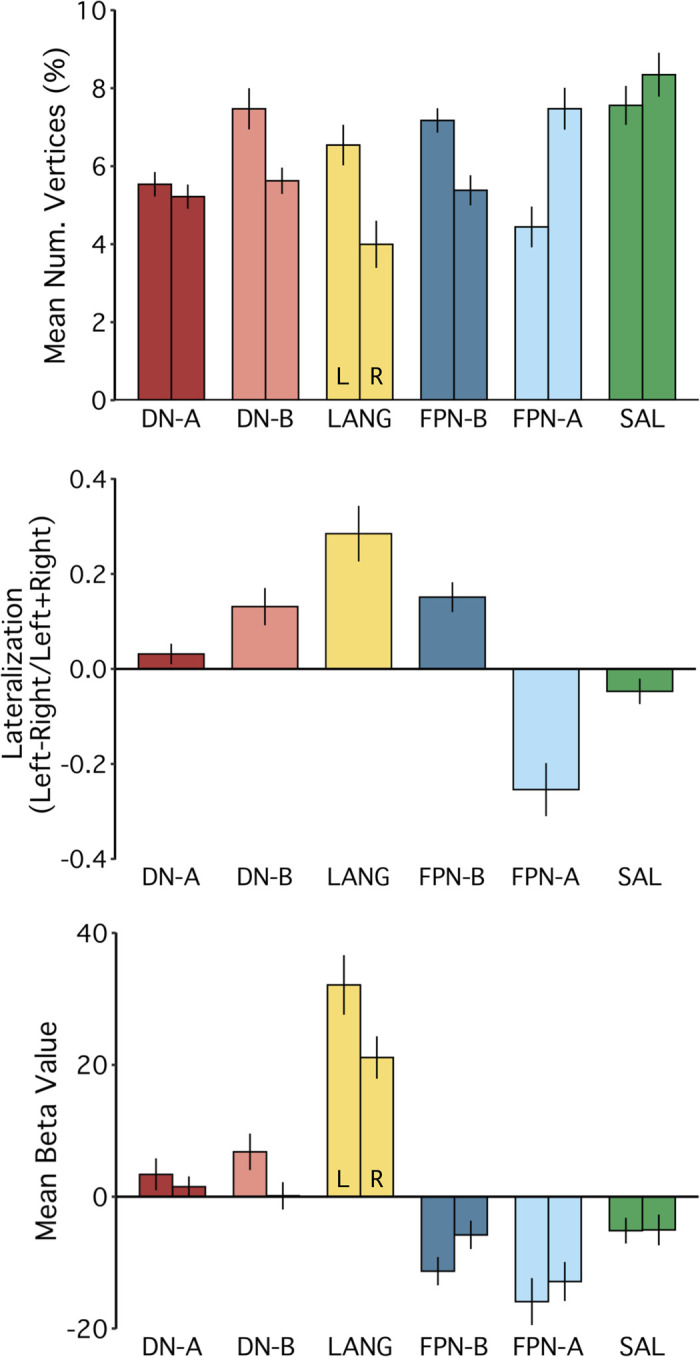
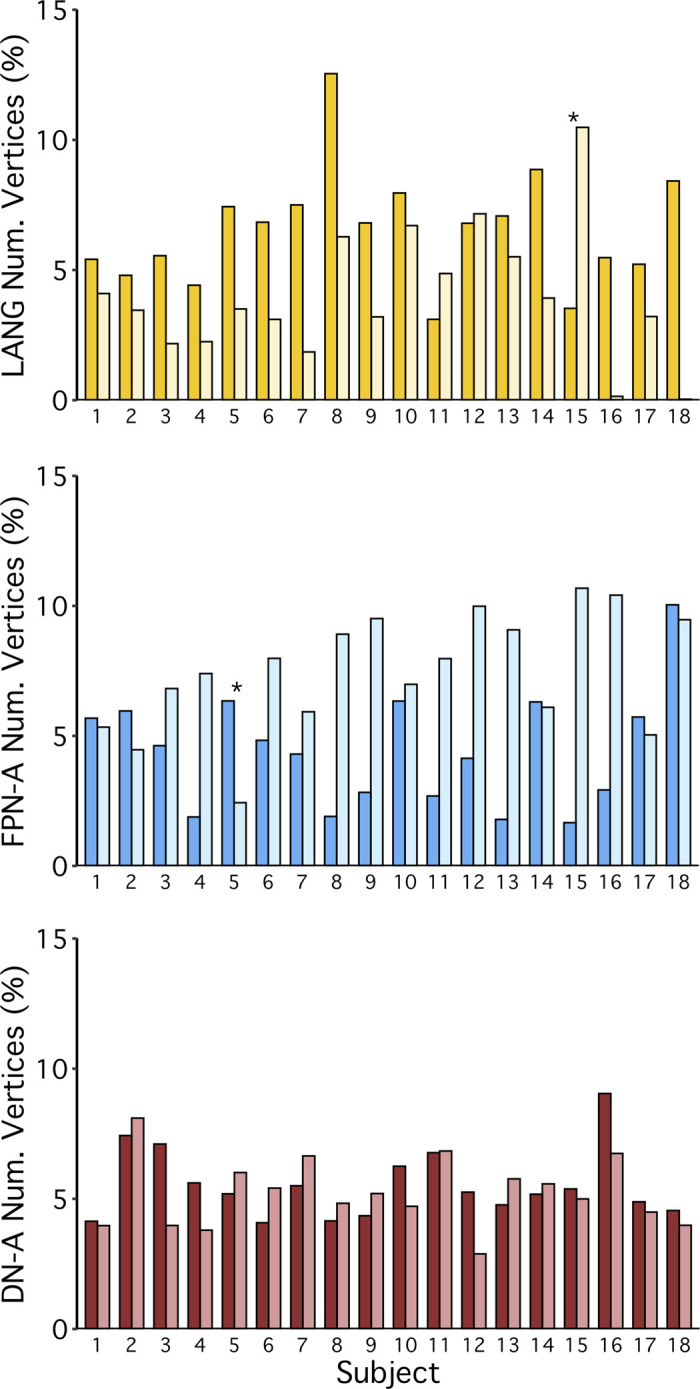
Using procedures optimized to explore network organization within the individual, the topography of a candidate language network was characterized and situated within the broader context of adjacent networks. The candidate network was first identified using functional connectivity and replicated across individuals, acquisition tasks, and analytical methods. In addition to classical language regions near the perisylvian cortex and temporal pole, regions were also observed in dorsal posterior cingulate, midcingulate, and anterior superior frontal and inferior temporal cortex. The candidate network was selectively activated when processing meaningful (as contrasted with nonword) sentences, whereas spatially adjacent networks showed minimal or even decreased activity. Results were replicated and triplicated across two prospectively acquired cohorts. Examined in relation to adjacent networks, the topography of the language network was found to parallel the motif of other association networks, including the transmodal association networks linked to theory of mind and episodic remembering (often collectively called the default network). The several networks contained juxtaposed regions in multiple association zones. Outside of these juxtaposed higher-order networks, we further noted a distinct frontotemporal network situated between language regions and a frontal orofacial motor region and a temporal auditory region. A possibility is that these functionally related sensorimotor regions might anchor specialization of neighboring association regions that develop into a language network. What is most striking is that the canonical language network appears to be just one of multiple similarly organized, differentially specialized distributed networks that populate the evolutionarily expanded zones of human association cortex.NEW & NOTEWORTHY This research shows that a language network can be identified within individuals using functional connectivity. Organizational details reveal that the language network shares a common spatial motif with other association networks, including default and frontoparietal control networks. The language network is activated by language task demands, whereas closely juxtaposed networks are not, suggesting that similarly organized but differentially specialized distributed networks populate association cortex.

Keywords: Broca’s area; Wernicke’s area; distributed association networks; intrinsic functional connectivity; language.


Conflict of interest statement

No conflicts of interest, financial or otherwise, are declared by the authors.

Figures

Fig. 1.
Fig. 1.
Within-individual intrinsic functional connectivity identifies a candidate-distributed language network. Seven subjects (S1–S7) each reveal a candidate language network. Seed regions (○) are displayed at or near the posterior middle frontal gyrus (pMFG). Correlation patterns are shown on an inflated cortical surface representation of the left hemisphere. In each panel, the candidate language network defined by data-driven parcellation (see Fig. 4) is shown in black outline. In each subject, the correlation patterns (color bar) show a network that included regions located near classical language regions of the inferior frontal gyrus (IFG; Broca’s area) and posterior superior temporal cortex (pSTC; Wernicke’s area). The network also revealed regions distributed across multiple cortical zones (see dashed boxes at top), including the posterior superior frontal gyrus (pSFG), the anterior superior frontal gyrus (aSFG; appearing in medial and/or lateral portions in different subjects), and the temporal pole (TP). Smaller regions observed consistently in 5 or more subjects included the dorsal posterior medial cortex (dPMC), the middle cingulate cortex (MCC), and the anterior inferior temporal cortex (aITC). Lateral (left) and medial (right) views are shown. z(r), Fisher’s r-to-z transformed Pearson’s product-moment correlations.
Fig. 2.
Fig. 2.
Distributed organization of the candidate language network is confirmed using seed regions in multiple cortical locations. In 2 subjects (S1 and S2), seed regions (○) were selected from different portions of the network identified in Fig. 1. In each panel, the candidate language network defined by data-driven parcellation (see Fig. 4) is shown in black outline to provide landmarks for comparing across panels. In each subject, seed regions were placed in the inferior frontal gyrus at an anterior (2nd row from top) and posterior site (3rd row from top) as well as in the posterior superior temporal sulcus (4th row from top) and posterior superior frontal gyrus (bottom row). Although the maps differ in their details, the large-scale distribution and location of the network regions are appreciably similar across seed regions, with regions of high correlation falling generally within the parcellation-defined boundaries. z(r), Fisher’s r-to-z transformed Pearson’s product-moment correlations.
Fig. 3.
Fig. 3.
The connectivity-defined candidate language network generalizes across data acquired in different task states. Functional connectivity reliably defined the candidate language network across 3 distinct tasks, showing that the presence of the network is not dependent on a specific cognitive context (see text for task descriptions). Note that the location of the seed region (○) was optimized for each data set to show that the topography of the network is stable despite minor differences in functional shifts that might occur due to task context. Note also that the optimal seed location can vary across data sets even when collected during the same task context (see examples of within-state variance in 3rd supplemental figure in Braga and Buckner 2017 and 3rd figure in Braga et al. 2019b). z(r), Fisher’s r-to-z transformed Pearson’s product-moment correlations.
Fig. 4.
Fig. 4.
Close juxtaposition of the candidate language network with neighboring distributed networks revealed by data-driven parcellation. K-means clustering was used to parcellate the cortex into 17 discrete networks. The candidate language network (LANG; yellow and black outline) was observed in all participants (S1–S7). Network regions were recapitulated in all of the nine zones highlighted in Fig. 1, including a region in the temporal pole that extended rostrally. Further regions can also be observed in the right hemisphere. From the parcellation solutions, 5 additional networks were selected for further analysis due to their spatial proximity to the language network and their identification within classic language regions in prior data-driven network analyses (e.g., see Yeo et al. 2011). These networks were the salience network (SAL; green), frontoparietal control network-A (FPN-A) and -B (FPN-B) (blue), and default network-A (DN-A) and -B (DN-B) (red). The LANG network had a complex spatial relationship with these neighboring networks, showing regions closely packed with default, frontoparietal control, and salience network regions in the temporal cortex and inferior and dorsal frontal cortices. The left 2 columns show lateral and medial views of the inflated left hemisphere, whereas the right 2 columns show the right hemisphere.
Fig. 5.
Fig. 5.
The candidate language network shows close spatial correspondence with regions activated during a language task contrast. The language network (LANG) is shown in black outline and was defined using k-means clustering. Independently acquired data collected during a language localizer task contrast (Fedorenko et al. 2010) reveals cortical response to linguistic demands. Red-yellow color bars show within-individual z-normalized β-values (i.e., “increased activation”) for the contrast of reading sentences vs. reading lists of nonwords. In all subjects (S1–S7), the language task activations fell largely within the boundaries of the intrinsically defined candidate language network. The overlap was not perfect, and in some cases hints of other networks can be seen (e.g., see S1 and S5), although these exceptions were not consistent across subjects. The upper and lower thresholds were selected by eye for each subject to show the distribution of language-responsive regions, while removing regions showing low responses. The detailed anatomy of the distributed intrinsic network corresponds closely with regions showing task-driven activation, including in smaller areas extending beyond the classical language zones (e.g., see S2 and S4), suggesting that the entire intrinsically organized network is functionally specialized.
Fig. 6.
Fig. 6.
The candidate language network is selectively activated during a language task contrast. Left: the networks defined by intrinsic functional connectivity from Fig. 4 are replotted. The candidate language network (LANG) is shown in yellow, with the salience network (SAL) in green, the frontoparietal control networks (FPN-A and FPN-B) in blue, and the default networks (DN-A and DN-B) in red. Middle: task activation for the contrast of reading sentences vs. reading lists of nonwords (sentences > non-words) is shown, with the intrinsic LANG network outline in black (see Fig. 5 for other views). Right: bar graphs show the mean β-values for the sentences > nonwords contrast, averaged within each within-individual a priori-defined network, along with the standard error of the mean. Despite differences across individuals, LANG was the only network showing consistently higher activation for sentences > non-words, showed the highest activation of all networks in all participants, and in some cases (S2, S4, and S7) was the only network that showed clear increased activity in the task contrast.
Fig. 7.
Fig. 7.
Distributed networks link language regions with tongue motor and auditory regions in S1. An intermediate network (INT) was observed, which sits in between the language network (LANG) and both the temporal auditory (AUD) and frontal orofacial motor (MOT) regions. A: yellow regions show activations during the language localizer task (as in Fig. 5; sentences > nonwords), whereas blue regions show regions displaying increased response during a separate tongue movement task contrast (tongue movements > hand and foot movements) provided by the same subject. The black outline displays the parcellation-defined intrinsic language network (LANG; Fig. 4). Solid open circles are centered on seed vertices that were used to define intrinsic connectivity networks in the remaining panels. B and C: seed-based intrinsic connectivity patterns from seeds selected from the temporal (Tmp; B) and frontal lobes (Frt; C). Auditory and motor regions were recapitulated using functional connectivity using seed regions placed in the contralateral [right (RH)] hemisphere, as correlation patterns close to the seed are difficult to interpret. Dashed open circles refer to the reflected location of the contralateral seeds. White-filled circles denote the location of the seed used to define correlation patterns in that panel. The INT network displays an organization that parallels the LANG network, containing neighboring regions in both inferior frontal and temporal cortices as well as along the posterior superior frontal midline (not shown). The function of the INT network is unclear; however, its distributed organization and juxtaposition with LANG, MOT, and AUD regions in multiple locations suggests that it may form part of a hierarchy linking language and sensorimotor functions. Task activations are shown as mean z-normalized β-values and intrinsic correlations as Fisher’s r-to-z normalized Pearson’s product-moment correlations, ranging from 0.2 to 0.6, as in Fig. 1.
Fig. 8.
Fig. 8.
Distributed networks link language regions with tongue motor and auditory regions in S2. Generalizing the findings from S1 (Fig. 7), intrinsic connectivity in S2 also revealed an intermediate (INT) distributed system that bridged the spaces between the language network (LANG) and sensorimotor regions for hearing (AUD) and tongue movements (MOT). A: task-activated regions are shown for the language (yellow) and tongue motor localizer (blue) task contrasts. B and C: seed-based intrinsic connectivity patterns from seeds selected in the temporal lobe (Tmp; B) and the frontal lobe (Frt; C) as well as in homologous regions of the right hemisphere (RH). Task activations are shown as mean z-normalized β-values and intrinsic correlations as Fisher’s r-to-z normalized Pearson’s product-moment correlations, ranging from 0.2 to 0.6, as in Fig. 1.
Fig. 9.
Fig. 9.
Distributed networks link language regions with tongue motor and auditory regions in S3–S7. Generalizing the findings from S1 (Fig. 7) and S2 (Fig. 8), intrinsic seed-based connectivity was used to confirm the presence of language (LANG), intermediate (INT), motor (MOT), and auditory (AUD) networks for the remaining subjects (S3–S7) from the original cohort (studies 1 and 2). Black outlines display the parcellation-defined intrinsic language network (Fig. 4). White-filled circles denote the location of the seed used to define correlation patterns in that panel. Dashed circles refer to the reflected location of contralateral seed locations. A network that included key features of regions following the expected distribution of the INT network as identified in subjects S1 (Fig. 7) and S2 (Fig. 8) could be defined in all subjects, but with varying degrees of separation from nearby networks.
Fig. 10.
Fig. 10.
Details of spatial relationships between the intermediate (INT), language (LANG), and salience (SAL) networks. In lateral frontal cortex, SAL was closely positioned next to regions of the LANG and INT networks. Closer analysis of these 3 networks showed that the INT network was more often positioned next to the LANG regions than SAL regions. INT regions typically extensively bordered the LANG network, were located next to LANG regions in all subjects, and were not consistently juxtaposed with SAL regions to the same extent (e.g., see S2 and S7).
Fig. 11.
Fig. 11.
Replication of close juxtaposition of the language network with neighboring distributed networks revealed by data-driven parcellation. K-means clustering was used to parcellate the cortex into k networks in each individual from the replication cohort (study 3). Confirming the results from the original cohort (studies 1 and 2; Fig. 4), the language network (LANG; yellow and black outline) was observed in all participants (S8–S13). When all subjects were considered, network regions were recapitulated in all of the 9 zones highlighted in Fig. 1. From the parcellation solutions, 5 additional networks were selected for further analysis: the salience network (SAL; green), frontoparietal control network-A (FPN-A) and -B (FPN-B) (blue), and default network-A (DN-A) and -B (DN-B) (red).
Fig. 12.
Fig. 12.
Replication of close spatial correspondence between the language network and regions activated during a language task contrast. Analysis of the replication cohort (study 3) recapitulated the findings from the original cohort (studies 1 and 2; see Fig. 5). The language network (LANG) is shown in black outline and was defined using k-means clustering (Fig. 11). In all subjects (S8–S13), the language task activations fell largely within the boundaries of the intrinsically defined candidate language network. The detailed anatomy of the distributed intrinsic network corresponds closely with regions showing task-driven activation, including in smaller areas extending beyond the classical language zones (e.g., see S8 and S11), suggesting that the entire intrinsically organized network is functionally specialized. The overlap was not perfect, and in some cases hints of other networks can be seen (e.g., see S13), although these exceptions were not consistent across subjects. Unusually, in 2 subjects, S11 and S12, the task activation maps revealed larger regions in the right than in the left hemispheres. These subjects were also found to have unusually bilateral or slightly right-lateralized LANG networks when the relative size of regions in each hemisphere was later compared (Fig. 22).
Fig. 13.
Fig. 13.
Replication of selective activation of the language network during a language task contrast. Analysis of the replication cohort (study 3) recapitulated the findings from the original cohort (studies 1 and 2; see Fig. 6). Left: the networks defined by intrinsic functional connectivity from Fig. 11 are replotted. The candidate language network (LANG) is shown in yellow, with the salience network (SAL) in green, the frontoparietal control networks (FPN-A and FPN-B) in blue, and the default networks (DN-A and DN-B) in red. Middle: task activation for the contrast of reading sentences vs. reading lists of nonwords is replotted from Fig. 12. Right: bar graphs show the mean β-values for the sentences > nonwords contrast, averaged within each within-individual a priori-defined network, along with the standard error of the mean. Despite differences across individuals, LANG was the only network showing consistently higher activation for sentences > nonwords and in some cases (S11 and S13) was the only network that showed clear increased activity in the task contrast.
Fig. 14.
Fig. 14.
Replication of distributed networks linking language regions with tongue motor and auditory regions. Generalizing the findings from studies 1 and 2 (see Figs. 7, 8, and 9), intrinsic seed-based connectivity was used to confirm the presence of language (LANG), intermediate (INT), motor (MOT), and auditory (AUD) networks for the replication cohort (S8–S13; study 3). Black outlines display the parcellation-defined intrinsic language network (see Fig. 11). White-filled circles denote the location of the seed used to define correlation patterns in that panel. Dashed circles refer to the reflected location of contralateral seed locations. A network that included regions following the expected distribution of the INT network as identified in subjects S1 (Fig. 7) and S2 (Fig. 8) could be defined in all subjects, but with varying degrees of separation from nearby networks (e.g., see S13 vs. S11).
Fig. 15.
Fig. 15.
Replication of spatial relationships between the intermediate (INT), language (LANG), and salience (SAL) networks. Replicating the results from the original cohort (studies 1 and 2; see Fig. 10), detailed analysis showed that the INT network was more often positioned close to LANG regions than to SAL regions in the replication cohort (study 3). Across subjects, INT regions typically extensively bordered the LANG network, were located next to LANG regions in all subjects, even those showing complex anatomy (e.g., see S10 and S12), and were not consistently juxtaposed with SAL regions to the same extent (e.g., see S8).
Fig. 16.
Fig. 16.
Triplication of close juxtaposition of the language network with neighboring distributed networks revealed by data-driven parcellation. K-means clustering was used to parcellate the cortex into k networks in each individual from the triplication cohort (study 4). Confirming the results from the original (studies 1 and 2; see Fig. 4) and replication (study 3; see Fig. 11) cohorts, the candidate language network (LANG; yellow and black outline) was observed in all participants (S14–S18). When all subjects were considered, network regions were recapitulated in all of the 9 zones highlighted in Fig. 1. Unusually, subject S15 contained visibly larger regions on the right hemisphere compared with the left. From the parcellation solutions, 5 additional networks were selected for further analysis: the salience network (SAL; green), frontoparietal control network-A and -B (FPN-A and FPN-B; blue), and default network-A and -B (DN-A and DN-B; red).
Fig. 17.
Fig. 17.
Triplication of close spatial correspondence between the language network and regions activated during a language task contrast. Analysis of the triplication cohort (study 4) recapitulated the findings from the original (studies 1 and 2; see Fig. 5) and replication (study 3; see Fig. 12) cohorts. The language network (LANG) is shown in black outline and was defined using k-means clustering (Fig. 16). Red-yellow color bars show within-individual z-normalized β-values (i.e., “increased activation”) for the contrast of reading sentences vs. reading lists of nonwords. In all subjects (S14–S18), the language task activations fell predominantly within the boundaries of the intrinsically defined candidate language network. Subject S15 showed larger regions of activation in the right than in the left hemisphere, corresponding to this subject’s unusual right-lateralized LANG network (see Fig. 16). The detailed anatomy of the distributed intrinsic network corresponded closely with regions showing task-driven activation, including in smaller areas extending beyond the classical language zones (e.g., see S14 and S17), again suggesting that the entire intrinsically organized network is functionally specialized.
Fig. 18.
Fig. 18.
Triplication of selective activation of the language network during a language task contrast. Analysis of the triplication cohort (study 4) recapitulated the findings from the original (studies 1 and 2; see Fig. 6) and replication (study 3; see Fig. 13) cohorts. Left: the networks defined by intrinsic functional connectivity from Fig. 16 are replotted. The candidate language network (LANG) is shown in yellow, with the salience network (SAL) in green, the frontoparietal control networks (FPN-A and FPN-B) in blue, and the default networks (DN-A and DN-B) in red. Middle: task activation for the contrast of reading sentences vs. reading lists of nonwords are replotted from Fig. 17. Right: bar graphs show the mean β-values for the sentences > nonwords contrast, averaged within each within-individual a priori-defined network, along with the standard error of the mean. LANG was the only network showing consistently higher activation for sentences > nonwords, showed the highest mean activation of all the networks in all subjects, and in most cases (S15, S16 and S18) was the only network that showed activity clearly above baseline in the task contrast.
Fig. 19.
Fig. 19.
Triplication of distributed networks linking language regions with tongue motor and auditory regions. Generalizing the findings from studies 1 and 2 (Figs. 7, 8, and 9) and study 3 (see Fig. 14), intrinsic seed-based connectivity was used to confirm the presence of language (LANG), intermediate (INT), motor (MOT), and auditory (AUD) networks in the triplication cohort (study 4; S14–S18). Black outlines display the parcellation-defined intrinsic language network (Fig. 16). White-filled circles denote the location of the seed used to define correlation patterns in that panel. Dashed circles refer to the reflected location of contralateral seed locations. A network that included regions following the expected distribution of the INT network could be defined in all subjects.
Fig. 20.
Fig. 20.
Triplication of spatial relationships between the intermediate (INT), language (LANG), and salience (SAL) networks. Replicating the results from the original (studies 1 and 2; see Fig. 10) and replication cohorts (study 3; see Fig. 15), detailed analysis showed that the INT network was more often positioned next to the LANG regions than the SAL regions in the triplication cohort (study 4). Across subjects, INT regions typically extensively bordered the LANG network, were located next to LANG regions in all subjects, and were not consistently juxtaposed with SAL regions to the same extent (e.g., see S16 and S17).
Fig. 21.
Fig. 21.
The language network is left lateralized on average in the group. Composite analyses were conducted using all 18 subjects from the original, replication, and triplication cohorts (studies 1–4). Group means are plotted in each panel, with standard error of the mean. Top: %total vertices in the left (L) and right (R) hemispheres included in each of the 6 a priori networks was calculated as a proxy for the relative size or surface area occupied by each network. The language network (LANG) showed larger regions on the left compared with right hemispheres, as did default network B (DN-B) and frontoparietal control network B (FPN-B). Default network A (DN-A) and the salience network (SAL) showed no or limited evidence of consistent lateralization. Frontoparietal control network A (FPN-A) showed a consistent right-lateralized pattern. Middle: direct comparison of the relative size of network regions in each hemisphere revealed that, on average, the LANG network was the most left lateralized of the networks tested. The lateralization metric computed was the number of network vertices in the left hemisphere minus the number of network vertices in the right divided by the total number of network vertices in both hemispheres. Positive values denote left lateralization, and negative values denote right lateralization. Bottom: the group mean β-value for the contrast of reading sentences vs. lists of pronounceable nonwords was calculated for vertices falling within each a priori network, separated by hemisphere. Despite differences in the relative size of LANG network regions in each hemisphere, robust evidence for activation in both hemispheres was observed, with left hemisphere regions showing higher levels of activity.
Fig. 22.
Fig. 22.
The language network is left lateralized in a majority of individuals, with notable exceptions. Extending the composite analyses conducted using all 18 subjects from the original, replication, and triplication cohorts (studies 1–4; Fig. 21), the %total network vertices in the left and right hemispheres was plotted for each subject. The darker-shaded bars represent the left hemisphere, and the lighter-shaded bars represent the right hemisphere. Graphs show the %vertices from each hemisphere contained within the language (LANG; top), frontoparietal control network A (FPN-A; middle), and default network A (DN-A; bottom). The LANG network was left lateralized in 15 out of the total 18 subjects. Of the other networks, FPN-A showed a strong and consistent right-lateralized pattern, and DN-A showed a consistent bilateral pattern. Note that the bilateral pattern for DN-A observed in the group average (see Fig. 21) is consistent across individuals and not a result of mixed strong left and right lateralization in different subjects. *Interesting subjects that showed clear evidence for opposite patterns from the group norm. Subject S15, by all analyses (see text), displays a pattern of flipped lateralization of the language network.

Similar articles

Cited by

References

    1. Bates E, Wilson SM, Saygin AP, Dick F, Sereno MI, Knight RT, Dronkers NF. Voxel-based lesion-symptom mapping. Nat Neurosci 6: 448–450, 2003. doi:10.1038/nn1050. - DOI - PubMed
    1. Binder JR, Desai RH, Graves WW, Conant LL. Where is the semantic system? A critical review and meta-analysis of 120 functional neuroimaging studies. Cereb Cortex 19: 2767–2796, 2009. doi:10.1093/cercor/bhp055. - DOI - PMC - PubMed
    1. Binder JR, Rao SM, Hammeke TA, Frost JA, Bandettini PA, Jesmanowicz A, Hyde JS. Lateralized human brain language systems demonstrated by task subtraction functional magnetic resonance imaging. Arch Neurol 52: 593–601, 1995. doi:10.1001/archneur.1995.00540300067015. - DOI - PubMed
    1. Blank I, Kanwisher N, Fedorenko E. A functional dissociation between language and multiple-demand systems revealed in patterns of BOLD signal fluctuations. J Neurophysiol 112: 1105–1118, 2014. doi:10.1152/jn.00884.2013. - DOI - PMC - PubMed
    1. Blank SC, Scott SK, Murphy K, Warburton E, Wise RJS. Speech production: Wernicke, Broca and beyond. Brain 125: 1829–1838, 2002. doi:10.1093/brain/awf191. - DOI - PubMed

Publication types

LinkOut - more resources