. 2021 Jan;53(2):611-636.
doi: 10.1111/ejn.14981. Epub 2020 Oct 12.

From statistical regularities in multisensory inputs to peripersonal space representation and body ownership: Insights from a neural network model

Affiliations

From statistical regularities in multisensory inputs to peripersonal space representation and body ownership: Insights from a neural network model

Tommaso Bertoni et al. Eur J Neurosci. 2021 Jan.

Abstract

Peripersonal space (PPS), the interface between the self and the environment, is represented by a network of multisensory neurons with visual (or auditory) receptive fields anchored to specific body parts, and tactile receptive fields covering the same body parts. Neurophysiological and behavioural features of hand PPS representation have been previously modelled through a neural network constituted by one multisensory population integrating tactile inputs with visual/auditory external stimuli. Reference frame transformations were not explicitly modelled, as stimuli were encoded in pre-computed hand-centred coordinates. Here we present a novel model, aiming to overcome this limitation by including a proprioceptive population encoding hand position. We confirmed behaviourally the plausibility of the proposed architecture, showing that visuo-proprioceptive information is integrated to enhance tactile processing on the hand. Moreover, the network's connectivity was spontaneously tuned through a Hebbian-like mechanism, under two minimal assumptions. First, the plasticity rule was designed to learn the statistical regularities of visual, proprioceptive and tactile inputs. Second, such statistical regularities were simply those imposed by the body structure. The network learned to integrate proprioceptive and visual stimuli, and to compute their hand-centred coordinates to predict tactile stimulation. Through the same mechanism, the network reproduced behavioural correlates of manipulations implicated in subjective body ownership: the invisible and the rubber hand illusion. We thus propose that PPS representation and body ownership may emerge through a unified neurocomputational process; the integration of multisensory information consistently with a model of the body in the environment, learned from the natural statistics of sensory inputs.

Keywords: Hebbian learning; bodily self-consciousness; body representation; reference frame transformations; statistical inference.


Conflict of interest statement

The authors declare no conflict of interest.

Figures

FIGURE 1
FIGURE 1
Network architecture, training and testing. (a) Architecture of the network. In the lower layer, three unisensory populations encode tactile stimulation on the hand, the proprioceptive position of the hand, the position of a visual stimulus. The upper layer is composed of multisensory neurons, in the sense that they receive inputs from each of the three unisensory populations. Each neuron in the proprioceptive and visual population has a preferred position distributed on a regular grid, with a Gaussian tuning curve of fixed width (~13 cm and ~11 cm respectively). For every stimulus, the number of spikes of neurons in the lower layer is drawn from a Poisson distribution, whose mean is determined by the tuning curve and a randomly selected gain in the range 4–10. The activity of neurons in the tactile population is set to 0 when the distance between the hand and the visual stimulus is greater than 15 cm. If the distance is smaller than 15 cm, the spike count for the tactile neurons is drawn from a Poisson distribution of mean 4–10, with this value randomly selected for each stimulus. Neurons in the lower layer are connected to neurons in the upper layer by bi‐directional, symmetric synapses. (b) One training/testing step of the network. During testing, one stimulus is generated and encoded in the lower layer (u0), and the activity of the upper layer (m0) is computed based on the unisensory neurons activity. Then, the activity of the unisensory neurons is re‐computed based on the multisensory neurons' activity to obtain the read‐out of the integrated information encoded in the multisensory population (u1). During training, an additional encoding step (confabulation phase) is added, where the activity of the multisensory neurons (m1) is computed based on the reconstructed activity in the unisensory populations (u1). Then, the synapses are updated with a weight change proportional to the difference in correlations between the lower and upper layer neurons in the two phases
FIGURE 2
FIGURE 2
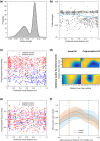
Properties of neurons in the upper layer. (a) Distribution of the strength of tactile input across the multisensory neurons. The strength of the input for each multisensory neuron is defined as the average of the synaptic weight of the projections it receives from the 30 tactile neurons. (b) Dependence of the strength of tactile input on the preferred visual distance of the multisensory neurons. The overlaid solid line represents mean values over 10 distance bins and the shade its standard error. (c) Quantification of the overlap of proprioceptive and visual receptive fields as a function of the preferred visual distance. The overlap is defined as the Pearson correlation coefficient of synaptic input to the multisensory neuron over space. Red and blue denote respectively multisensory neurons projecting excitatory and inhibitory synapses towards the tactile area. The overlaid solid lines represent mean values over 10 bins, with the shade representing the standard error. (d) Two exemplary visual (left) and proprioceptive (right) receptive fields of multisensory neurons. in the upper panels, a neuron receiving and sending excitatory projections to the tactile area, with overlapping visual and proprioceptive RFs. In the lower panels, a neuron receiving and sending inhibitory projections to the tactile area, with disjoint visual and proprioceptive RFs. Yellow and blue indicate respectively strong and weak projections from the unisensory areas to the multisensory neurons. (e) Same as panel c, but in a control model where tactile input was provided randomly and uncorrelated with visual and proprioceptive information. (f) Mean activity of the multisensory neurons that positively respond to touch, as a function of the position of the visual stimulus. The orange and light blue curves correspond to two different simulated positions of the hand, respectively, 25 cm left and right of the midline
FIGURE 3
FIGURE 3
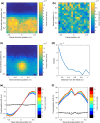
Simulated behavioural experiments. (a and b) Tactile evoked activity ‐ multisensory facilitation as a function of visual stimulus position (in trunk‐centred coordinates) and hand position. The evoked tactile activity is obtained by setting the tactile input to zero, encoding a visual and a proprioceptive input, and reading out the tactile information encoded in the multisensory area from the tactile area (i.e.: its mean activity after a “down” pass). In trunk‐centred coordinates (a) stronger activity for close positions of the visual stimulus can be observed, but no modulation as a function of the position along the anterior‐posterior axis. Virtually no modulation is observed as a function of hand position (b). (c) The same tactile evoked activity, plotted as a function of the visual stimulus position in hand‐centred coordinates. (d) Tactile evoked activity as a function of the distance from the centre of the hand of the visual stimulus. (e) Simulated proprioceptive drift in the invisible hand illusion. The proprioceptive input is fixed at the midline, and the position of the visual stimulus is shifted across the midline. The plot shows the proprioceptive position reconstructed by the network after integrating the three sensory inputs. The x axis represents the distance from the midline of the visual stimulus. Different colours represent different levels of intensity for the tactile input, starting from black (no touch/asynchronous stimulation), to red (maximal intensity of tactile stimulation). (f) Same as panel d, but the proprioceptive drift is expressed as the percentage of the distance between the visual and proprioceptive stimuli
FIGURE 4
FIGURE 4
Results of the behavioural experiment. (a) Schematic experimental setup. The subjects placed their right hand approximatively 30 cm in front of their trunk, either 25 cm left or right of their midline. The origin of the arrows represents the starting point of the different trajectories, coinciding with the fixation cross. The total length of the trajectories was approximatively 50 cm. (b) Modulation of average reaction times for the 43 participants as a function of hand position and ball trajectory congruency with hand position. For simplicity, we show only the two conditions that are relevant for confirming our hypothesis, and leave out the receding condition. Thick lines indicate global means by condition. (c) Expected results from model simulations for the same experimental setup. Red crosses represent the position of the real hand's centre, the colour coding represents the predicted multisensory facilitation. Yellow areas represent zones of higher facilitation/faster reaction times
FIGURE 5
FIGURE 5
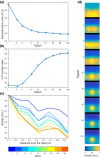
Evolution of the network during training. (a) Reconstruction error of the network plotted as a function of the training epoch. The reconstruction error is defined as the mean squared difference between the training sensory input and its reconstruction in the confabulation phase. (b) Visuo‐proprioceptive overlap index across the 9 training epochs. The visuo‐proprioceptive overlap index is defined as the difference between the average visuo‐proprioceptive overlap of tactile excitatory and tactile inhibitory neurons. The stronger the overlap for tactile excitatory neurons, and the stronger the anti‐overlap for tactile inhibitory neurons, the higher the index is. (c) Evoked tactile activity as a function of the distance from the hand of the visual stimulus, across the same nine epochs of training. (d) Evoked tactile activity as a function of the position of the stimulus expressed in hand centred coordinates. The activity is plotted for the same nine stages of training
FIGURE 6
FIGURE 6
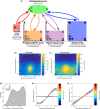
Network including visual information about hand position (a) Architecture of the network. In addition to the previous model, this network has one visual population (purple one) coding for the position of the hand. The tuning curves of neurons in this population have the same width as in the visual population coding for the position of the external stimulus. Other populations' tuning curves and training parameters were the same as in the previous model. (b) Tactile evoked response as a function of the position of the stimulus expressed in hand centred coordinates. (c) Same as panel (b), but the activity in the visual population coding for the hand was set to 0, simulating the occlusion of the hand and reproducing the sensory input of the previous model. (d) Distribution of the overlap between proprioceptive receptive fields and the receptive fields of the visual population coding for hand position. The inset shows the same result, in a network in which the proprioceptive and visual hand positions were never dissociated. (e) Proprioceptive drift in the simulated invisible hand illusion. We followed the same procedure as for Figure 3e, and set the activity in the visual population coding for hand position to 0 to simulate the occlusion of the hand in this network. The x axis represents the distance from the midline of the visual stimulus. (f) Proprioceptive drift in the simulated rubber hand illusion. The procedure was the same as for the invisible hand illusion, with the exception that the visual hand area was now coding for the same location as the external visual stimulus
FIGURE 7
FIGURE 7
Individually shifting receptive fields. (a) Architecture of the network. The first two layers have the same architecture as in the main model, but fewer neurons to facilitate the training. The third layer is connected to the second multisensory layer and to the tactile population in the unisensory layer. The training was performed in two steps. The first step was identical to the original model. In the second step, training inputs for the second multisensory layer were constituted by the joint activity of first multisensory layer neurons and unisensory tactile neurons. (b) Correlation between hand position and RF peak of second multisensory layer neurons, as a function of the strength of the input they receive from unisensory tactile neurons. The correlation is defined as the average between correlations along the x and y directions. (c) Visual receptive field of one exemplary multisensory neuron in the third layer, receiving strong excitatory projections from the tactile area, for two different hand positions. Each subplot corresponds to different position of the hand, indicated by the red cross overlaid to the receptive field
FIGURE 8
FIGURE 8
Further network generalizations. Panel (a) shows of the same analyses shown in Figure 3c, for a network in which hand position was encoded under the form of shoulder and elbow joint angles. Panel (b) reproduces Figure 3e for the same network. Panels (c) and (d) demonstrate the same results as panels (a) and (b) in a network where, in addition to encoding proprioceptive inputs under the form of joint angles, a fourth population coding for gaze position was added. This requires the network to compute a further reference frame transformation

Similar articles

Cited by

References

    1. Alais, D. , & Burr, D. (2004). The ventriloquist effect results from near‐optimal bimodal integration. Current Biology, 14, 257–262. - PubMed
    1. Attneave, F. (1954). Some informational aspects of visual perception. Psychological Review, 61(3), 183–193. 10.1037/h0054663 - DOI - PubMed
    1. Avillac, M. , Denève, S. , Olivier, E. , Pouget, A. , & Duhamel, J.‐R. (2005). Reference frames for representing visual and tactile locations in parietal cortex. Nature Neuroscience, 8, 941–949. - PubMed
    1. Barlow, H. B. (1961). Possible principles underlying the transformation of sensory messages. Sensory Communication, 217–234.
    1. Bernasconi, F. , Noel, J. , Park, H. D. , Faivre, N. , Seeck, M. , Spinelli, L. , Schaller, K. , Blanke, O. , & Serino, A. (2018). Audio‐tactile and peripersonal space processing around the trunk in human parietal and temporal cortex: An intracranial EEG study. Cerebral Cortex, 28, 3385–3397. 10.1093/cercor/bhy156 - DOI - PMC - PubMed

Publication types