. 2020 Sep 23;15(9):e0238397.
doi: 10.1371/journal.pone.0238397. eCollection 2020.

A 3D brain unit model to further improve prediction of local drug distribution within the brain

Affiliations

A 3D brain unit model to further improve prediction of local drug distribution within the brain

Esmée Vendel et al. PLoS One. .

Abstract

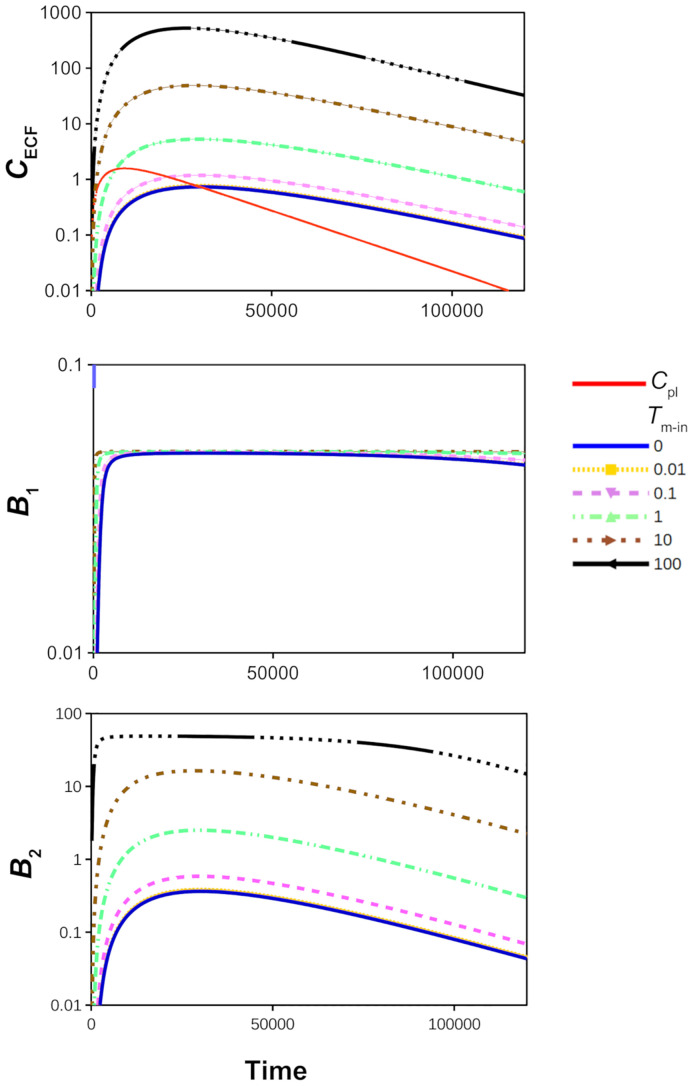
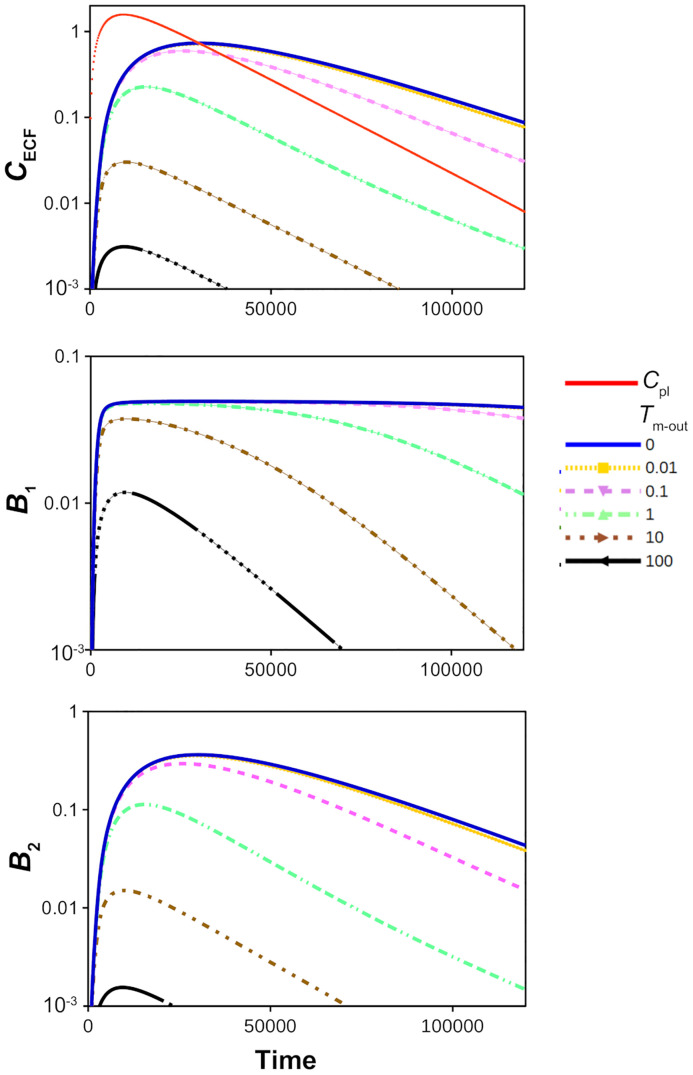
The development of drugs targeting the brain still faces a high failure rate. One of the reasons is a lack of quantitative understanding of the complex processes that govern the pharmacokinetics (PK) of a drug within the brain. While a number of models on drug distribution into and within the brain is available, none of these addresses the combination of factors that affect local drug concentrations in brain extracellular fluid (brain ECF). Here, we develop a 3D brain unit model, which builds on our previous proof-of-concept 2D brain unit model, to understand the factors that govern local unbound and bound drug PK within the brain. The 3D brain unit is a cube, in which the brain capillaries surround the brain ECF. Drug concentration-time profiles are described in both a blood-plasma-domain and a brain-ECF-domain by a set of differential equations. The model includes descriptions of blood plasma PK, transport through the blood-brain barrier (BBB), by passive transport via paracellular and transcellular routes, and by active transport, and drug binding kinetics. The impact of all these factors on ultimate local brain ECF unbound and bound drug concentrations is assessed. In this article we show that all the above mentioned factors affect brain ECF PK in an interdependent manner. This indicates that for a quantitative understanding of local drug concentrations within the brain ECF, interdependencies of all transport and binding processes should be understood. To that end, the 3D brain unit model is an excellent tool, and can be used to build a larger network of 3D brain units, in which the properties for each unit can be defined independently to reflect local differences in characteristics of the brain.


Conflict of interest statement

The authors have declared that no competing interests exist.

Figures

Fig 1
Fig 1. Sketch of the 3D model brain unit.
Left: The structure represented by the 3D brain unit. An arteriole carries blood plasma (containing drug) into a brain capillary bed, that is connected to a venule that drains the blood plasma. The brain capillaries (red) surround the brain ECF (blue). Middle: the 3D brain unit and its sub-domains. The unit consists of a brain-ECF-domain (blue) and a blood-plasma-domain (red). The blood-plasma-domain is divided into several subdomains: Uin is the domain where the dose of absorbed drug enters the 3D brain unit, Ux1-x4, Uy1-y4 and Uz1-z4 are the domains representing the x-directed, y-directed and z-directed capillaries, respectively. Right: Directions of transport in the model. The drug enters the brain capillaries in Uin. From there, it is transported through the brain capillaries by the brain capillary blood flow in the direction indicated by the small arrows. Drug in the brain capillary blood plasma exchanges with the brain ECF by crossing the BBB. Drug within the brain ECF is, next to diffusion, transported along with brain ECF bulk flow (indicated by the bold arrow).
Fig 2
Fig 2. Front view of the 3D brain unit.
Definitions of Upl are given. The x-directed, y-directed and z-capillaries are divided by the lines x = y (or y = z or x = z) and x+y = yr (or y+z = zr or x+z = zr). The only exceptions for this are the brain capillaries adjacent to Uin and the brain capillaries adjacent to Uout.
Fig 3
Fig 3. The effect of the brain capillary blood flow velocity, vblood (m s-1), on the log PK of Cpl (red) and CECF (top), B1 (middle) and B2 (bottom) for a default (P = 0.1⋅10-7m s-1) (left) and a high (P = 100⋅10-7m s-1) (right) value of P.
Values of vblood are set at 0.05⋅10-4 m s-1, 0.5⋅10-4 m s-1, 5⋅10-4 m s-1, 50⋅10-4 m s-1 and 500⋅10-4 m s-1, as is depicted by different colours, where drug concentrations for the default value of vblood (vblood = 5⋅10-4 m s-1) are shown in blue. All other parameters are as in Table 2. The insets in each sub-figure show the PK for a shorter time.
Fig 4
Fig 4. Changes in Cpl and CECF due to the effect of vblood.
While vblood is varied from 0.05⋅10-4 m s-1 to 50⋅10-4 m s-1, all other parameter values are as in Table 2. a) The pathway from Uin to Uout along which Cpl is plotted. b) Cpl is plotted against time (timepoints from 5 to 25) along the distance shown in (a). c) Distribution profiles of Cpl (red) and CECF (blue) of the 3D brain unit at t = 5. Darker shades of red and blue correspond to higher values of Cpl and CECF, respectively.
Fig 5
Fig 5. The effect of active influx on the log concentration-time profiles of drug in the brain ECF, relative to those in the blood plasma.
Top: unbound drug in the brain ECF (CECF) compared to unbound drug in the blood plasma (Cpl, red curve). Middle: drug bound to its target sites (B1). Bottom: drug bound to non-specific binding sites (B2). The value of Tm-in is changed from 0 to 100⋅10-7 μmol s-1. The rest of the parameters are as in Table 2.
Fig 6
Fig 6. The effect of active efflux on the log concentration-time profiles of drug in the brain ECF, relative to those in the blood plasma.
Top: unbound drug in the brain ECF (CECF) and unbound drug in the blood plasma (Cpl, red curve). Middle: drug bound to its target sites (B1). Bottom: drug bound to non-specific binding sites (B2). The value of Tm-out is changed from 0 to 100⋅10-7 μmol s-1. The rest of the parameters are as in Table 2.
Fig 7
Fig 7. The log concentration-time profiles of unbound drug in brain ECF (CECF) with 1000x increased permeability P (left to right, 0.1⋅10-7 m s-1 to 100⋅10-7 m s-1) or 10x decreased flow vECF (top to bottom, 5⋅10-4m s-1 to 0.5⋅10-4 m s-1) in the presence of active influx compared to the concentration of unbound drug in the blood plasma (Cpl, red curve).
The value of of Tm-in is changed from 0 to 100⋅10-7 μmol s-1, as depicted by various colours. The rest of the parameters are as in Table 2.
Fig 8
Fig 8. The PK on log-scale of unbound drug in brain ECF (CECF) with 1000x increased permeability P (left to right, 0.1⋅10-7 m s-1 to 100⋅10-7 m s-1) and 10x decreased blood flow velocity vblood (top to bottom, 5⋅10-4 m s-1 to 0.5⋅10-4 m s-1) in the presence of active efflux compared to the concentration of unbound drug in the blood plasma (Cpl, red curve).
The value of Tm-out is changed from 0 to 100⋅10-7 μmol s-1, as indicated by the different colours. The rest of the parameters are as in Table 2.
Fig 9
Fig 9. The distribution profiles at cross-sections (at y=12yr) of the 3D brain unit at t = 5 of unbound drug in brain ECF with lower brain capillary blood flow velocity (vblood = 0.5⋅10-4 m s-1, middle column), higher passive BBB permeability (P = 100⋅10-7 m s-1, right column), presence of active influx (middle row, Tm-in = 1⋅10-7 μmol s-1) and presence of active efflux (bottom row, Tm-out = 1⋅10-7 μmol s-1) at t = 5.
Parameters are as in Table 2.
Fig 10
Fig 10. Values of CECF (10-3 μ mol L-1) at several locations within the brain unit for different values of P and vblood at t = 500.
a) Locations within the 3D brain unit. Corner 1: (x,y,z) = (r,r,r), Corner 2: (x,y,z) = (xr-r,yr-r,zr-r), Edge: (x,y,z) = (0, yr2,zr2), Middle: (x,y,z) = (xr2,yr2,zr2). b) Values of CECF are shown for a low ((P = 0.01⋅10-8 m s-1), default (P = 0.1⋅10-8 m s-1) and high (P = 1⋅10-8 m s-1) value of P in the top, middle and bottom table, respectively. Within each table, concentrations are given for several values of vblood (vblood = 0.5⋅10-4 m s-1, vblood = 5⋅10-4 m s-1 and vblood = 50⋅10-4 m s-1, left to right), Tm-in (Tm-in = 0, Tm-in = 1⋅10-7 μmol s-1, Tm-in = 10⋅10-7 μmol s-1 and Tm-in = 100⋅10-7 μmol s-1) and Tm-out (Tm-out = 0, Tm-out = 1⋅10-7 μmol s-1, Tm-out = 10⋅10-7 μmol s-1 and Tm-out = 100⋅10-7 μmol s-1) at different locations. When Tm-in is changed, Tm-out = 0 and vice versa. c) Colour legend. In each table, colours are relative to the value of CECF in the middle of the unit in the absence of active transport for vblood = 5⋅10-4 m s-1, of which the colour is denoted by “Default”. The intensity of green corresponds to the extent of increase, and the intensity of red corresponds to the extent of decrease of CECF compared to the default. Other parameters are as in Table 2.

References

    1. Vendel E, Rottschäfer V, de Lange ECM. The need for mathematical modelling of spatial drug distribution within the brain. Fluids and Barriers of the CNS. 2019;16(12). 10.1186/s12987-019-0133-x - DOI - PMC - PubMed
    1. Summerfield SG, Stevens AJ, Cutler L, del Carmen Osuna M, Hammond B, Tang SP, et al. Improving the in Vitro Prediction of in Vivo Central Nervous System Penetration: Integrating Permeability, P-glycoprotein Efflux, and Free Fractions in Blood and Brain. The Journal of Pharmacology and Experimental Therapeutics. 2006;316(3):1282–1290. 10.1124/jpet.105.092916 - DOI - PubMed
    1. Summerfield SG, Lucas AJ, Porter RA, Jeffrey P, Gunn RN, Read KR, et al. Toward an improved prediction of human in vivo brain penetration. Xenobiotica. 2008;38(12):1518–1535. 10.1080/00498250802499459 - DOI - PubMed
    1. Tsuji A. Small molecular drug transfer across the blood-brain barrier via carrier-mediated transport systems. NeuroRx: the journal of the American Society for Experimental NeuroTherapeutics. 2005;2(1):54–62. 10.1602/neurorx.2.1.54 - DOI - PMC - PubMed
    1. van Bree JB, de Boer AG, Danhof M, Ginsel LA, Breimer DD. Characterization of an “in vitro” blood-brain barrier: effects of molecular size and lipophilicity on cerebrovascular endothelial transport rates of drugs. Journal of Pharmacology and Experimental Therapeutics. 1988;247(3):1233–1239. - PubMed

Substances