

TRI microparticles prevent inflammatory arthritis in a collagen-induced arthritis model
- PMID: 32966314
- PMCID: PMC7510963
- DOI: 10.1371/journal.pone.0239396
TRI microparticles prevent inflammatory arthritis in a collagen-induced arthritis model
Abstract
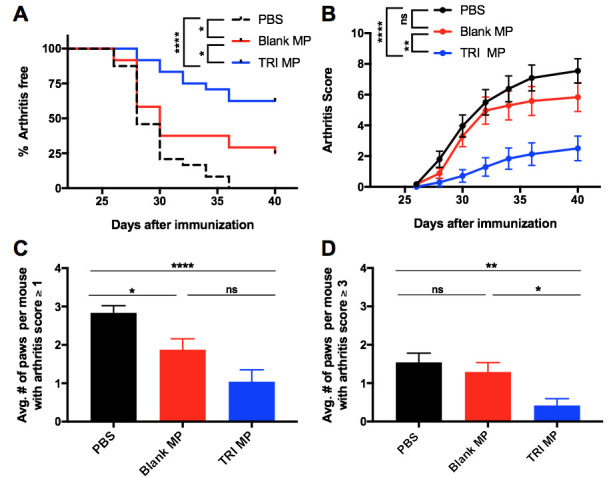
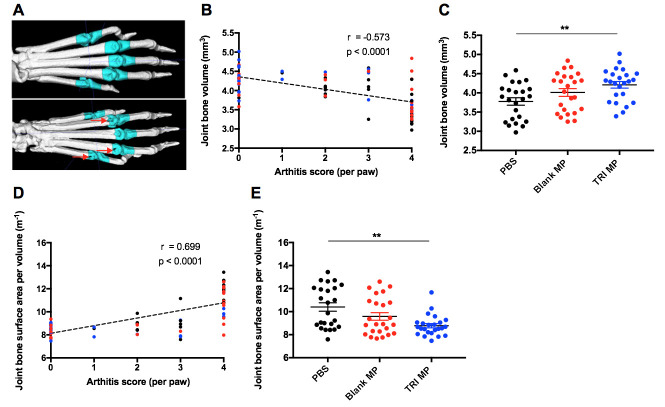
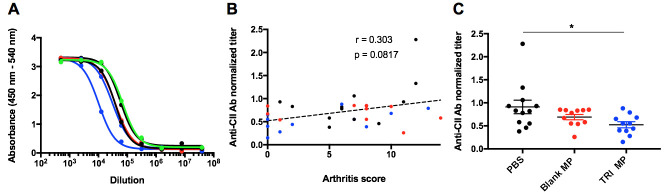
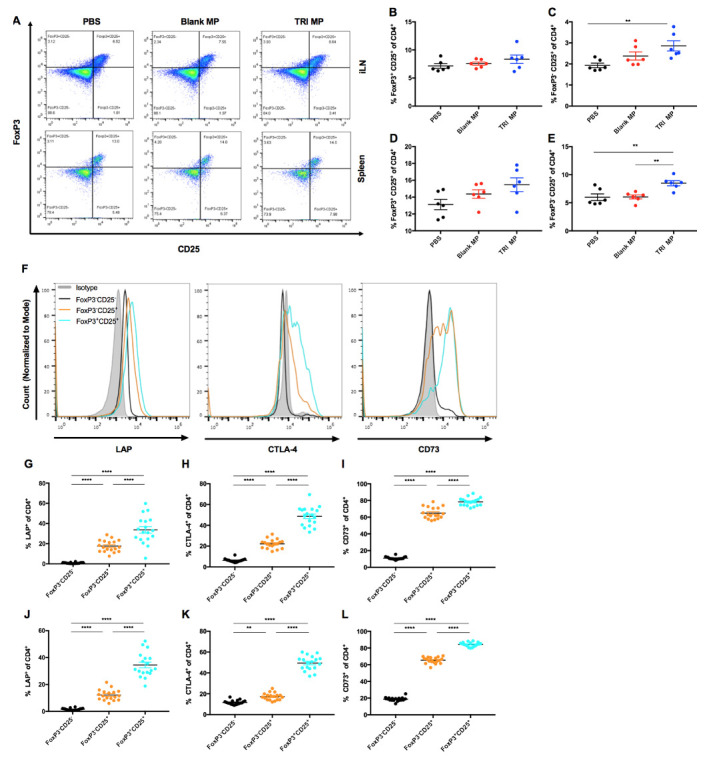
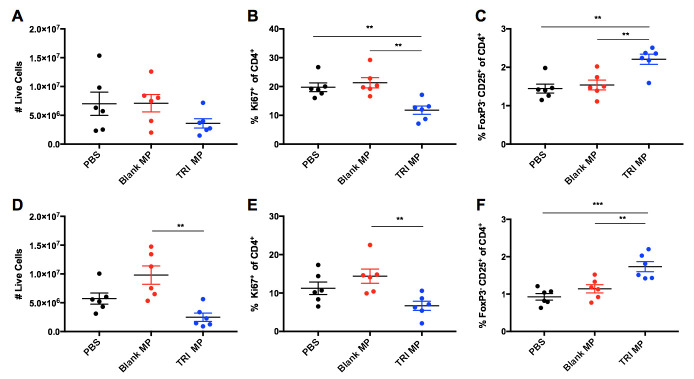
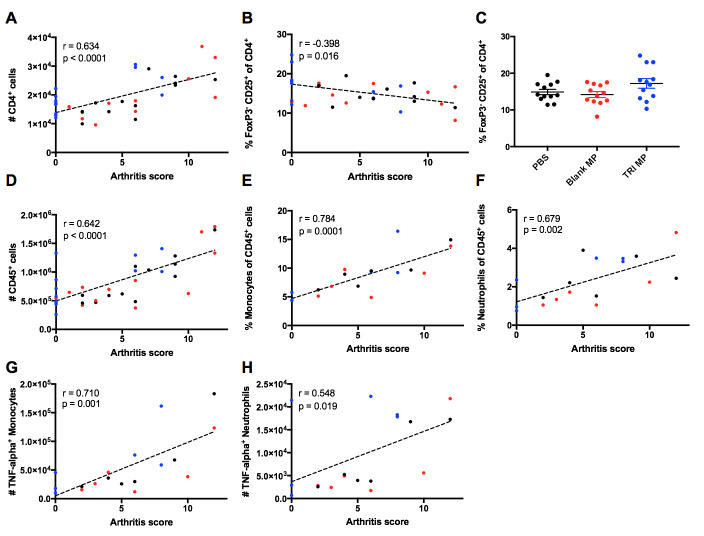
Despite recent progress in the treatment of rheumatoid arthritis (RA), many patients still fail to achieve remission or low disease activity. An imbalance between auto-reactive effector T cells (Teff) and regulatory T cells (Treg) may contribute to joint inflammation and damage in RA. Therefore, restoring this balance is a promising approach for the treatment of inflammatory arthritis. Accordingly, our group has previously shown that the combination of TGF-β-releasing microparticles (MP), rapamycin-releasing MP, and IL-2-releasing MP (TRI MP) can effectively increase the ratio of Tregs to Teff in vivo and provide disease protection in several preclinical models. In this study TRI MP was evaluated in the collagen-induced arthritis (CIA) model. Although this formulation has been tested previously in models of destructive inflammation and transplantation, this is the first model of autoimmunity for which this therapy has been applied. In this context, TRI MP effectively reduced arthritis incidence, the severity of arthritis scores, and bone erosion. The proposed mechanism of action includes not only reducing CD4+ T cell proliferation, but also expanding a regulatory population in the periphery soon after TRI MP administration. These changes were reflected in the CD4+ T cell population that infiltrated the paws at the onset of arthritis and were associated with a reduction of immune infiltrate and inflammatory myeloid cells in the paws. TRI MP administration also reduced the titer of collagen antibodies, however the contribution of this reduced titer to disease protection remains uncertain since there was no correlation between collagen antibody titer and arthritis score.
Conflict of interest statement
The authors declare the following competing interests: S.R.L. is an inventor on patent 14/372,977 entitled “Controlled Release Formulations for the Induction and Proliferation of Blood Cells” which was issued to the University of Pittsburgh on 04/30/20. This patent covers the TRI MP formulation used in this manuscript. All other authors declare they have no competing interests. This does not alter our adherence to PLOS ONE policies on sharing data and materials.
Figures
Similar articles
-
Protection against cartilage and bone destruction by systemic interleukin-4 treatment in established murine type II collagen-induced arthritis.Arthritis Res. 1999;1(1):81-91. doi: 10.1186/ar14. Epub 1999 Oct 26. Arthritis Res. 1999. PMID: 11056663 Free PMC article.
-
Efficient Therapeutic Function and Mechanisms of Human Polyclonal CD8+CD103+Foxp3+ Regulatory T Cells on Collagen-Induced Arthritis in Mice.J Immunol Res. 2019 Feb 19;2019:8575407. doi: 10.1155/2019/8575407. eCollection 2019. J Immunol Res. 2019. PMID: 30915372 Free PMC article.
-
IL-2-Anti-IL-2 Monoclonal Antibody Immune Complexes Inhibit Collagen-Induced Arthritis by Augmenting Regulatory T Cell Functions.J Immunol. 2018 Oct 1;201(7):1899-1906. doi: 10.4049/jimmunol.1701502. Epub 2018 Aug 24. J Immunol. 2018. PMID: 30143591
-
Antigen-specific transforming growth factor β-induced Treg cells, but not natural Treg cells, ameliorate autoimmune arthritis in mice by shifting the Th17/Treg cell balance from Th17 predominance to Treg cell predominance.Arthritis Rheum. 2012 Aug;64(8):2548-58. doi: 10.1002/art.34513. Arthritis Rheum. 2012. PMID: 22605463 Free PMC article.
-
Type II collagen autoimmunity in a mouse model of human rheumatoid arthritis.Autoimmun Rev. 2007 Nov;7(1):65-70. doi: 10.1016/j.autrev.2007.08.001. Epub 2007 Aug 30. Autoimmun Rev. 2007. PMID: 17967728 Review.
Cited by
-
ABCD of IA: A multi-scale agent-based model of T cell activation in inflammatory arthritis.Biomater Sci. 2024 Apr 16;12(8):2041-2056. doi: 10.1039/d3bm01674a. Biomater Sci. 2024. PMID: 38349277 Free PMC article.
-
Immunomodulatory Microparticles Epigenetically Modulate T Cells and Systemically Ameliorate Autoimmune Arthritis.Adv Sci (Weinh). 2023 Apr;10(11):e2202720. doi: 10.1002/advs.202202720. Epub 2023 Mar 8. Adv Sci (Weinh). 2023. PMID: 36890657 Free PMC article.
-
Current Immunotherapy Strategies for Rheumatoid Arthritis: The Immunoengineering and Delivery Systems.Research (Wash D C). 2023 Oct 17;6:0220. doi: 10.34133/research.0220. eCollection 2023. Research (Wash D C). 2023. PMID: 39902178 Free PMC article. Review.
-
Local delivery strategies to restore immune homeostasis in the context of inflammation.Adv Drug Deliv Rev. 2021 Nov;178:113971. doi: 10.1016/j.addr.2021.113971. Epub 2021 Sep 13. Adv Drug Deliv Rev. 2021. PMID: 34530013 Free PMC article. Review.
-
The therapeutic potential of immunoengineering for systemic autoimmunity.Nat Rev Rheumatol. 2024 Apr;20(4):203-215. doi: 10.1038/s41584-024-01084-x. Epub 2024 Feb 21. Nat Rev Rheumatol. 2024. PMID: 38383732 Review.
References
-
- Lundkvist J, Kastäng F, Kobelt G. The burden of rheumatoid arthritis and access to treatment: Health burden and costs. Eur J Heal Econ. 2008. January;8(SUPPL. 8):S49–60. - PubMed
Publication types
MeSH terms
Substances
Grants and funding
LinkOut - more resources
Full Text Sources
Other Literature Sources
Research Materials
