

Information integration and decision making in flowering time control
- PMID: 32966329
- PMCID: PMC7511014
- DOI: 10.1371/journal.pone.0239417
Information integration and decision making in flowering time control
Abstract
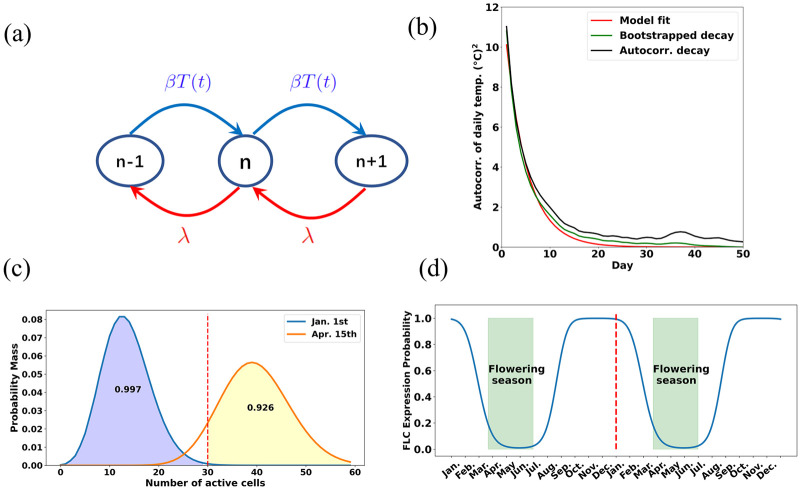
In order to successfully reproduce, plants must sense changes in their environment and flower at the correct time. Many plants utilize day length and vernalization, a mechanism for verifying that winter has occurred, to determine when to flower. Our study used available temperature and day length data from different climates to provide a general understanding how this information processing of environmental signals could have evolved in plants. For climates where temperature fluctuation correlations decayed exponentially, a simple stochastic model characterizing vernalization was able to reconstruct the switch-like behavior of the core flowering regulatory genes. For these and other climates, artificial neural networks were used to predict flowering gene expression patterns. For temperate plants, long-term cold temperature and short-term day length measurements were sufficient to produce robust flowering time decisions from the neural networks. Additionally, evolutionary simulations on neural networks confirmed that the combined signal of temperature and day length achieved the highest fitness relative to neural networks with access to only one of those inputs. We suggest that winter temperature memory is a well-adapted strategy for plants' detection of seasonal changes, and absolute day length is useful for the subsequent triggering of flowering.
Conflict of interest statement
The authors have declared that no competing interests exist.
Figures


Similar articles
-
Experiencing winter for spring flowering: A molecular epigenetic perspective on vernalization.J Integr Plant Biol. 2020 Jan;62(1):104-117. doi: 10.1111/jipb.12896. J Integr Plant Biol. 2020. PMID: 31829495 Review.
-
The molecular basis of vernalization in different plant groups.Cold Spring Harb Symp Quant Biol. 2012;77:105-15. doi: 10.1101/sqb.2013.77.014449. Epub 2013 Apr 25. Cold Spring Harb Symp Quant Biol. 2012. PMID: 23619014 Review.
-
Seasonal and developmental timing of flowering.Plant J. 2010 Mar;61(6):1001-13. doi: 10.1111/j.1365-313X.2010.04148.x. Plant J. 2010. PMID: 20409274 Review.
-
The role of cold cues at different life stages on germination and flowering phenology.Am J Bot. 2018 Apr;105(4):749-759. doi: 10.1002/ajb2.1055. Epub 2018 Apr 23. Am J Bot. 2018. PMID: 29683478
-
The quantitative response of wheat vernalization to environmental variables indicates that vernalization is not a response to cold temperature.J Exp Bot. 2012 Jan;63(2):847-57. doi: 10.1093/jxb/err316. Epub 2011 Oct 12. J Exp Bot. 2012. PMID: 21994169
Cited by
-
Feeling Every Bit of Winter - Distributed Temperature Sensitivity in Vernalization.Front Plant Sci. 2021 Jan 27;12:628726. doi: 10.3389/fpls.2021.628726. eCollection 2021. Front Plant Sci. 2021. PMID: 33584778 Free PMC article. Review.
-
CIRCADIAN CLOCK-ASSOCIATED1 Delays Flowering by Directly Inhibiting the Transcription of BcSOC1 in Pak-choi.Plants (Basel). 2024 Aug 8;13(16):2190. doi: 10.3390/plants13162190. Plants (Basel). 2024. PMID: 39204626 Free PMC article.
-
Plant environmental memory: implications, mechanisms and opportunities for plant scientists and beyond.AoB Plants. 2023 Jun 6;15(4):plad032. doi: 10.1093/aobpla/plad032. eCollection 2023 Jul. AoB Plants. 2023. PMID: 37415723 Free PMC article. Review.
-
Identification of Flowering Regulatory Networks and Hub Genes Expressed in the Leaves of Elymus sibiricus L. Using Comparative Transcriptome Analysis.Front Plant Sci. 2022 May 16;13:877908. doi: 10.3389/fpls.2022.877908. eCollection 2022. Front Plant Sci. 2022. PMID: 35651764 Free PMC article.
References
Publication types
MeSH terms
LinkOut - more resources
Full Text Sources
