. 2020 Nov 3;32(5):829-843.e9.
doi: 10.1016/j.cmet.2020.09.001. Epub 2020 Sep 22.

Bone Marrow Mesenchymal Stem Cells Support Acute Myeloid Leukemia Bioenergetics and Enhance Antioxidant Defense and Escape from Chemotherapy

Affiliations

Bone Marrow Mesenchymal Stem Cells Support Acute Myeloid Leukemia Bioenergetics and Enhance Antioxidant Defense and Escape from Chemotherapy

Dorian Forte et al. Cell Metab. .

Abstract

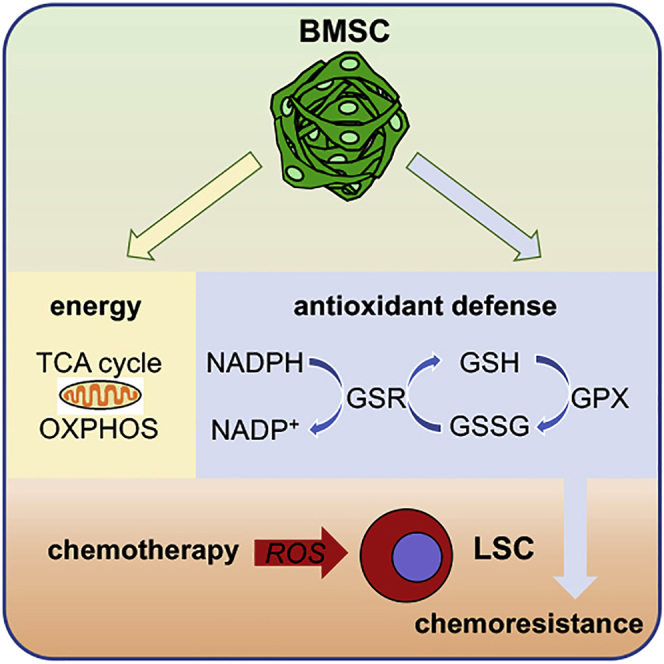
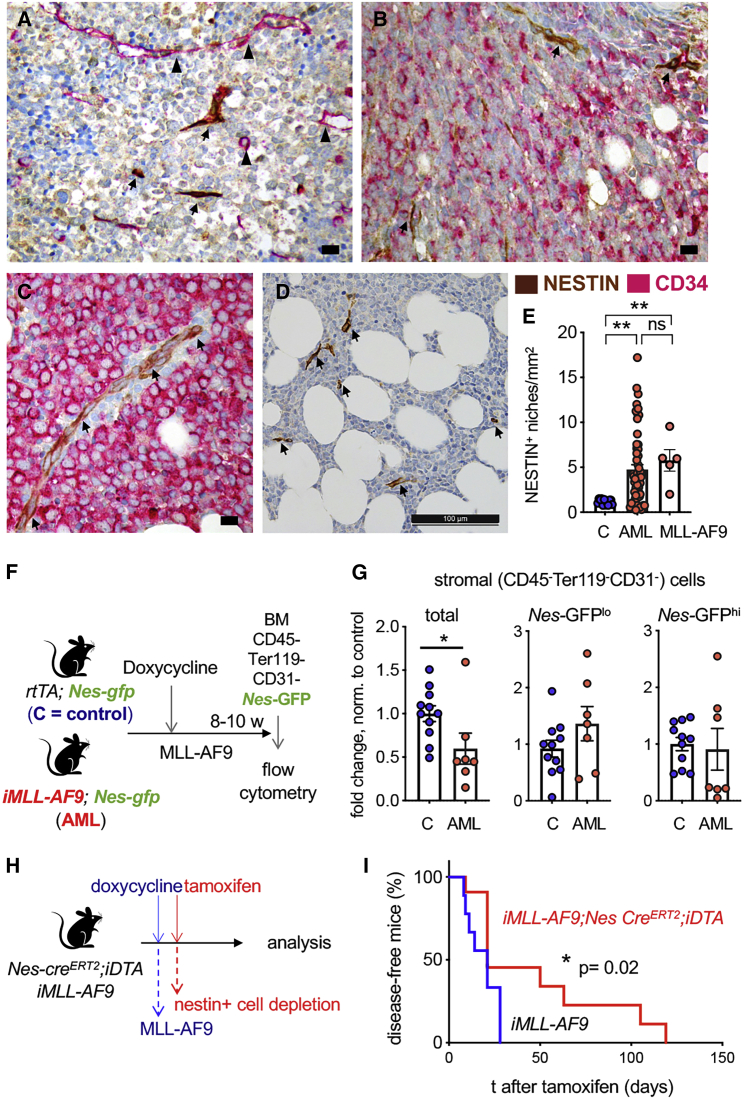
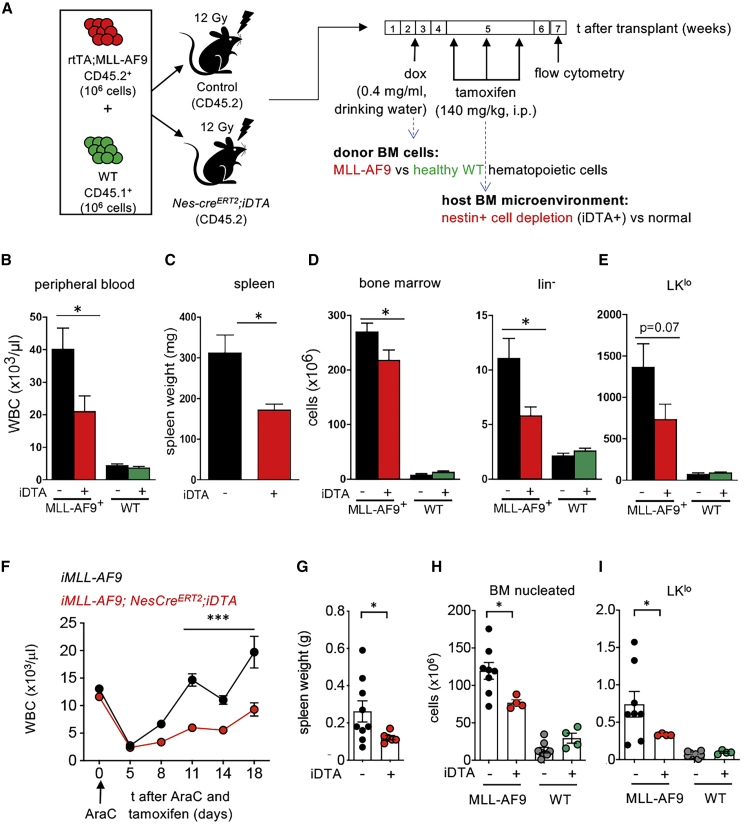
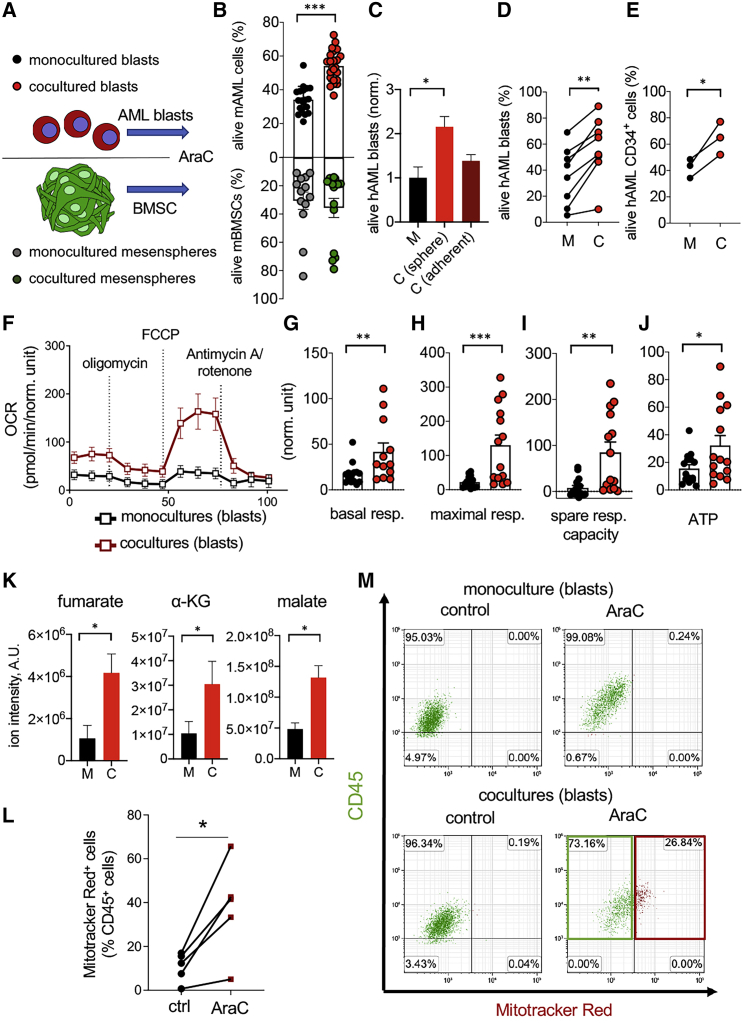
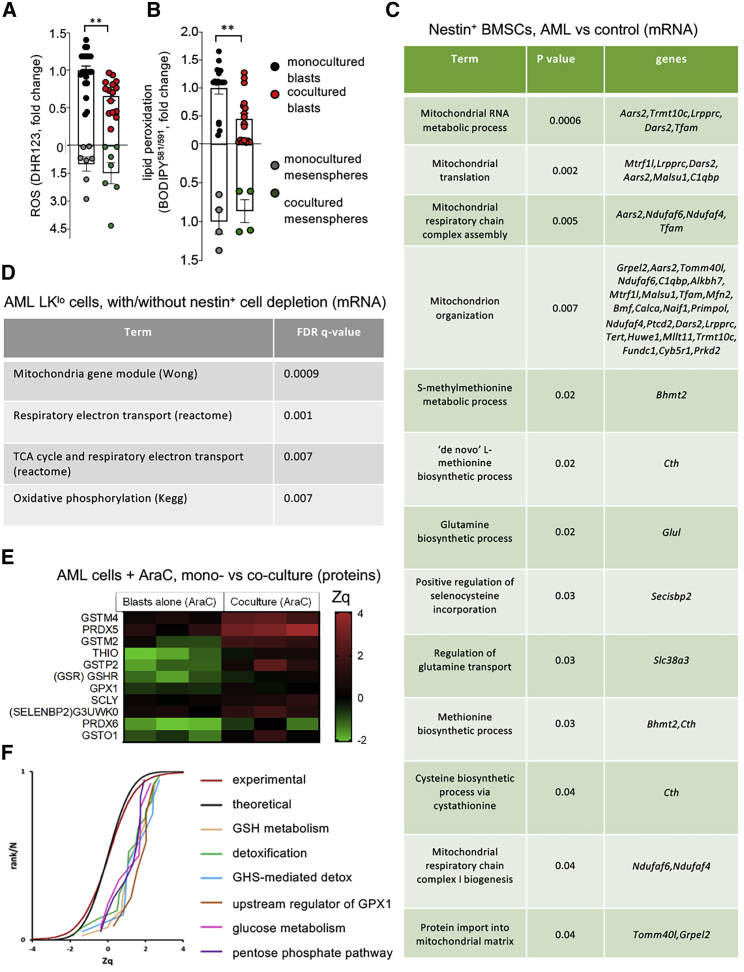
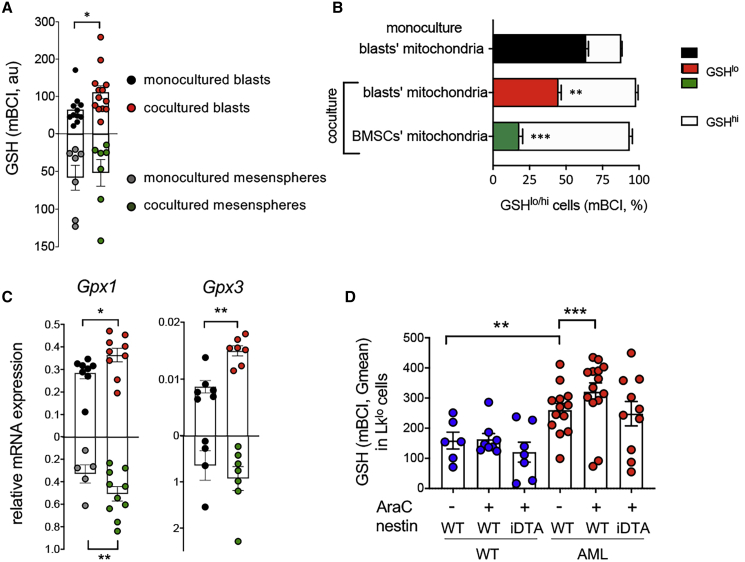
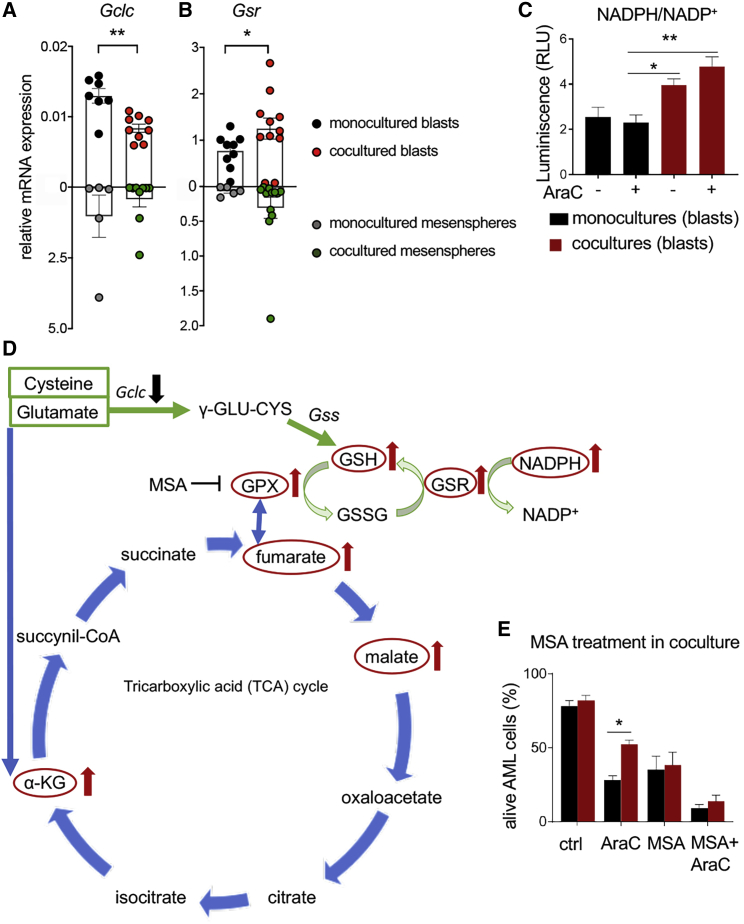
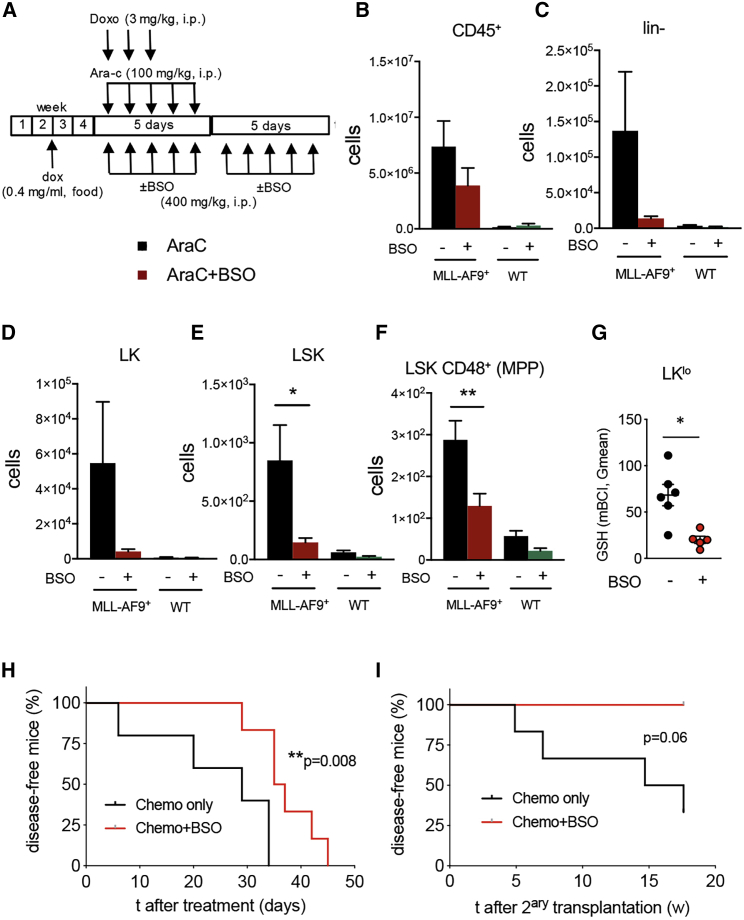
Like normal hematopoietic stem cells, leukemic stem cells depend on their bone marrow (BM) microenvironment for survival, but the underlying mechanisms remain largely unknown. We have studied the contribution of nestin+ BM mesenchymal stem cells (BMSCs) to MLL-AF9-driven acute myeloid leukemia (AML) development and chemoresistance in vivo. Unlike bulk stroma, nestin+ BMSC numbers are not reduced in AML, but their function changes to support AML cells, at the expense of non-mutated hematopoietic stem cells (HSCs). Nestin+ cell depletion delays leukemogenesis in primary AML mice and selectively decreases AML, but not normal, cells in chimeric mice. Nestin+ BMSCs support survival and chemotherapy relapse of AML through increased oxidative phosphorylation, tricarboxylic acid (TCA) cycle activity, and glutathione (GSH)-mediated antioxidant defense. Therefore, AML cells co-opt energy sources and antioxidant defense mechanisms from BMSCs to survive chemotherapy.

Keywords: OXPHOS; TCA cycle; acute myeloid leukemia; antioxidant; bone marrow mesenchymal stem cells; chemotherapy; glutathione; hematopoietic stem cell niche; metabolic adaptation; microenvironment.


Conflict of interest statement

Declaration of Interests The authors declare no competing interests.

Figures

None
Graphical abstract
Figure 1
Figure 1
Unlike Bulk BM Stromal Cells, Nestin+ Niche Cells Are Preserved in Human and Murine AML and Promote Leukemogenesis (A–D) Representative examples of immunohistochemistry for human NESTIN (brown) and human CD34 (pink) in BM samples from AML patients. CD34− AML (A), CD34+ AML ([B] and [C]), and MLL-AF9+ AML (D) show increased NESTIN+ niches (arrows) and CD34+ vessels (arrowheads). Scale bar, 10 μm (A–C), 100 μm (D). (E) Quantification of NESTIN+ niches from (A and B) (control n = 12; MLL-AF9− AML n = 56; MLL-AF9+ AML n = 5). p < 0.05, ∗∗p < 0.01, one-way ANOVA and Bonferroni comparisons. (F) Scheme showing the induction of AML in primary, non-transplanted Nes-GFP mice to study BMSC changes during leukemogenesis. (G) Fold change in the number of BM stromal cells (CD45− Ter119−CD31−) and BMSCs expressing low or high levels of Nes-GFP (NesGFPlow/high) in the BM of control (C) Nes-GFP;rtTA mice and Nes-GFP;rtTA;iMLL-AF9 (AML) mice. Numbers were normalized with the average of WT controls in each independent experiment. Mice were analyzed 8–10 weeks after inducing MLL-AF9 expression. Dots represent data from individual mice (n = 2 independent experiments). Data are mean ± SEM. Unpaired two-tailed t test. (H) Scheme showing experimental depletion of nestin+ cells in primary, non-transplanted leukemic mice. MLL-AF9 expression (iMLL-AF9) is induced with doxycycline. (I) Nestin+ cell depletion extends AML mouse survival. Kaplan-Meier survival curve of primary iMLL-AF9 mice in control group (black, n = 9) or after nestin+ cell depletion (red, n = 11). Logrank test.
Figure 2
Figure 2
Nestin+ Cells Promote Leukemia Chemoresistance In Vivo (A) Scheme showing the experimental setting to simultaneously study the impact of nestin+ cell depletion on healthy and leukemic hematopoietic cells. Lethally irradiated CD45.2 control mice or Nes-creERT2;iDTA mice were transplanted with 106 iAML (rtTA;MLL-AF9) CD45.2+ BM nucleated cells and 106 CD45.1+ WT BM nucleated cells. Doxycycline administration started 2 weeks after transplant; tamoxifen was administered 4 weeks post-transplant and mice were sacrificed and analyzed 4 weeks later. (B–D) Number of WT and MLL-AF9+ WBC (B), spleen weight (C), BM nucleated, and lineage-negative cells (D). (E) BM lin−ckitlosca1− (LKlo) cells. Data in (D and E) represent the cellularity of 4 limbs, sternum, and spine (n = 18 mice/group, pooled from 3 independent experiments). (F–I) Nestin+ cells support chemoresistance in AML mice. (F) WBCs, (G) spleen weight, (H) BM nucleated cells, and (I) LKlo cells in control (iDTA−) or Nes-creERT2;iDTA (iDTA+) mice transplanted with a mixture of WT and iMLL-AF9 BM cells, receiving tamoxifen and AraC treatment simultaneously, as in Figure S1A (n = 4–8). Dots represent data from individual mice. Data are mean ± SEM. p < 0.05; ∗∗∗p < 0.001; unpaired two-tailed t test.
Figure 3
Figure 3
BMSCs Support Leukemic Blast Survival, Chemoresistance, and Bioenergetics (A) Scheme showing the different culture conditions and cells tested. (B) Frequency of alive (AnnexinV−DAPI−) cells 24 h after AraC treatment (n = 19). (C) Frequency of alive human AML cells monocultured (M) or cocultured or cocultured (C) with human mesenspheres or adherent BMSCs for 24 h under AraC treatment (n = 3–5). p < 0.05; One-way ANOVA and Bonferroni comparisons. (D and E) Frequency of alive CD45+ (D, n = 8) cells or CD34+ HSPCs (E, n = 3) from human AML BM 24 h after AraC in monoculture (black) or coculture (red) with BMSCs expanded as mesenspheres from AML patients (n = 8). p < 0.05; ∗∗p < 0.01; paired two-tailed t test. (F) OCR indicating mitochondrial respiration after oligomycin, FCCP and antimycin A/rotenone treatment in leukemic blasts cultured alone or previously cocultured with mesenspheres for 24 h in presence of AraC. (G–J) Seahorse measurement of basal respiration (G), maximal respiration (H), spare respiratory capacity (I), and ATP content (J) in murine leukemic blasts monocultured (black columns) or cocultured with BMSCs (red columns); n = 6 independent experiments. Data represent mean ± SEM. p < 0.05; ∗∗p < 0.01; ∗∗∗p < 0.001; unpaired two-tailed t test. (K) Levels of the TCA cycle metabolites fumarate, ɑ-KG, and malate measured by LC-MS in murine leukemic blasts monocultured (black columns) or cocultured with BMSCs (red columns); n = 5 independent experiments with 4 biological replicates each. (L) Frequency of AML blasts uptaking MitoTracker Red+ mitochondria previously stained in BMSCs only, before the coculture with AML cells under AraC treatment; n = 4 independent experiments; p < 0.05; paired two-tailed t test. (M) Representative flow cytometry diagrams showing CD45 (green) and MitoTracker Red (red) fluorescence in murine AML blasts monocultured or cocultured with BMSCs, which were previously stained with MitoTracker Red to label their mitochondria. The frequencies of gated cell populations are indicated. The red box highlights the increased frequency of BMSC-derived mitochondria in AML cells after AraC treatment.
Figure 4
Figure 4
BMSCs Provide Leukemic Blasts with Antioxidant Defense during Chemotherapy (A and B) ROS measured by DH123 staining (A) and lipid peroxidation detected with BODIPY581/591 (B) in AML blasts and BMSCs cultured alone or together for 24 h in presence of AraC. Each dot is a biological replicate. ∗∗p < 0.05; unpaired two-tailed t test. (C) Selected pathways from the GO enrichment analysis of significantly upregulated mRNA (RNA-seq) of CD45−CD31−Ter119−Nes-GFP+ cells isolated from the BM of primary iMLL-AF9 mice or control mice. The GO term, adjusted p value and differentially expressed genes in each category are indicated. (D) Selected pathways from the GSEA analysis of RNA-seq of hematopoietic-lineage-negative ckitlow (LKlo) cells isolated from the BM of AML mice with or without nestin+ cell depletion. Lethally irradiated CD45.2 control mice or Nes-creERT2;iDTA mice were transplanted with 106 iAML (rtTA;MLL-AF9) CD45.2+ BM nucleated cells and 106 CD45.1+ WT BM nucleated cells. Doxycycline administration started 2 weeks after transplant; tamoxifen was administered 4 weeks post-transplant; and mice were sacrificed and analyzed 4 weeks later. BM MLL-AF9+ lin− ckitlow (LKlo) cells were sorted from leukemic mice with or without nestin+ cell depletion. The pathway term, signature, and adjusted p value are indicated. (E) Heatmap showing antioxidant and GSH related among the top upregulated (red) protein pathways detected by proteomics in AraC-treated AML blasts cultured alone or cocultured with mesenspheres for 24 h. Quantitative proteomics results were analyzed using the WSPP statistical model (Navarro et al., 2014) and expressed in log2 fold change values in units of SD (Zq) with respect to baseline. Significant protein changes (adjusted p < 0.05) are indicated; two-sided Fisher test, 3 biological replicates in each condition. (F) SBT analysis (García-Marqués et al., 2016) to detect changes in functional categories due to coordinated protein behavior. The analysis detected significantly increased pathways (positive values of Zq indicate increased protein changes) compared with the theoretical N(0,1) distribution (black curve); for comparison, the distribution of Zq values of all the proteome is also shown (red curve). The panel displays the cumulative distributions of Zq from proteins belonging to a set of representative altered categories, showing the high coordination of protein responses in these pathways.
Figure 5
Figure 5
BMSC-Dependent GSH-Related Pathways Protect AML Cells from Chemotherapy (A) Reduced glutathione (GSH) measured by mBCI staining in AML blasts and BMSCs cultured alone or together for 24 h in presence of AraC. (B) Frequency of AraC-treated GSHlo/hi AML cells monocultured (upper bar) or cocultured with BMSCs (middle and lower bar), separating leukemic blasts, which contain mitochondria derived from previously labeled BMSCs (lower bar) from those containing only blasts’ mitochondria (middle and upper bars); n = 4–5. (C) mRNA expression of Gpx1 and Gpx3 in AML blasts and BMSCs cultured alone or together for 24 h in presence of AraC. (D) GSH measured by mBCI staining in LKlo WT or iMLL-AF9 cells from mice with/without nestin+ cell depletion (Nes-creERT2;iDTA and control littermates) treated as in Figure S3H. Mice were treated with standard chemotherapy (AraC+) or vehicle (AraC−). (A, C, and D) Each dot represents a biological replicate. Data represent mean ± SEM. p < 0.05; ∗∗p < 0.01; ∗∗∗p < 0.001. Unpaired two-tailed t test. (B and D) One-way ANOVA followed by pairwise Bonferroni comparisons.
Figure 6
Figure 6
BMSCs Protect Leukemic Blasts from Chemotherapy through GSH Recycling and Oxidation by Gpx (A and B) mRNA expression of the genes encoding (A) the catalytic subunit of gamma-glutamylcysteine synthetase (Gclc), which is the first rate-limiting enzyme of GSH synthesis, and (B) GSH reductase (Gsr), required for GSH recycling in AML blasts and BMSCs, cultured alone (black, blasts; gray, BMSCs) or together (red, blasts; green, BMSCs) for 24 h in presence of AraC. Each dot is a biological replicate. (C) NADPH/NADP+ ratio in sorted CD45+ leukemic blasts after monoculture (black) or coculture with BMSCs (red), in the presence/absence of AraC (n = 3). (D) Schematic representation of the TCA cycle and glutathione redox cycle, indicating with arrows upregulated (red) and downregulated (black) molecules in coculture. (E) Frequency of alive (AnnexinV−DAPI−) AML cells 24 h after treatment of monoculture (black) or cocultured (red) cells with vehicle (ctrl), AraC, the Gpx inhibitor mercaptosuccinic acid (MSA, 1.6 mM) or both drugs (n = 6). (B–E) Data represent mean ± SEM. p < 0.05; ∗∗p < 0.01; ∗∗∗p < 0.001. (B and C) Unpaired 2-tailed t test. (D–F) One-way ANOVA followed by pairwise Bonferroni comparisons.
Figure 7
Figure 7
GSH Depletion Synergizes with Conventional Chemotherapy to Reduce AML Cells In Vivo (A) Experimental outline combination therapy in chimeric mice generated as depicted in Figure 3A. Lethally irradiated WT recipients were transplanted with 106 iMLL-AF9;CD45.2+ BM cells and 106 WT CD45.1+ BM cells. After two weeks, leukemia was induced by doxycycline in the food. Upon AML development, mice were treated with AraC-doxorubicin (Chemo) and BSO or vehicle for 10 days before flow cytometry analysis. (B–F) BM leukemic (MLL-AF9+) or WT (B) CD45+ cells, (C) hematopoietic-lineage-negative (lin) cells, (D) linckit+sca1 (LK) cells, (E) linckit+sca1+ (LSK) cells, and (F) LSK CD48+ multipotent progenitors (MPP). (G) GSH measured by mBCI staining in lin-ckitlow (LKlo) AML cells from mice treated with combined BSO therapy (red) or with standard induction chemotherapy only (black). Each dot represents a mouse. (B–G) Data are mean ± SEM. p < 0.05; ∗∗p < 0.01; unpaired two-tailed t test. (H) Disease-free AML mice treated with combined BSO therapy (red) or with standard induction chemotherapy only (black; n = 6). (I) Disease-free mice after lethal irradiation and transplantation of BM cells from mice in (H) (n = 4–6). Recipient mice were fed with doxycycline-containing pellets. (H and I) Logrank test.

References

    1. Amarante-Mendes G.P., Naekyung Kim C., Liu L., Huang Y., Perkins C.L., Green D.R., Bhalla K. Bcr-abl exerts its antiapoptotic effect against diverse apoptotic stimuli through blockage of mitochondrial release of cytochrome C and activation of caspase-3. Blood. 1998;91:1700–1705. - PubMed
    1. Arranz L., Sánchez-Aguilera A., Martín-Pérez D., Isern J., Langa X., Tzankov A., Lundberg P., Muntión S., Tzeng Y.-S., Lai D.-M. Neuropathy of haematopoietic stem cell niche is essential for myeloproliferative neoplasms. Nature. 2014;512:78–81. - PubMed
    1. Baccelli I., Gareau Y., Lehnertz B., Gingras S., Spinella J.F., Corneau S., Mayotte N., Girard S., Frechette M., Blouin-Chagnon V. Mubritinib targets the electron transport chain complex I and reveals the landscape of OXPHOS dependency in acute myeloid leukemia. Cancer Cell. 2019;36:84–99.e8. - PubMed
    1. Balordi F., Fishell G. Mosaic removal of hedgehog signaling in the adult SVZ reveals that the residual wild-type stem cells have a limited capacity for self-renewal. J. Neurosci. 2007;27:14248–14259. - PMC - PubMed
    1. Barrera G. Oxidative stress and lipid peroxidation products in cancer progression and therapy. ISRN Oncol. 2012;2012:137289. - PMC - PubMed

Publication types