. 2021 Jan 7;28(1):112-126.e6.
doi: 10.1016/j.stem.2020.08.014. Epub 2020 Sep 22.

Human Stem Cell-Derived Neurons Repair Circuits and Restore Neural Function

Affiliations

Human Stem Cell-Derived Neurons Repair Circuits and Restore Neural Function

Man Xiong et al. Cell Stem Cell. .

Abstract

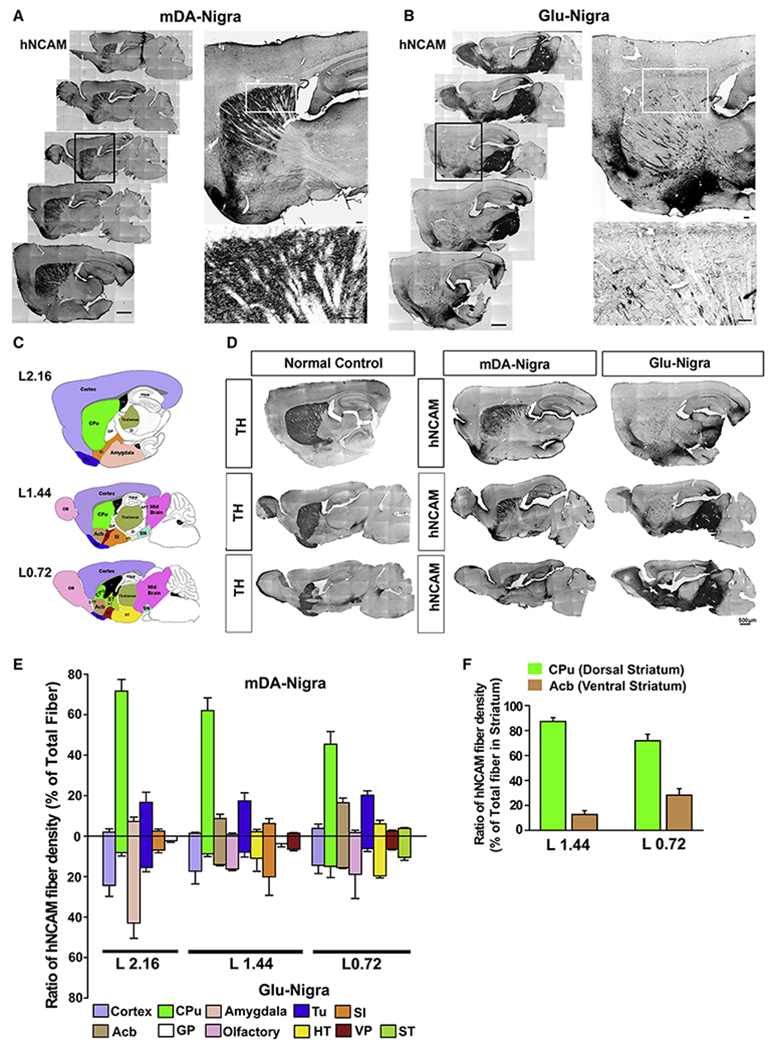
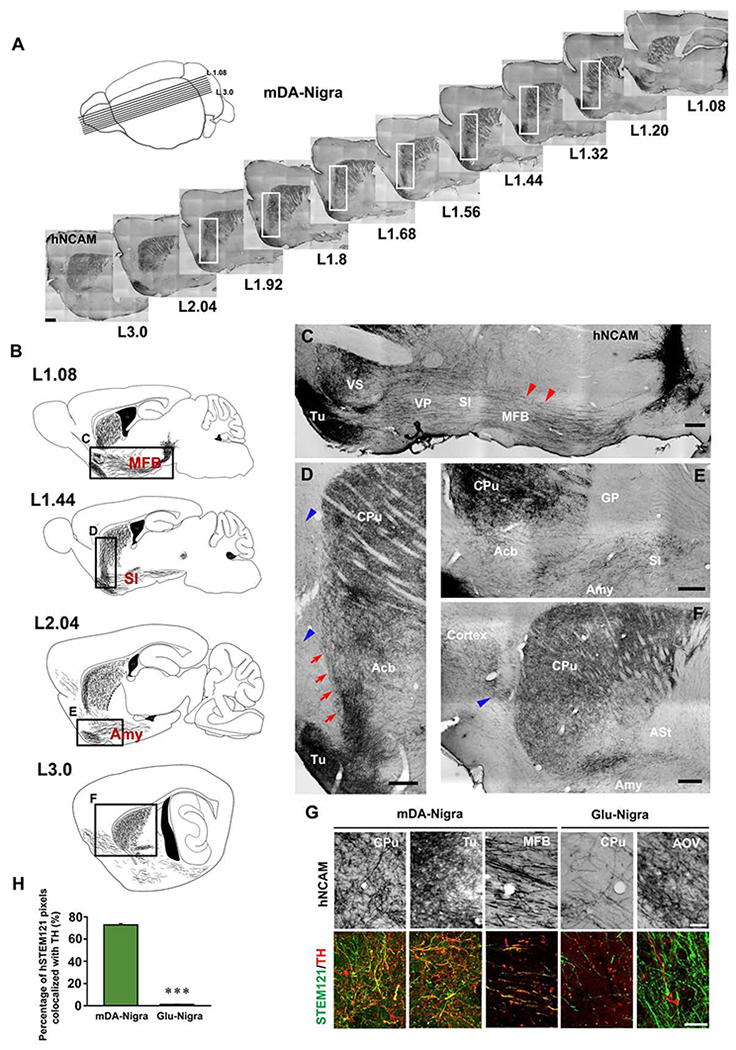
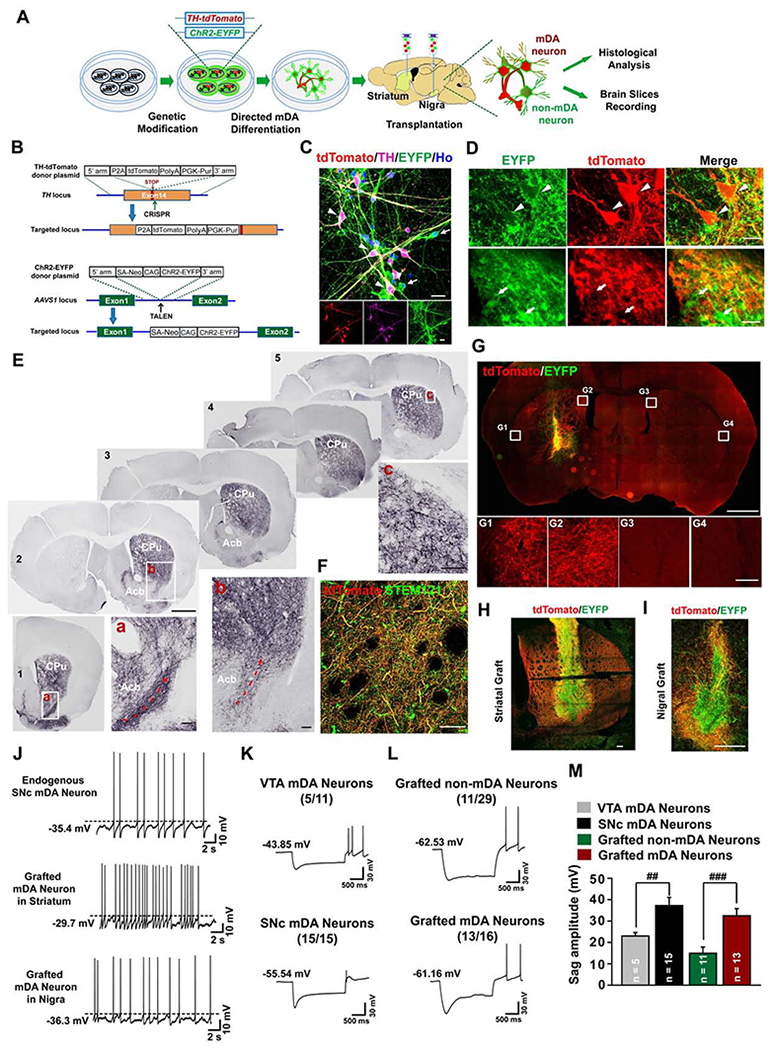
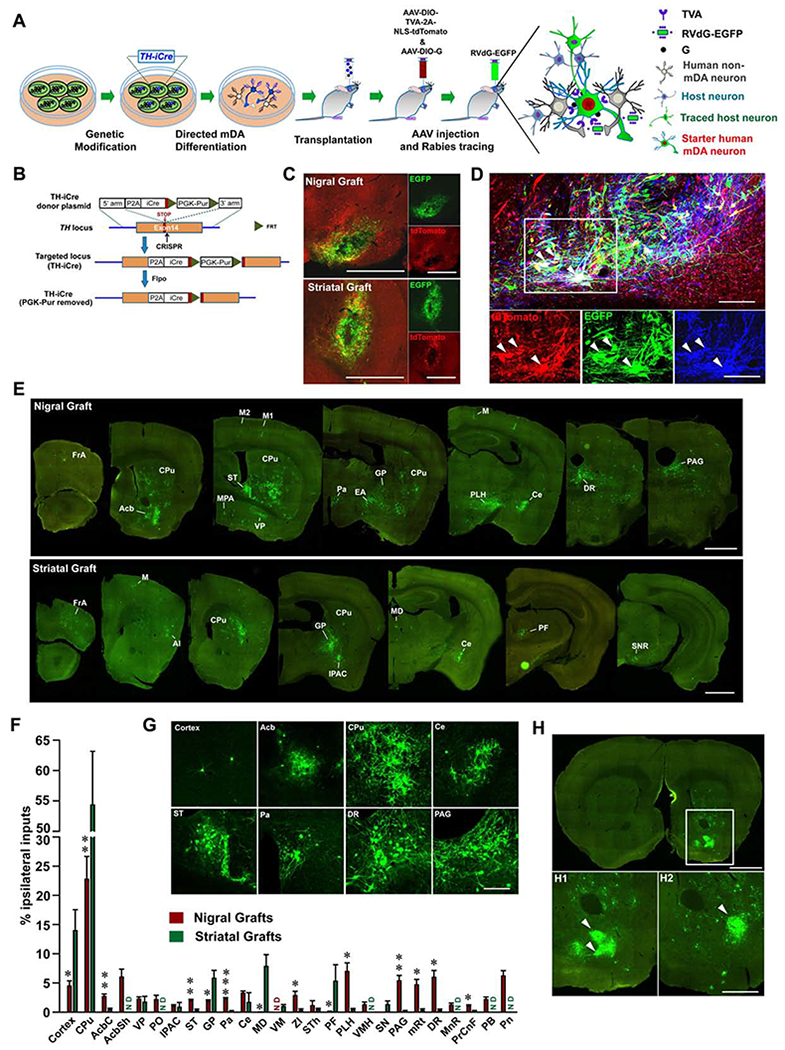
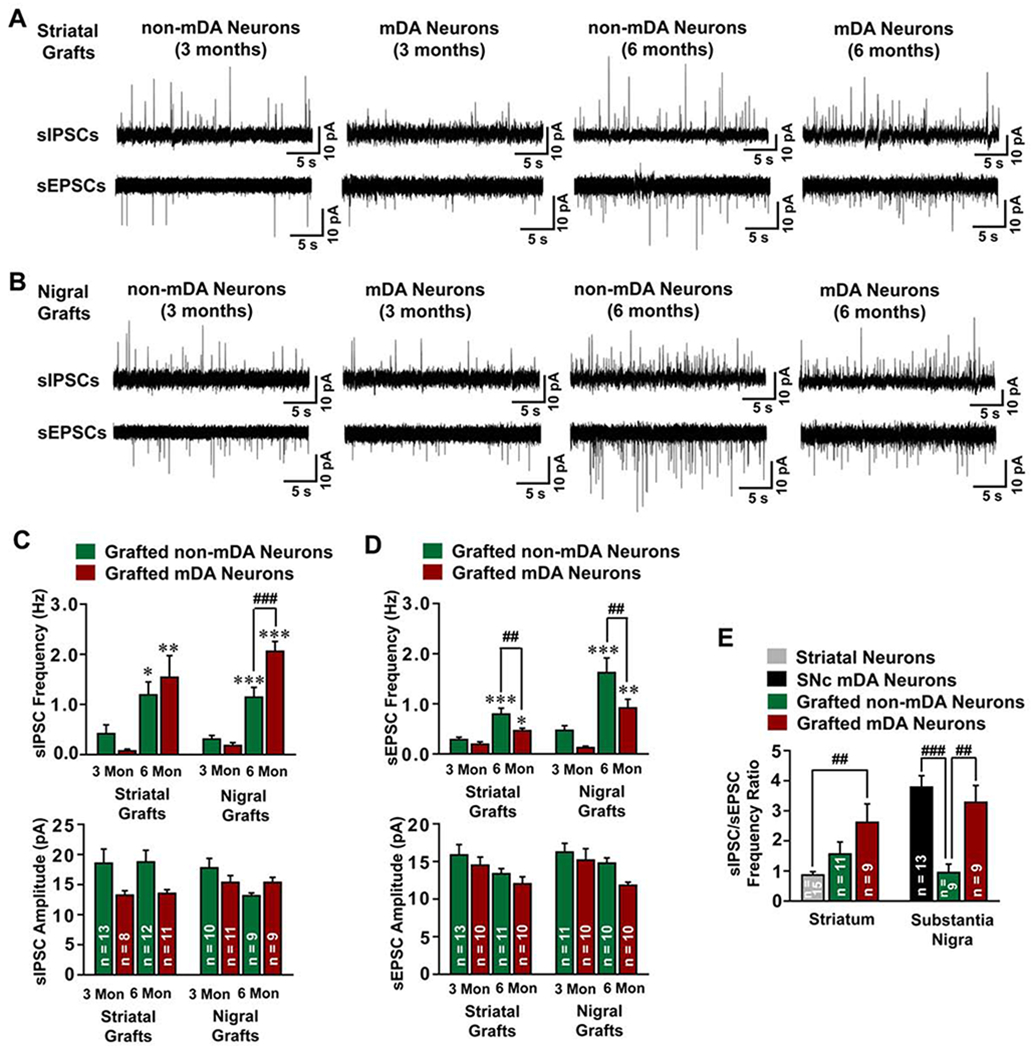
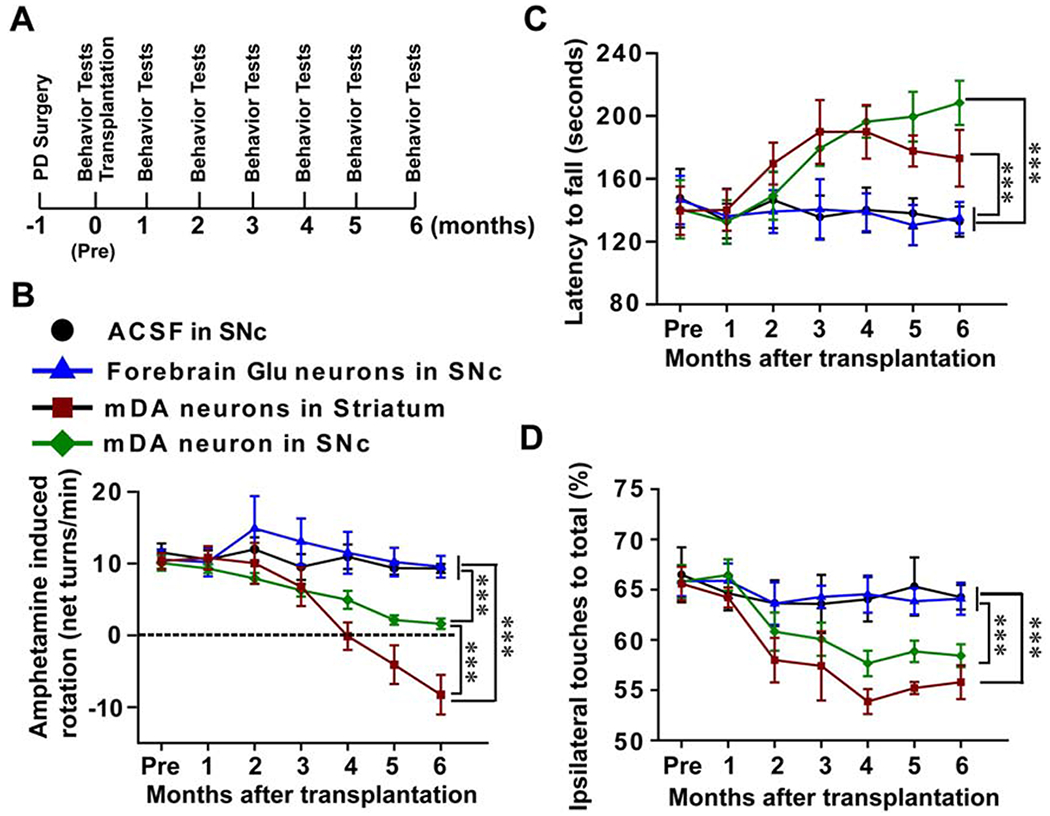
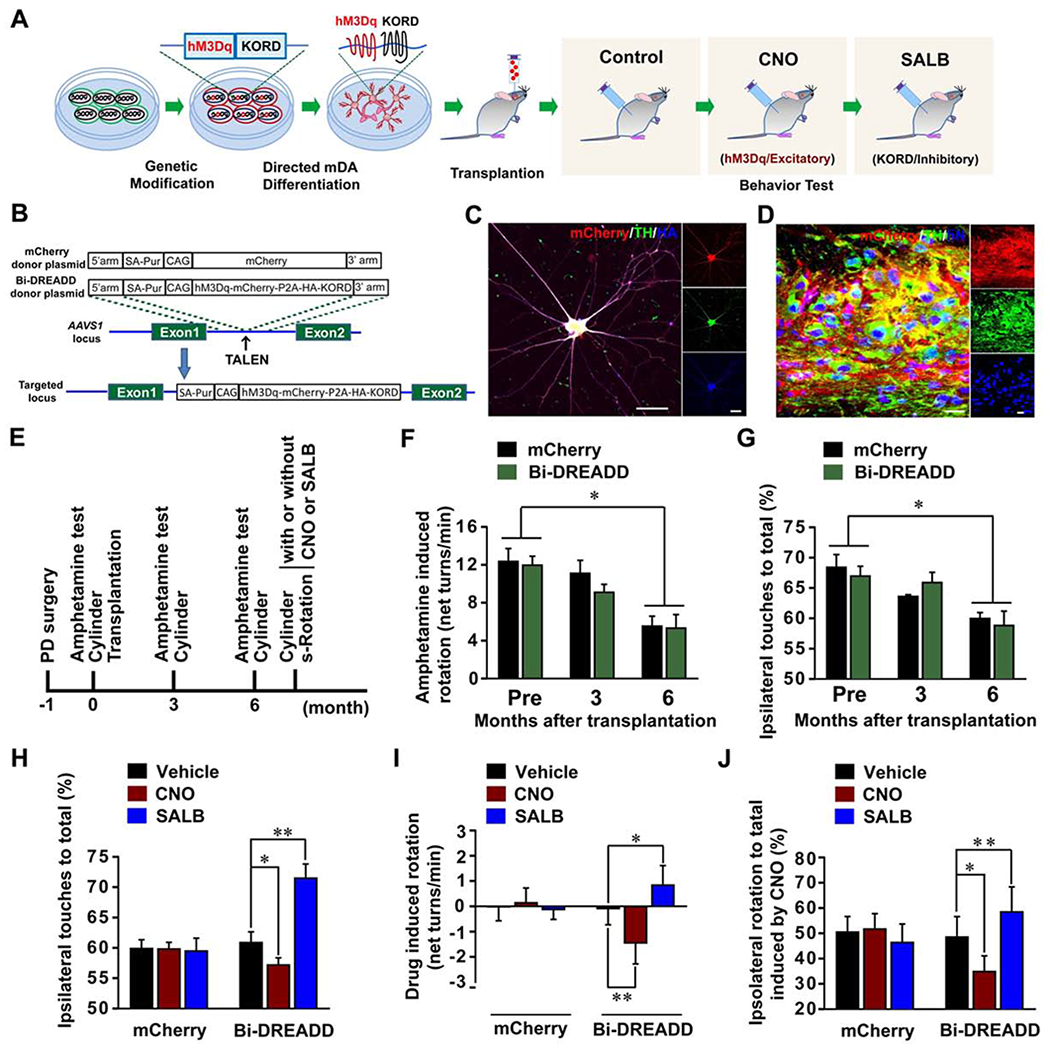
Although cell transplantation can rescue motor defects in Parkinson's disease (PD) models, whether and how grafts functionally repair damaged neural circuitry in the adult brain is not known. We transplanted hESC-derived midbrain dopamine (mDA) or cortical glutamate neurons into the substantia nigra or striatum of a mouse PD model and found extensive graft integration with host circuitry. Axonal pathfinding toward the dorsal striatum was determined by the identity of the grafted neurons, and anatomical presynaptic inputs were largely dependent on graft location, whereas inhibitory versus excitatory input was dictated by the identity of grafted neurons. hESC-derived mDA neurons display A9 characteristics and restore functionality of the reconstructed nigrostriatal circuit to mediate improvements in motor function. These results indicate similarity in cell-type-specific pre- and post-synaptic integration between transplant-reconstructed circuit and endogenous neural networks, highlighting the capacity of hPSC-derived neuron subtypes for specific circuit repair and functional restoration in the adult brain.

Keywords: Parkinson's disease; circuit repair; dopamine neuron; graft integration; human pluripotent stem cells; neural regeneration; stem cell therapy.


Conflict of interest statement

Declaration of Interests The authors declare no competing interests.

Figures

Figure 1.
Figure 1.. Axonal projection of nigrally transplanted human neurons.
(A-B) immunohistochemistry of sagittal sections for hNCAM from nigral graft with mDA (A) or Glu neurons (B), Scale bar = 250 μm. The black boxed areas are amplified at the upper right. The white boxed areas are amplified at the lower right. Scale bar = 25 μm for the amplified images. (C) Schematic sagittal diagram of anatomical structures in three representative planes. See Table S1 for abbreviations. (D) Immunostaining for TH in wild type mice (left panel) or hNCAM in PD mice transplanted with mDA neurons (middle panel) or Glu neurons (right panel) at corresponding sagittal planes. (E) Quantification of the regional distribution of hNCAM+ fibers in different areas. n = 8 for mDA neuron group, n = 6 for Glu neuron group. (F) Relative distribution of hNCAM+ fibers in the dorsal (CPu) and ventral striatum (Acb) from the two representative planes of mDA-transplanted mice. See also Figure S1.
Figure 2.
Figure 2.. Axonal projection pathways of nigrally transplanted neurons
(A) A schematic of the approximate medial-lateral planes and the corresponding serial sagittal sections immunostained for hNCAM from the mouse brain transplanted with mDA neurons. (B) Neurolucida drawing of hNCAM+ axonal projection at different planes of sagittal sections. The boxed areas are magnified in (C-F). (C-F) High magnification illustrates the axonal projection pathways and territory. Scale bar = 250 μm. The red arrowheads in (C) indicate the hNCAM+ axons in MFB. The red arrows in (D) indicate ascending hNCAM+ axons. (F) Distribution of hNCAM+ fibers in the lateral striatum. The blue arrowheads in (D) and (F) indicate hNCAM+ fibers in the cortex. See Table S1 for abbreviations. (G) The morphology of hNCAM+ fibers and co-labeling of human STEM121 and TH in fibers derived from mDA or Glu neuron graft in different host brain regions. Scale bar = 50 μm for the upper panel, 25 μm for the lower panel. (H) Quantification of the percentage of human STEM121 pixels colocalized with TH in CPu of mice transplanted with mDA or Glu neurons. Data are represented as mean ± SEM. Student-t test. ***p < 0.001. See also Figure S2.
Figure 3.
Figure 3.. Axonal projection and electrophysiological properties of genetically labeled human mDA neurons.
(A) The strategy for visualization and electrophysiological recording of the grafted human mDA or non-mDA neurons. (B) The strategy for generation of TH-tdTomato/ChR2-EYFP dual locus knock-in hESC line (TH-tdTomato/AAVS1-ChR2-EYFP hESCs). (C) Immunostaining of day 42 cultures derived from the above hESCs shows co-expression of tdTomato and EYFP in TH+ neurons (white arrowheads), and expression of EYFP but not tdTomato in TH neurons (white arrows). Scale bar = 20 μm. (D) Immunohistochemistry images show that nigral graft with the transgenic human mDA neurons contains both tdTomato+/EYFP+ mDA neurons (white arrowheads) and tdTomato/EYFP+ non-mDA neuronal cells (white arrows). (E) Serial coronal sections immunostained for tdTomato from the PD mouse brain with nigral graft, Scale bar = 1 mm. Boxed areas are magnified as indicated, Scale bar = 0.1 mm. Dotted red arrows indicate ascending axons from rostral-ventral part of the striatum. (F) Co-labeling of human STEM121 and tdTomato. Scale bar = 50 μm. (G-I) Coronal sections in the graft site immunostained for tdTomato and EYFP from the PD mouse brain with striatal (G and H) or nigral (I) graft. Boxed areas in (G) are magnified below. The image in (I) is a composite from two separate images for the upper part and lower part of the same graft. Scale bar = 1 mm, upper panel in (G). Scale bar = 100 μm lower panel in (G). Scale bar = 250 μm in (H and I). (J) Typical traces of spontaneous action potentials (sAPs) in endogenous SNc mDA neurons from mDA neuron reporter mice (DAT-Cre/Ai9), or striatally or nigrally grafted human mDA neurons at 3 months after transplantation. (K-M) Typical traces of voltage sag measurement from endogenous medial VTA or SNc mDA neurons in mDA neuron reporter mice (K), or striatally grafted human non-mDA neurons or mDA neurons at 6 months after transplantation (L). The number in parenthesis represents the number of neurons displaying sag components among recorded cells. The sag amplitude was plotted in (M). The sample number for statistics is indicated in the column. Data are represented as mean ± SEM. Student-t test, ##p < 0.01, ###p < 0.001. See also Figures S3 and S4.
Figure 4.
Figure 4.. Rabies-mediated tracing of inputs to genetically labeled human mDA neurons.
(A) The strategy for tracing inputs to genetically labeled human mDA neurons transplanted into the SN or striatum of PD mice. (B) Schematic diagram showing the generation of TH-iCre hESC line. (C) EGFP and tdTomato expressing neurons in the graft site. Scale bar = 1 mm. (D) Immunohistochemistry images show the expression of tdTomato, EGFP and TH in neurons at the SN graft site. The white arrowheads indicate co-expression of EGFP and tdTomato in TH+ neurons. Scale bar = 100 μm. (E) Serial coronal sections show distribution of traced host neurons (EGFP+/tdTomato) to nigrally or striatally grafted human mDA neurons. Only the side ipsilateral to the graft is shown. Scale bar = 1 mm. (F) Quantification of ipsilaterally labeled inputs to nigrally or striatally grafted human mDA neurons, shown as a percentage of all ipsilateral inputs. Data are represented as mean ± SEM. Only the brain regions with the average input percentage > 1% to either nigral or striatal graft are shown. n = 3 for striatal graft, n = 5 for nigral graft. ND, not detected. Student-t test, * p < 0.05, **p < 0.01, ***p < 0.001. (G) Magnified images of labeled input neurons to nigrally grafted mDA neurons in different host brain regions. Scale bar = 200 μm. See Table S1 for abbreviations. (H) Coronal section shows labeled input neurons to nigrally grafted mDA neurons in Acb. Boxed area is magnified below (H1). Example distribution of input neurons from another animal is shown (H2). White arrowheads indicate patch-like distribution of labeled input neurons. Scale bar = 1 mm for upper image; Scale bar = 0.5 mm for lower images. See also Figure S5.
Figure 5.
Figure 5.. Electrophysiological properties of inputs to human mDA or non-mDA neurons.
(A and B) Typical traces of sEPSCs and sIPSCs in striatally (A) or nigrally (B) grafted human mDA or non-mDA neurons at 3 or 6 months after transplantation. (C and D) The frequency and amplitude of sIPSCs (C) and sEPSCs (D) were plotted. Data are represented as mean ± SEM. One-way ANOVA followed by Holm-Sidak post hoc test. * p < 0.05, **p < 0.01, ***p < 0.001, comparison between 3-month and 6-month grafted mDA or non-DA neurons. ##p < 0.01, ###p < 0.001, comparison between grafted mDA and non-mDA neurons. (E) The sIPSC/sEPSC ratio in endogenous striatal or SNc neurons in wild type SCID mice, or non-mDA or mDA neurons in striatum or nigra at 6 months after transplantation were plotted. Data are represented as mean ± SEM. One-way ANOVA followed by Holm-Sidak post hoc test. ##p < 0.01, ###p < 0.001. The sample number for statistics is indicated in the column. See also Figure S6.
Figure 6.
Figure 6.. Behavioral consequence of transplanted animals.
(A) The experimental process of the establishment of the animal model, transplantation and behavioral analysis. These animals were tested monthly using behavior tests including Amphetamine-induced rotation, Rotarod test and Cylinder test. (B) Amphetamine-induced rotation behavior changes over the 6 months post-transplantation. (C) Rotarod test shows the changes in latency to fall before and after transplantation. (D) Cylinder test shows the preferential ipsilateral touches before and after transplantation. In all three behavioral tests, n = 11 in nigral mDA group, n = 8 in nigral Glu group, n = 8 in nigral ACSF group, n = 8 in striatal mDA group. Data are presented as mean ± SEM. Two-way ANOVA followed by Holm-Sidak test. ***, p<0.001.
Figure 7.
Figure 7.. Bi-directional control of transplanted PD mice.
(A) The strategy for bi-directional regulation of human mDA neuron transplants in PD mice. (B) The strategy for generation of mCherry or Bi-DREADD hESC lines. (C) Immunostaining shows co-expression of TH, hM3Dq-mcherry, and HA-tagged KORD in mDA neurons at day 42 of differentiation from Bi-DREADD hESCs. Scale bar = 50 μm. (D) Immunohistochemistry images show that the nigrally grafted mDA neurons from Bi-DREADD hESCs co-expressed human nuclei (hN), mCherry and TH. Scale bar = 20 μm. (E) The experimental process of animal model, transplantation, and behavioral analysis. S-Rotation, spontaneous rotation. (F and G) Amphetamine-induced rotation and Cylinder test show the changes of the rotation behavior (F) or preferential ipsilateral touches (G). (H) Cylinder test shows the changes of preferential ipsilateral touches of PD mice after treatment with vehicle, CNO or SALB. (I and J) Spontaneous rotation test shows CNO- or SALB-induced changes in net ipsilateral rotations (I) and preferential ipsilateral rotations (J). Data are presented as mean ± SEM. Two-way RM ANOVA followed by Tukey’s post hoc test in (F) and G), or Paired t-test in (H), (I), (J). In all behavioral tests, n=6 in each group. **, p<0.01. *, p<0.05. See also Figure S7.

References

    1. Adler AF, Cardoso T, Nolbrant S, Mattsson B, Hoban DB, Jarl U, Wahlestedt JN, Grealish S, Bjorklund A, and Parmar M (2019). hESC-Derived Dopaminergic Transplants Integrate into Basal Ganglia Circuitry in a Preclinical Model of Parkinson’s Disease. Cell Rep 28, 3462–3473 e3465. - PMC - PubMed
    1. Alexander GM, Rogan SC, Abbas AI, Armbruster BN, Pei Y, Allen JA, Nonneman RJ, Hartmann J, Moy SS, Nicolelis MA, et al. (2009). Remote control of neuronal activity in transgenic mice expressing evolved G protein-coupled receptors. Neuron 63, 27–39. - PMC - PubMed
    1. Bjorklund A, and Dunnett SB (2007). Dopamine neuron systems in the brain: an update. Trends Neurosci 30, 194–202. - PubMed
    1. Cardoso T, Adler AF, Mattsson B, Hoban DB, Nolbrant S, Wahlestedt JN, Kirkeby A, Grealish S, Bjorklund A, and Parmar M (2018). Target-specific forebrain projections and appropriate synaptic inputs of hESC-derived dopamine neurons grafted to the midbrain of parkinsonian rats. J Comp Neurol 526, 2133–2146. - PMC - PubMed
    1. Chen Y, Cao J, Xiong M, Petersen AJ, Dong Y, Tao Y, Huang CT, Du Z, and Zhang SC (2015). Engineering Human Stem Cell Lines with Inducible Gene Knockout using CRISPR/Cas9. Cell Stem Cell 17, 233–244. - PMC - PubMed

Publication types