. 2020 Sep 22;32(12):108180.
doi: 10.1016/j.celrep.2020.108180.

Chromatin Landscape Underpinning Human Dendritic Cell Heterogeneity

Affiliations

Chromatin Landscape Underpinning Human Dendritic Cell Heterogeneity

Rebecca Leylek et al. Cell Rep. .

Abstract

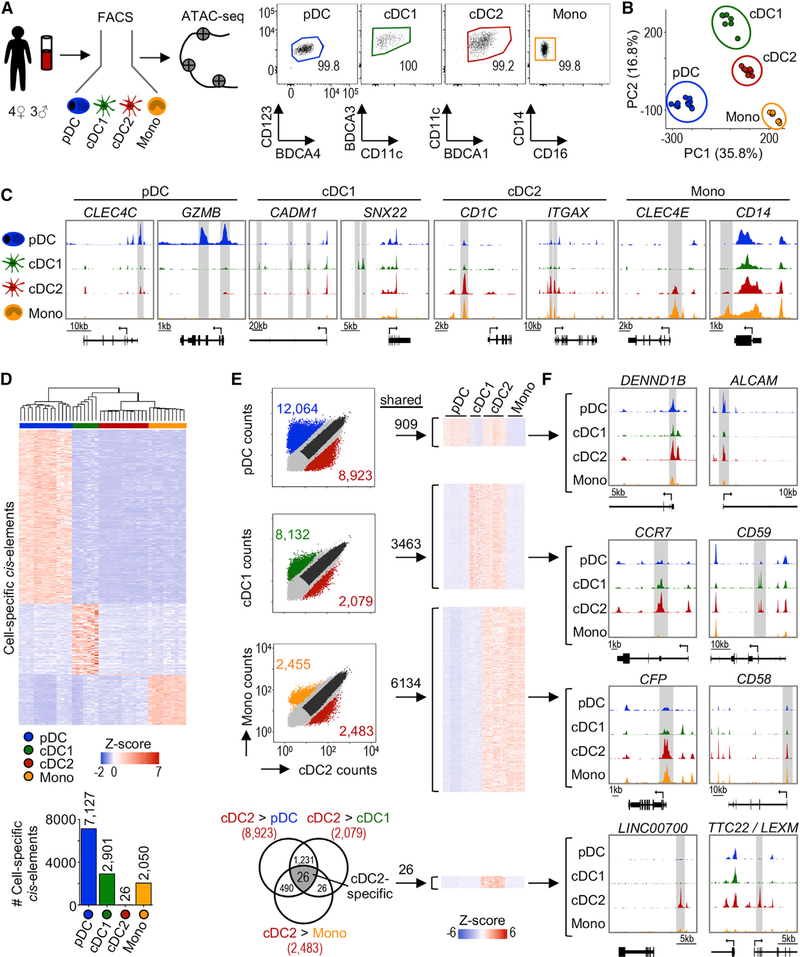
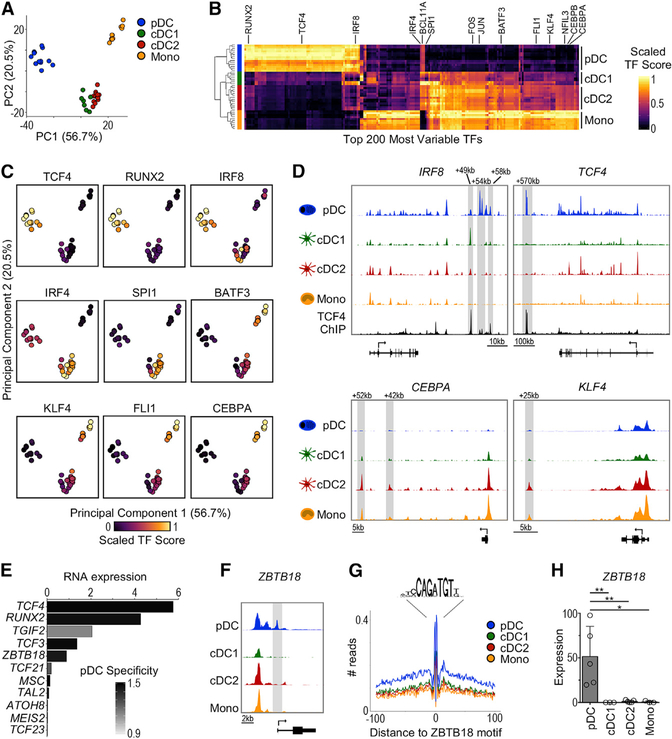
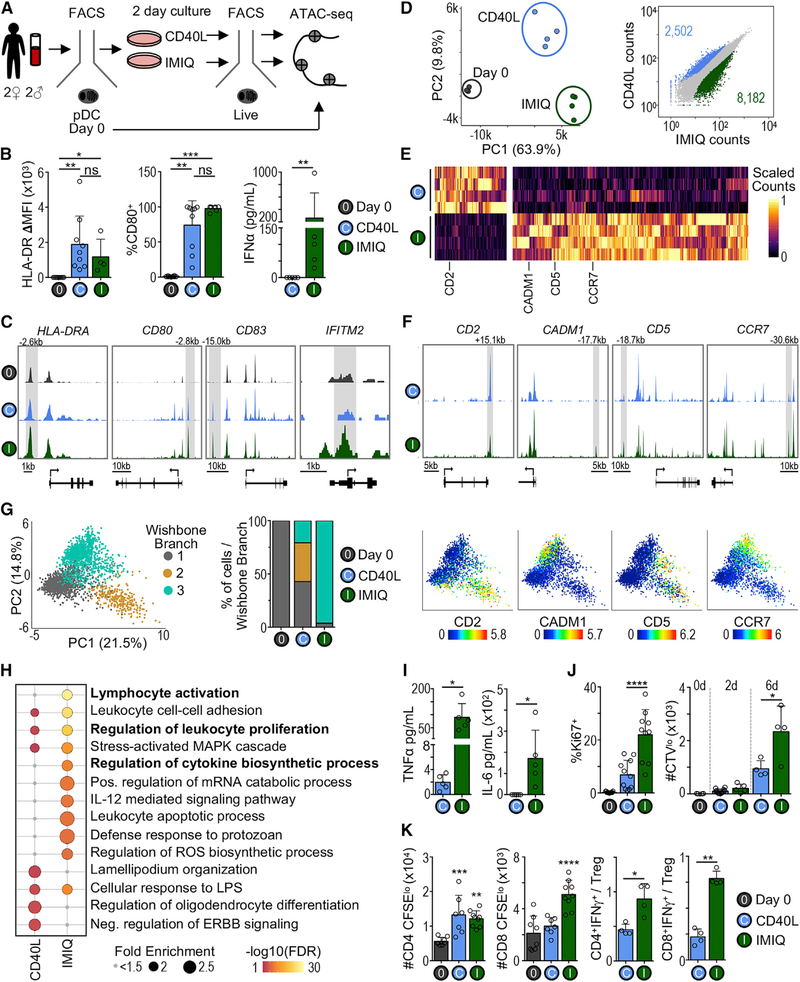
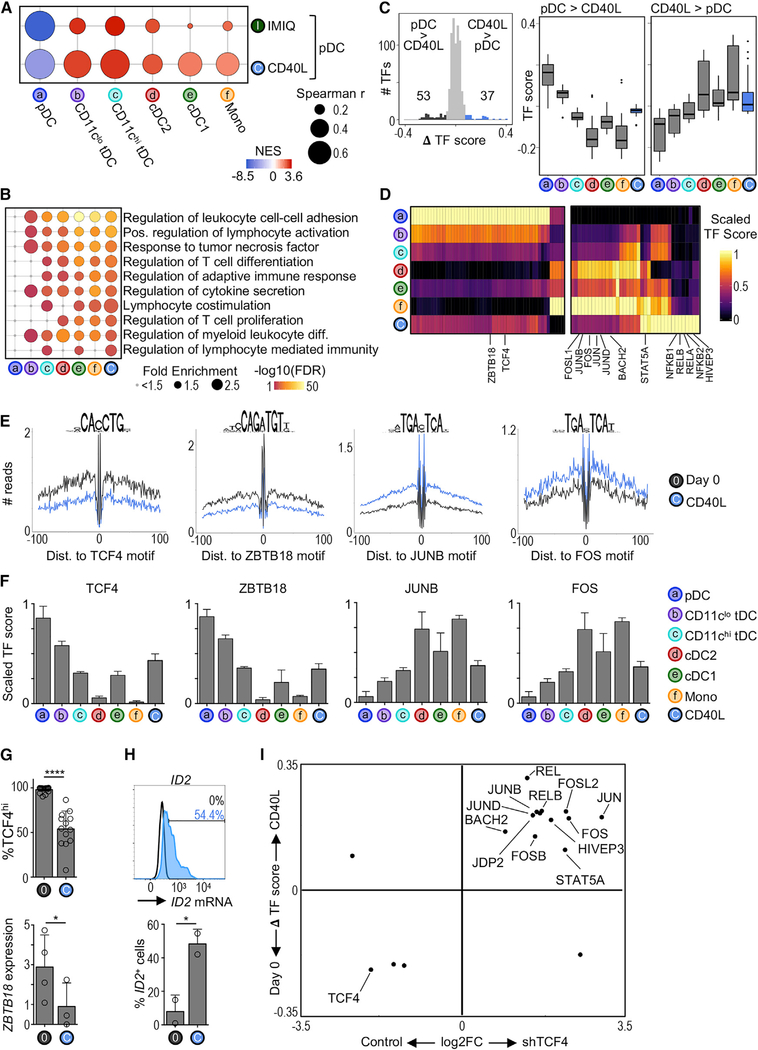
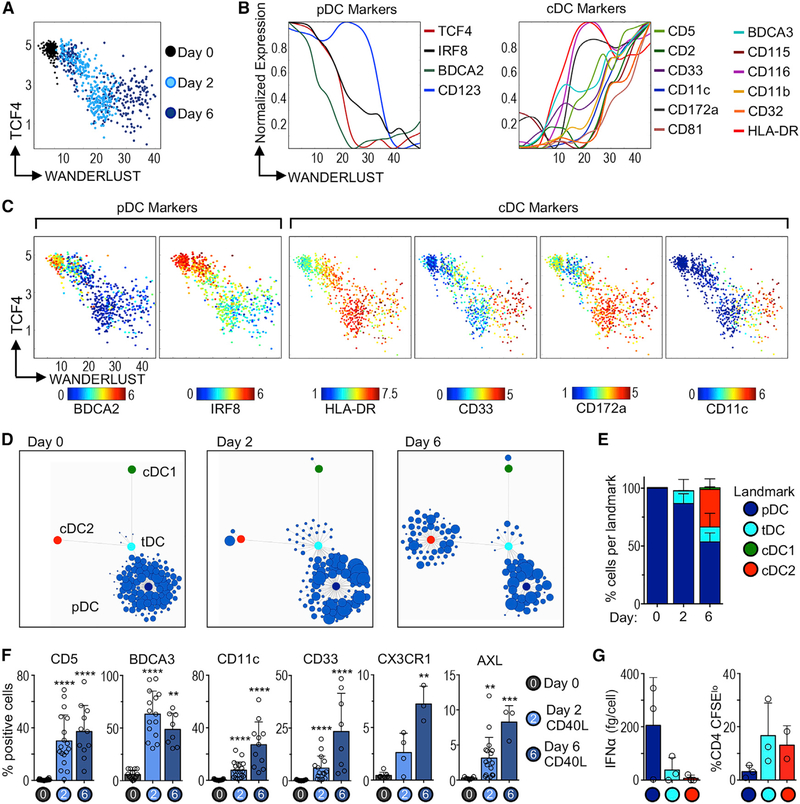
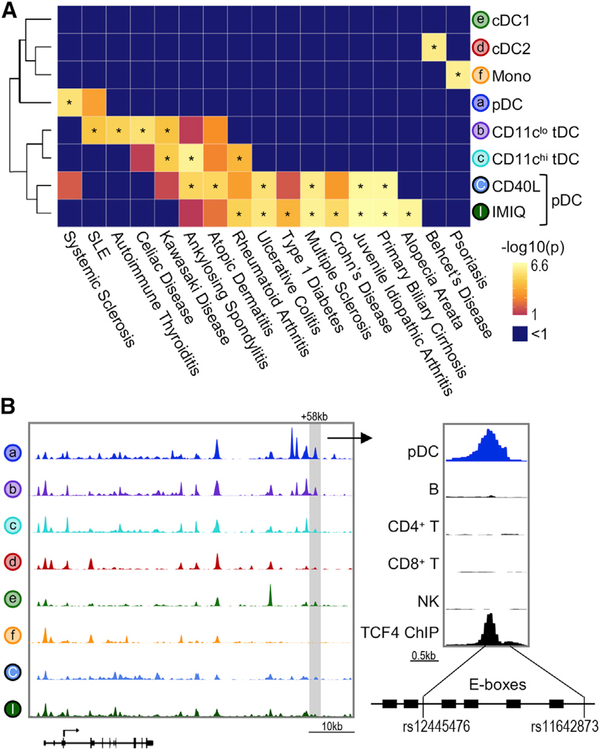
Human dendritic cells (DCs) comprise subsets with distinct phenotypic and functional characteristics, but the transcriptional programs that dictate their identity remain elusive. Here, we analyze global chromatin accessibility profiles across resting and stimulated human DC subsets by means of the assay for transposase-accessible chromatin using sequencing (ATAC-seq). We uncover specific regions of chromatin accessibility for each subset and transcriptional regulators of DC function. By comparing plasmacytoid DC responses to IFN-I-producing and non-IFN-I-producing conditions, we identify genetic programs related to their function. Finally, by intersecting chromatin accessibility with genome-wide association studies, we recognize DC subset-specific enrichment of heritability in autoimmune diseases. Our results unravel the basis of human DC subset heterogeneity and provide a framework for their analysis in disease pathogenesis.

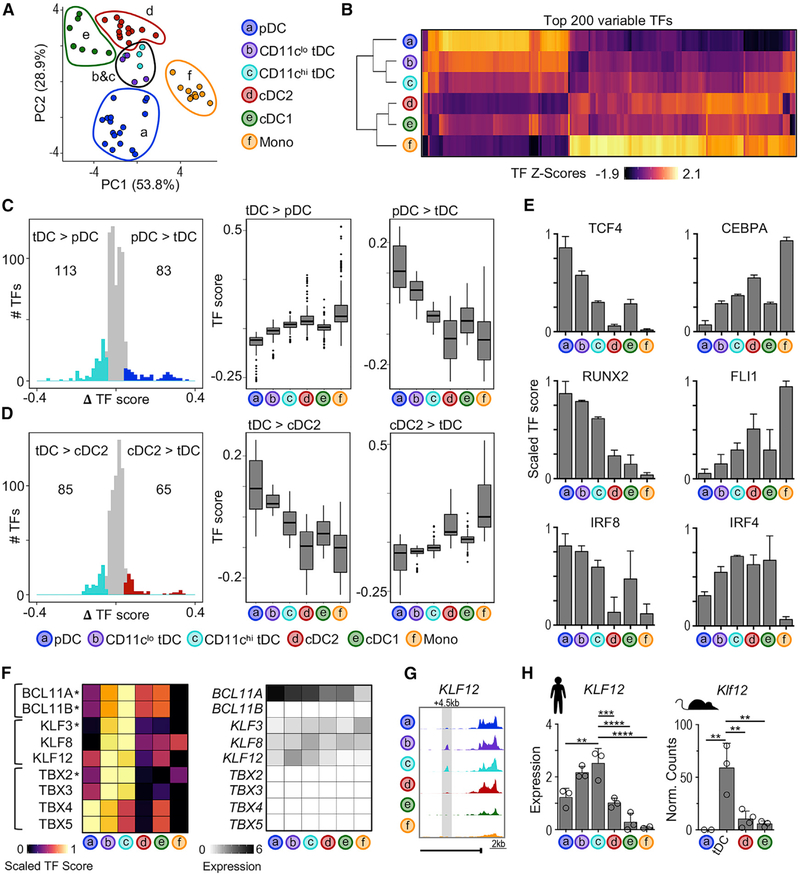
Keywords: ASDCs; ATAC-seq; AXL+ DCs; IFN-I; cDC1; cDC2; dendritic cells; human; monocytes; pDCs; plasmacytoid dendritic cells; tDCs; transitional dendritic cells.


Conflict of interest statement

Declaration of Interests H.Y.C. is affiliated with Accent Therapeutics, Boundless Bio, 10x Genomics, Arsenal Biosciences, and Spring Discovery. A.T.S. is a scientific co-founder of Immunai and receives research funding from Arsenal Biosciences.

Figures

Figure 1.
Figure 1.. Analysis Workflow of Primary Human DC Chromatin Accessibility Profiles
(A) Left: experimental workflow. Human myeloid populations were sorted from peripheral blood of 7 healthy adult donors and analyzed by ATAC-seq. Technical replicates were analyzed when not limited by cell number. Right: post-sort purity. The numbers indicate the frequency of parent gate. See Figure S1A for the full gating strategy. (B) PCA based on ATAC-seq signal in all cis-elements. Each point represents 1 sample. (C) Genome tracks from 1 representative donor showing signal near known subset-specific genes. The bottom bar represents the gene and the arrow indicates the start codon. The gray highlights indicate differentially accessible cis-elements. (D) Top: heatmap of subset-specific cis-elements (fold change [FC] > 5 and adjusted p value [p-adj] < 0.05 in all pairwise comparisons). Color indicates Z score of ATAC-seq signal. Bottom: number of subset-specific cis-elements. (E) Left: scatterplots comparing ATAC-seq signal (read counts) between cDC2 and other subsets. Each point represents 1 cis-element. The colored points indicate differentially accessible cis-elements (FC > 5 and p-adj < 0.05). The dark gray points indicate shared cis-elements (FC < 2 and average count > 10). Right: heatmap of cis-elements shared between cDC2 and other subsets. The color indicates ATAC-seq signal Z scores. Bottom: overlap of cDC2-specific differentially accessible cis-elements in each pairwise comparison. (F) Genome tracks for select shared cis-elements from (E). See also Figure S1 and Table S1.
Figure 2.
Figure 2.. ATAC-Seq Reveals an Undescribed Transcriptional Regulator in pDCs.
(A) PCA based on TF activity scores (TF score) calculated by chromVAR. (B) Heatmap of top 200 most variable TFs (columns) across subsets (rows). The color indicates scaled TF score. (C) PCA as in (A) colored by scaled TF score. (D) Chromatin accessibility around the IRF8, TCF4, CEBPA, and KLF4 loci. The tracks are from 1 representative donor. The TCF4 ChIP-seq track (Ceribelli et al., 2016) is shown for IRF8 and TCF4. (E) pDC-specific TFs identified by chromVAR that also demonstrate higher mRNA expression in pDCs. The x axis represents the mean mRNA expression in pDCs measured by scRNA-seq (Villani et al., 2017). The bars are colored by pDC specificity compared to other DC subsets (Z score). (F) Genome tracks of ZBTB18 locus from 1 representative donor showing transcript variant 1. (G) ZBTB18 HINT-ATAC footprint from genome-wide binding sites. The data are pooled from all of the samples for each subset. (H) ZBTB18 transcript variant 1 expression measured by RT-PCR, n = 3–5 in 2–4 independent experiments. The statistics are determined by 1-way ANOVA with Dunnett’s multiple comparisons test. Bar graphs show means ± SDs. *p < 0.05 and **p < 0.01. See also Figure S2.
Figure 3.
Figure 3.. Unique TF Profile of tDCs
(A) PCA based on TF scores calculated by chromVAR. (B) Heatmap of top 200 most variable TFs (columns) across subsets (rows). The color indicates scaled TF score. (C) Left: histogram of difference in TF scores between pDCs and CD11chi tDCs. The colored points indicate significantly different TFs (ΔTF score > |0.05| and p-adj < 0.05). Right: boxplots of TF scores for differentially active TFs from indicated comparisons. (D) Same as (C), but comparing cDC2 and CD11chi tDCs. (E) Bar graphs of scaled TF scores for indicated TF motifs (n = 4–17 samples per subset). (F) Left: heatmap of scaled TF scores for tDC-specific TF motifs (ΔTF score > |0.05| and p-adj < 0.05 in all pairwise comparisons; indicated by asterisk) and closely related TFs. Right: heatmap of average TF mRNA expression from scRNA-seq data (Villani et al., 2017). (G) Genome tracks of KLF12 locus from 1 representative donor. (H) Left: KLF12 expression in human subsets measured by RT-PCR (n = 2–3 in 2 experiments). Right: Klf12 expression in mouse subsets measured by RNA-seq (n = 2–3) (Lau et al., 2016; Leylek et al., 2019). The statistics are determined by 1-way ANOVA with Dunnett’s multiple comparisons test. Bar graphs show means ± SDs. **p < 0.01, ***p < 0.001, and ****p < 0.0001. See also Figure S3.
Figure 4.
Figure 4.. Analysis of Chromatin Landscapes Reveals Alternative pDC Cell States following Stimulation
(A) Experimental workflow for analysis of freshly isolated (day 0) and stimulated pDCs. Bona fide pDCs (AXL) were sorted and analyzed immediately (day 0) or stimulated in vitro for 2 days, followed by re-sorting live cells for ATAC-seq analysis (see Figures S3A and S4A for gating strategy). (B) Left: protein levels of HLA-DR and CD80 in freshly isolated (day 0) or 2-day stimulated bona fide pDCs measured by flow cytometry (n = 3–9 in 3–8 experiments). The statistics are determined by Kruskal-Wallis with Dunn’s multiple comparisons test. Right: IFN-α measured by ELISA in culture supernatant after 2 days (n = 5 in 5 experiments). The statistics are determined by Mann-Whitney test. (C) Genome tracks from 1 representative donor. (D) Left: PCA based on ATAC-seq signal in all cis-elements. Each point represents 1 sample (n = 3–4 per condition). Right: scatterplot comparing all cis-elements between CD40L- and IMIQ-stimulated pDCs. The colored points indicate significantly differentially accessible cis-elements (FC > 2 and p-adj < 0.05). (E) Heatmap of scaled ATAC-seq signal in cis-elements identified in (D). (F) Genome tracks from 1 representative donor. (G) Left: PCA of sorted bona fide pDCs analyzed by CyTOF, including three time points (days 0, 2, and 6) and conditions (media alone, CD40L, IMIQ) subsampled and merged. The color indicates the branch cluster determined by Wishbone (n = 1 representative of 2 experiments). Center: percentage of pDCs in each Wishbone branch at day 6. Right: PCA colored by expression of select markers. (H) Top Gene Ontology terms enriched in CD40L and IMIQ differentially accessible cis-elements. The bubble size represents the fold enrichment. The color indicates −log10 false discovery rate (FDR). (I) Cytokines in culture supernatant of 2-day stimulated pDCs (n = 5 in 5 experiments). The statistics are determined by t test. (J) Left: frequency of Ki67+ cells among fresh (day 0) or 2-day stimulated pDCs. Right: number of CellTrace Violet low (CTVlo) cells among fresh, 2-, or 6-day stimulated pDCs (n = 4–11 in 2–7 experiments). The statistics are determined by t test. (K) MLR using fresh or 2-day stimulated pDCs (DC:T cell ratio 1:20, n = 3–4 donors in 3 experiments). The statistics are determined by 1-way ANOVA against day 0 or t test. Bar graphs shown as mean ± SD. *p < 0.05, **p < 0.01, ***p < 0.001, ****p < 0.0001. See also Figure S4 and Table S2.
Figure 5.
Figure 5.. CD40L-Stimulated pDCs Share Chromatin Accessibility Landscape with tDCs and cDCs
(A) Modified GSEA to test for enrichment of DC subset chromatin signatures among CD40L- or IMIQ-stimulated pDCs (see Quantification and Statistical Analysis). The bubble size represents the Spearman’s rank correlation coefficient. The color indicates the normalized enrichment score (NES). (B) Top Gene Ontology terms enriched in CD40L-stimulated pDCs compared to freshly isolated (day 0) pDCs. The terms are colored and ranked by −log10 FDR. The bubble size represents the term fold enrichment. (C) Left: histogram of difference in TF scores between CD40L-stimulated pDCs and day 0 pDCs. The significantly different TF motifs (ΔTF score > |0.08| and p-adj < 0.05) are colored. Right: boxplots of TF scores. (D) Heatmap of differentially active TFs from (C). The color indicates the scaled TF score for each subset. (E) HINT-ATAC footprint plots for indicated TFs. The data are pooled from 3–4 donors per condition. (F) Bar graphs of scaled scores for select TFs from (D) (n = 4–17 samples per cell type). (G) Top: frequency of pDCs expressing high levels of TCF4 protein measured by flow cytometry (n = 13–17 in 10–14 experiments). Bottom: ZBTB18 transcript variant 1 expression measured by RT-PCR (n = 3–4 in 3–4 experiments). The statistics are determined by t test. (H) Top: representative histogram of ID2 mRNA expression in 2-day CD40L-stimulated pDCs measured by PrimeFlow. The unfilled histogram represents the control. Bottom: frequency of ID2+ pDCs (n = 2 in 2 experiments). (I) Scatterplot comparing changes between CD40L stimulation and TCF4 silencing. x axis: FC of mRNA expression between TCF4 and control small hairpin RNA (shRNA) conditions in the pDC cell line CAL-1 (microarray) (Ceribelli et al., 2016). y axis: ΔTF score between freshly isolated (day 0) and CD40L-stimulated pDCs (ATAC-seq). Shown are TFs that were significantly different in both analyses. Bar graphs show means ± SDs. *p < 0.05 and ****p < 0.0001. See also Figure S5.
Figure 6.
Figure 6.. Single-Cell Trajectory of pDC Cell State Conversion during Stimulation
(A) Wanderlust trajectory of fresh (day 0), 2-, or 6-day CD40L-stimulated bona fide pDCs analyzed by CyTOF; each point represents 1 cell (1 experiment of 3–4). (B) Normalized expression of pDC and cDC markers plotted along Wanderlust trajectory axis. (C) As in (A), but colored by expression of key markers. (D) Statistical Scaffold maps of CyTOF data from fresh (day 0), 2-, or 6-day CD40L-stimulated pDCs (1 representative donor). (E) Summary graph of frequency of pDCs mapped to each landmark node (n = 2–3 donors in 3–4 experiments). (F) Protein expression in fresh (day 0), 2-, or 6-day CD40L-stimulated bona fide pDCs analyzed by flow cytometry and CyTOF (n = 3–18 donors in 3–16 experiments). Statistics determined by Kruskal-Wallis with Dunn’s multiple comparisons test. (G) Functional analysis of pDCs that mapped to each landmark node. Two-day CD40L-stimulated pDCs were re-sorted based on phenotype. Left: IFN-α in culture supernatant after 24 h CpG-A, measured by ELISA. Right: T cell proliferation in MLR (n = 2–3 donors in 2–3 experiments). Bar graphs show means ± SDs. **p < 0.01, ***p < 0.001, and ****p < 0.0001. See also Figure S6 and Table S2.
Figure 7.
Figure 7.. ATAC-Seq Identifies Regulatory Regions Overlapping Autoimmune Disease-Related SNPs
(A) Enrichment for autoimmune disease-associated SNPs performed by CHEERS. Color indicates p value, asterisk indicates p < 0.05. See Figure S7 for the complete list. (B) Left: genome track of the IRF8 locus showing 1 representative donor. Right: genome track of the +58-kb IRF8 enhancer showing pDCs, major immune cell lineages (Calderon et al., 2019), and TCF4 ChIP-seq data (Ceribelli et al., 2016). Bottom panel shows the schematic of SNP positions in relation to TCF4 binding sites (E-boxes).

References

    1. Abbas A, Vu Manh T-P, Valente M, Collinet N, Attaf N, Dong C, Naciri K, Chelbi R, Brelurut G, Cervera-Marzal I, et al. (2020). The activation trajectory of plasmacytoid dendritic cells in vivo during a viral infection. Nat. Immunol 21, 983–997. - PMC - PubMed
    1. Ah Kioon MD, Tripodo C, Fernandez D, Kirou KA, Spiera RF, Crow MK, Gordon JK, and Barrat FJ (2018). Plasmacytoid dendritic cells promote systemic sclerosis with a key role for TLR8. Sci. Transl. Med 10, eaam8458. - PMC - PubMed
    1. Alcántara-Hernández M, Leylek R, Wagar LE, Engleman EG, Keler T, Marinkovich MP, Davis MM, Nolan GP, and Idoyaga J (2017). High-Dimensional Phenotypic Mapping of Human Dendritic Cells Reveals Interindividual Variation and Tissue Specialization. Immunity 47, 1037–1050.e6. - PMC - PubMed
    1. Alculumbre SG, Saint-André V, Di Domizio J, Vargas P, Sirven P, Bost P, Maurin M, Maiuri P, Wery M, Roman MS, et al. (2018). Diversification of human plasmacytoid predendritic cells in response to a single stimulus. Nat. Immunol 19, 63–75. - PubMed
    1. Anderson KL, Perkin H, Surh CD, Venturini S, Maki RA, and Torbett BE (2000). Transcription factor PU.1 is necessary for development of thymic and myeloid progenitor-derived dendritic cells. J. Immunol 164, 1855–1861. - PubMed

Publication types