. 2020 Nov 23;55(4):432-449.e12.
doi: 10.1016/j.devcel.2020.08.012. Epub 2020 Sep 22.

A Membrane-Tethered Ubiquitination Pathway Regulates Hedgehog Signaling and Heart Development

Affiliations

A Membrane-Tethered Ubiquitination Pathway Regulates Hedgehog Signaling and Heart Development

Jennifer H Kong et al. Dev Cell. .

Abstract

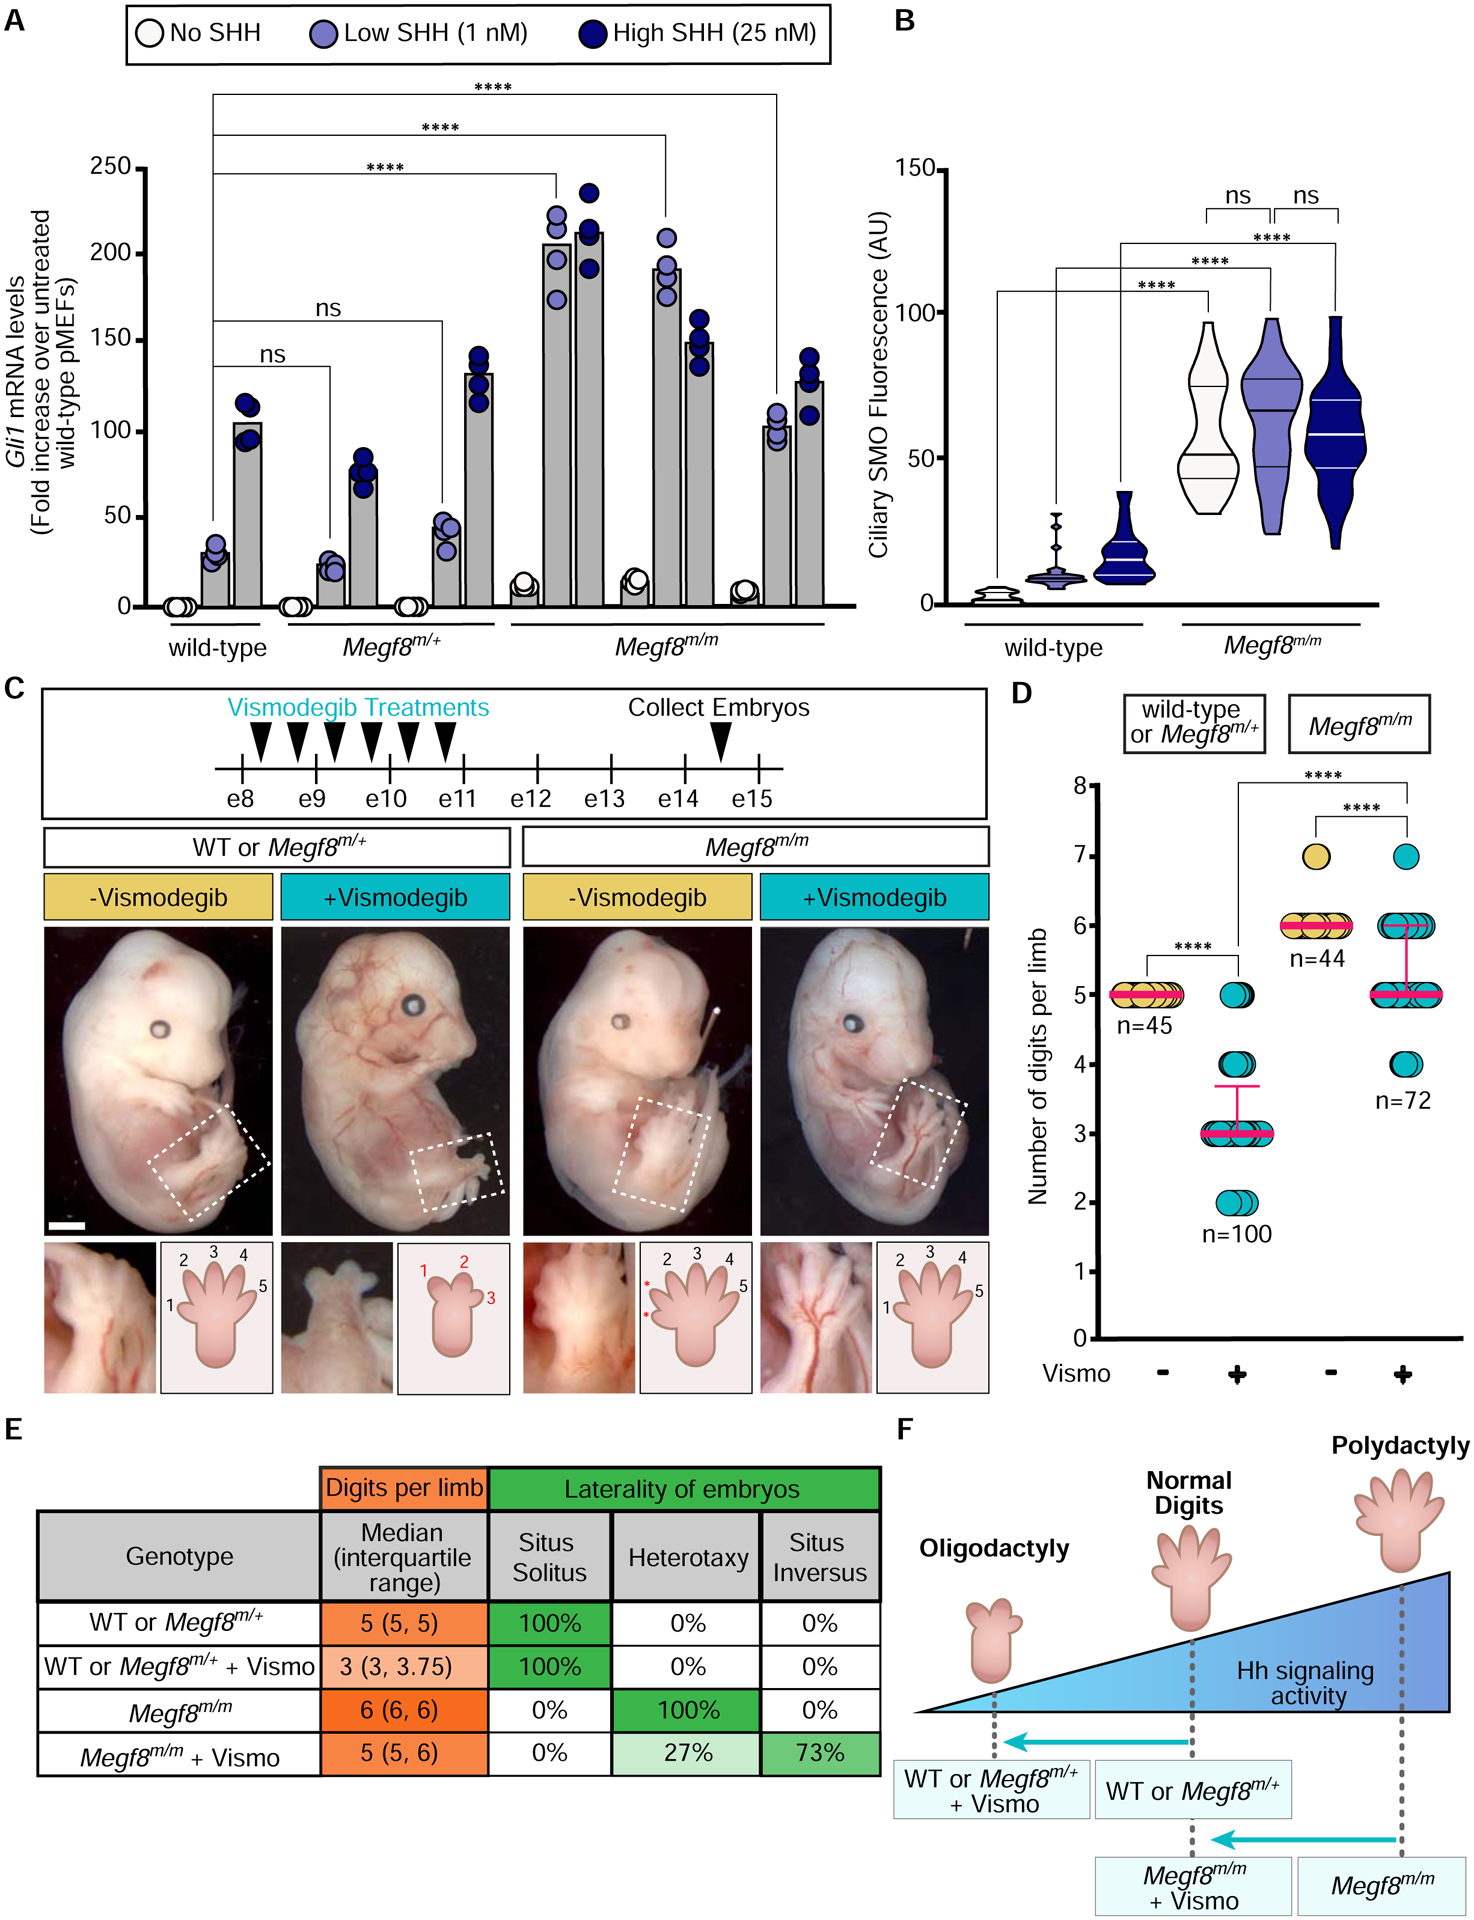
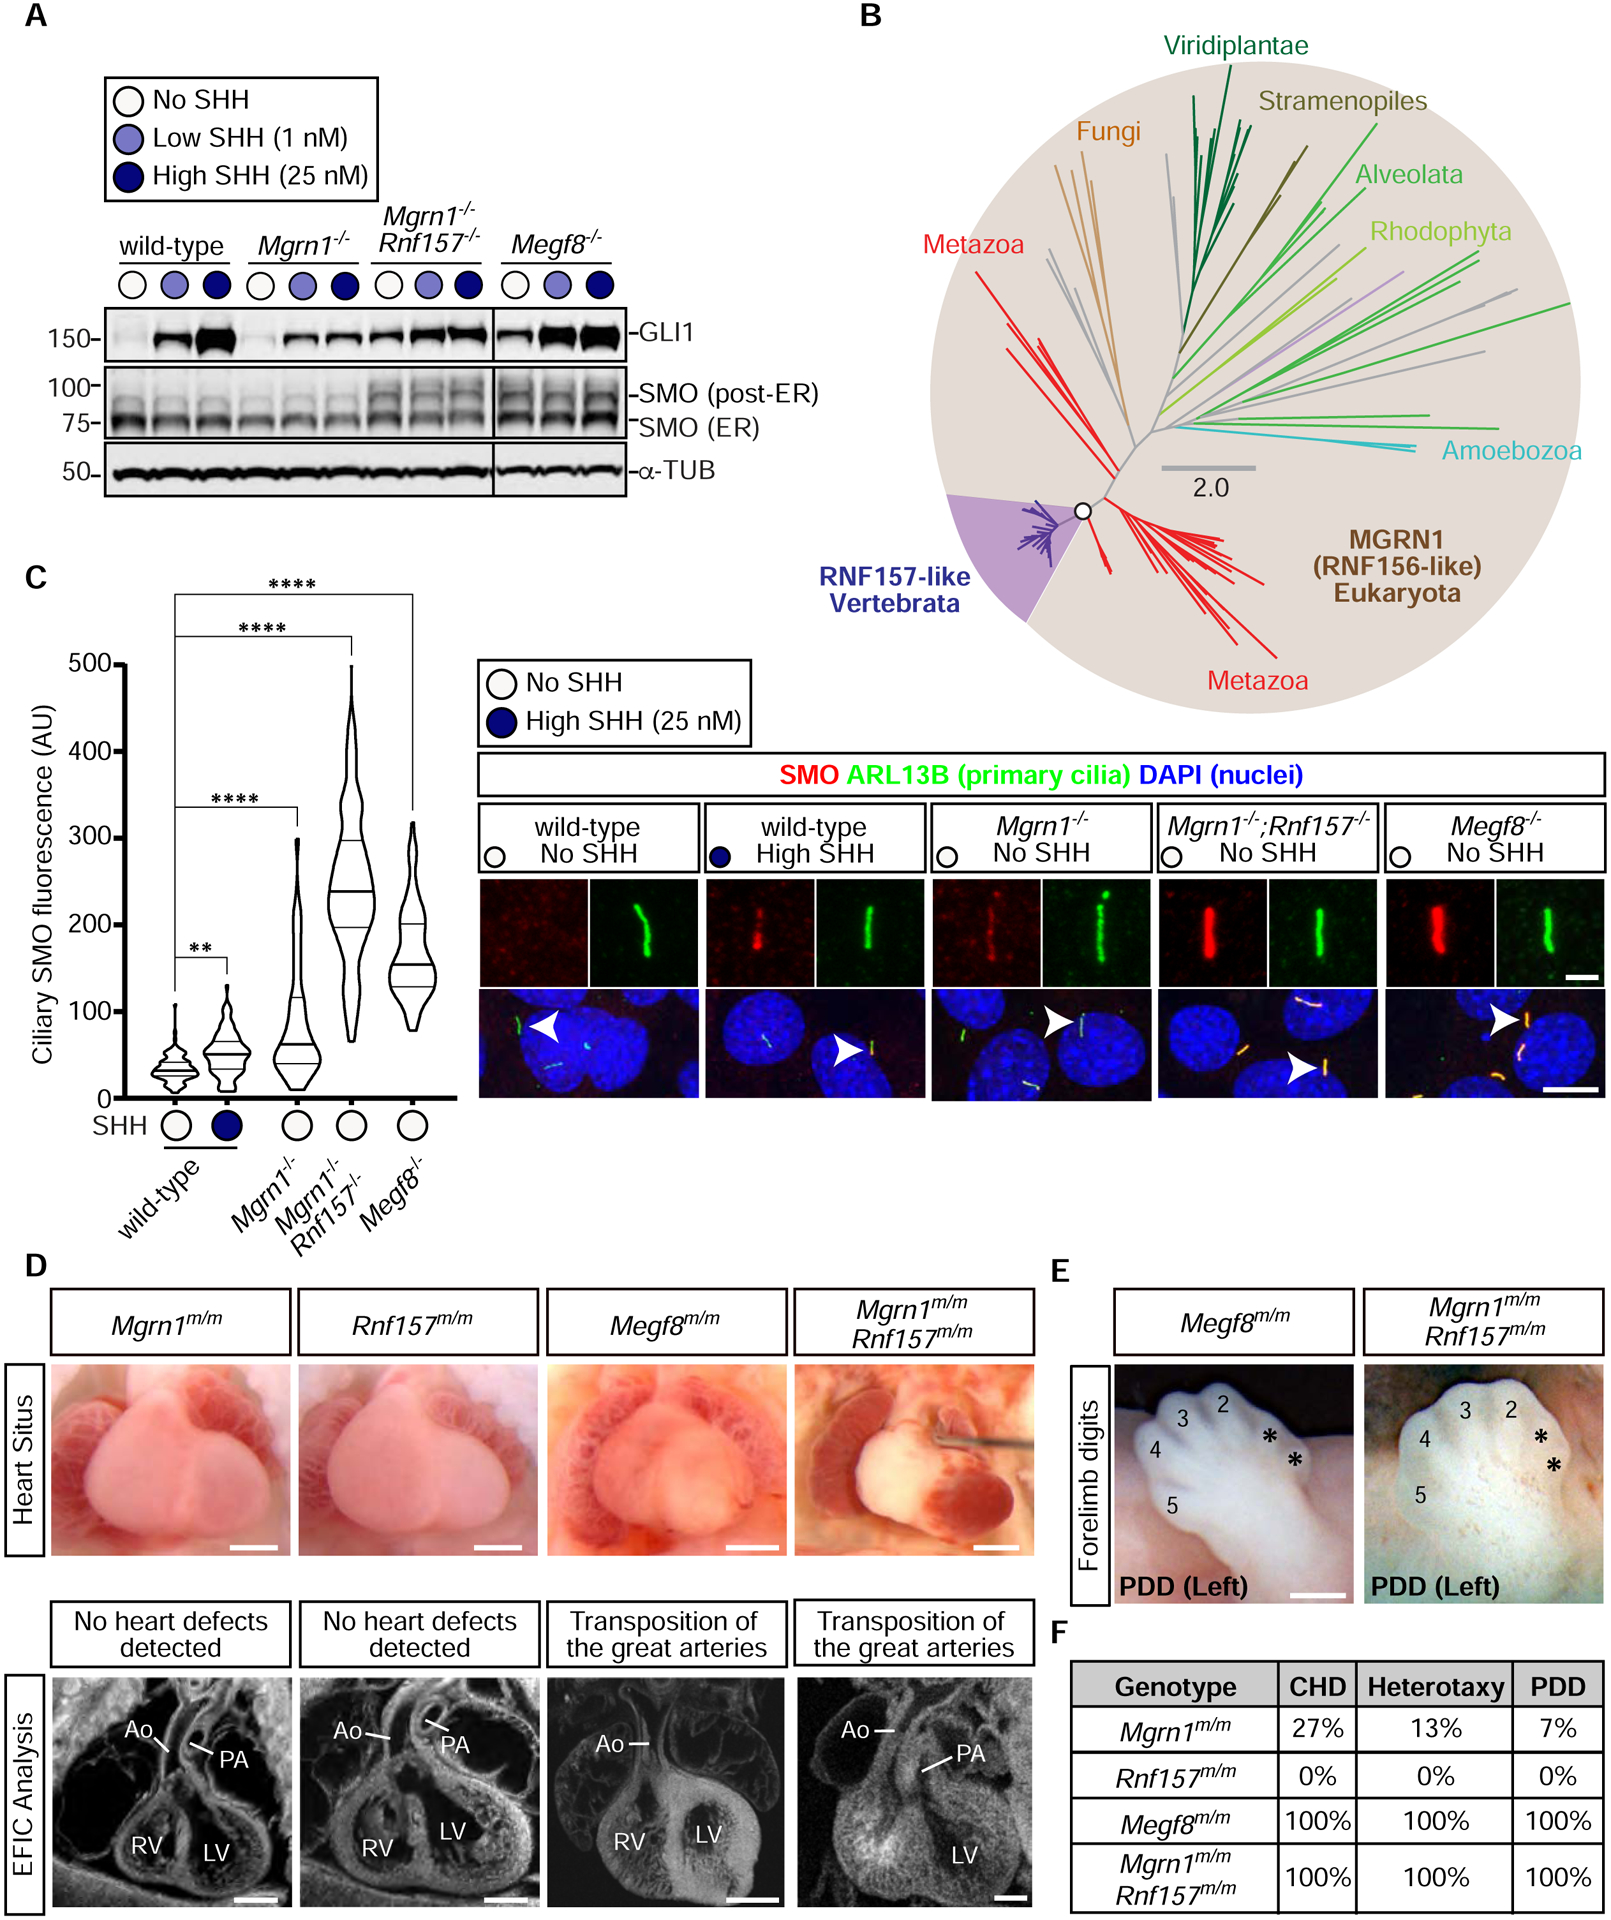
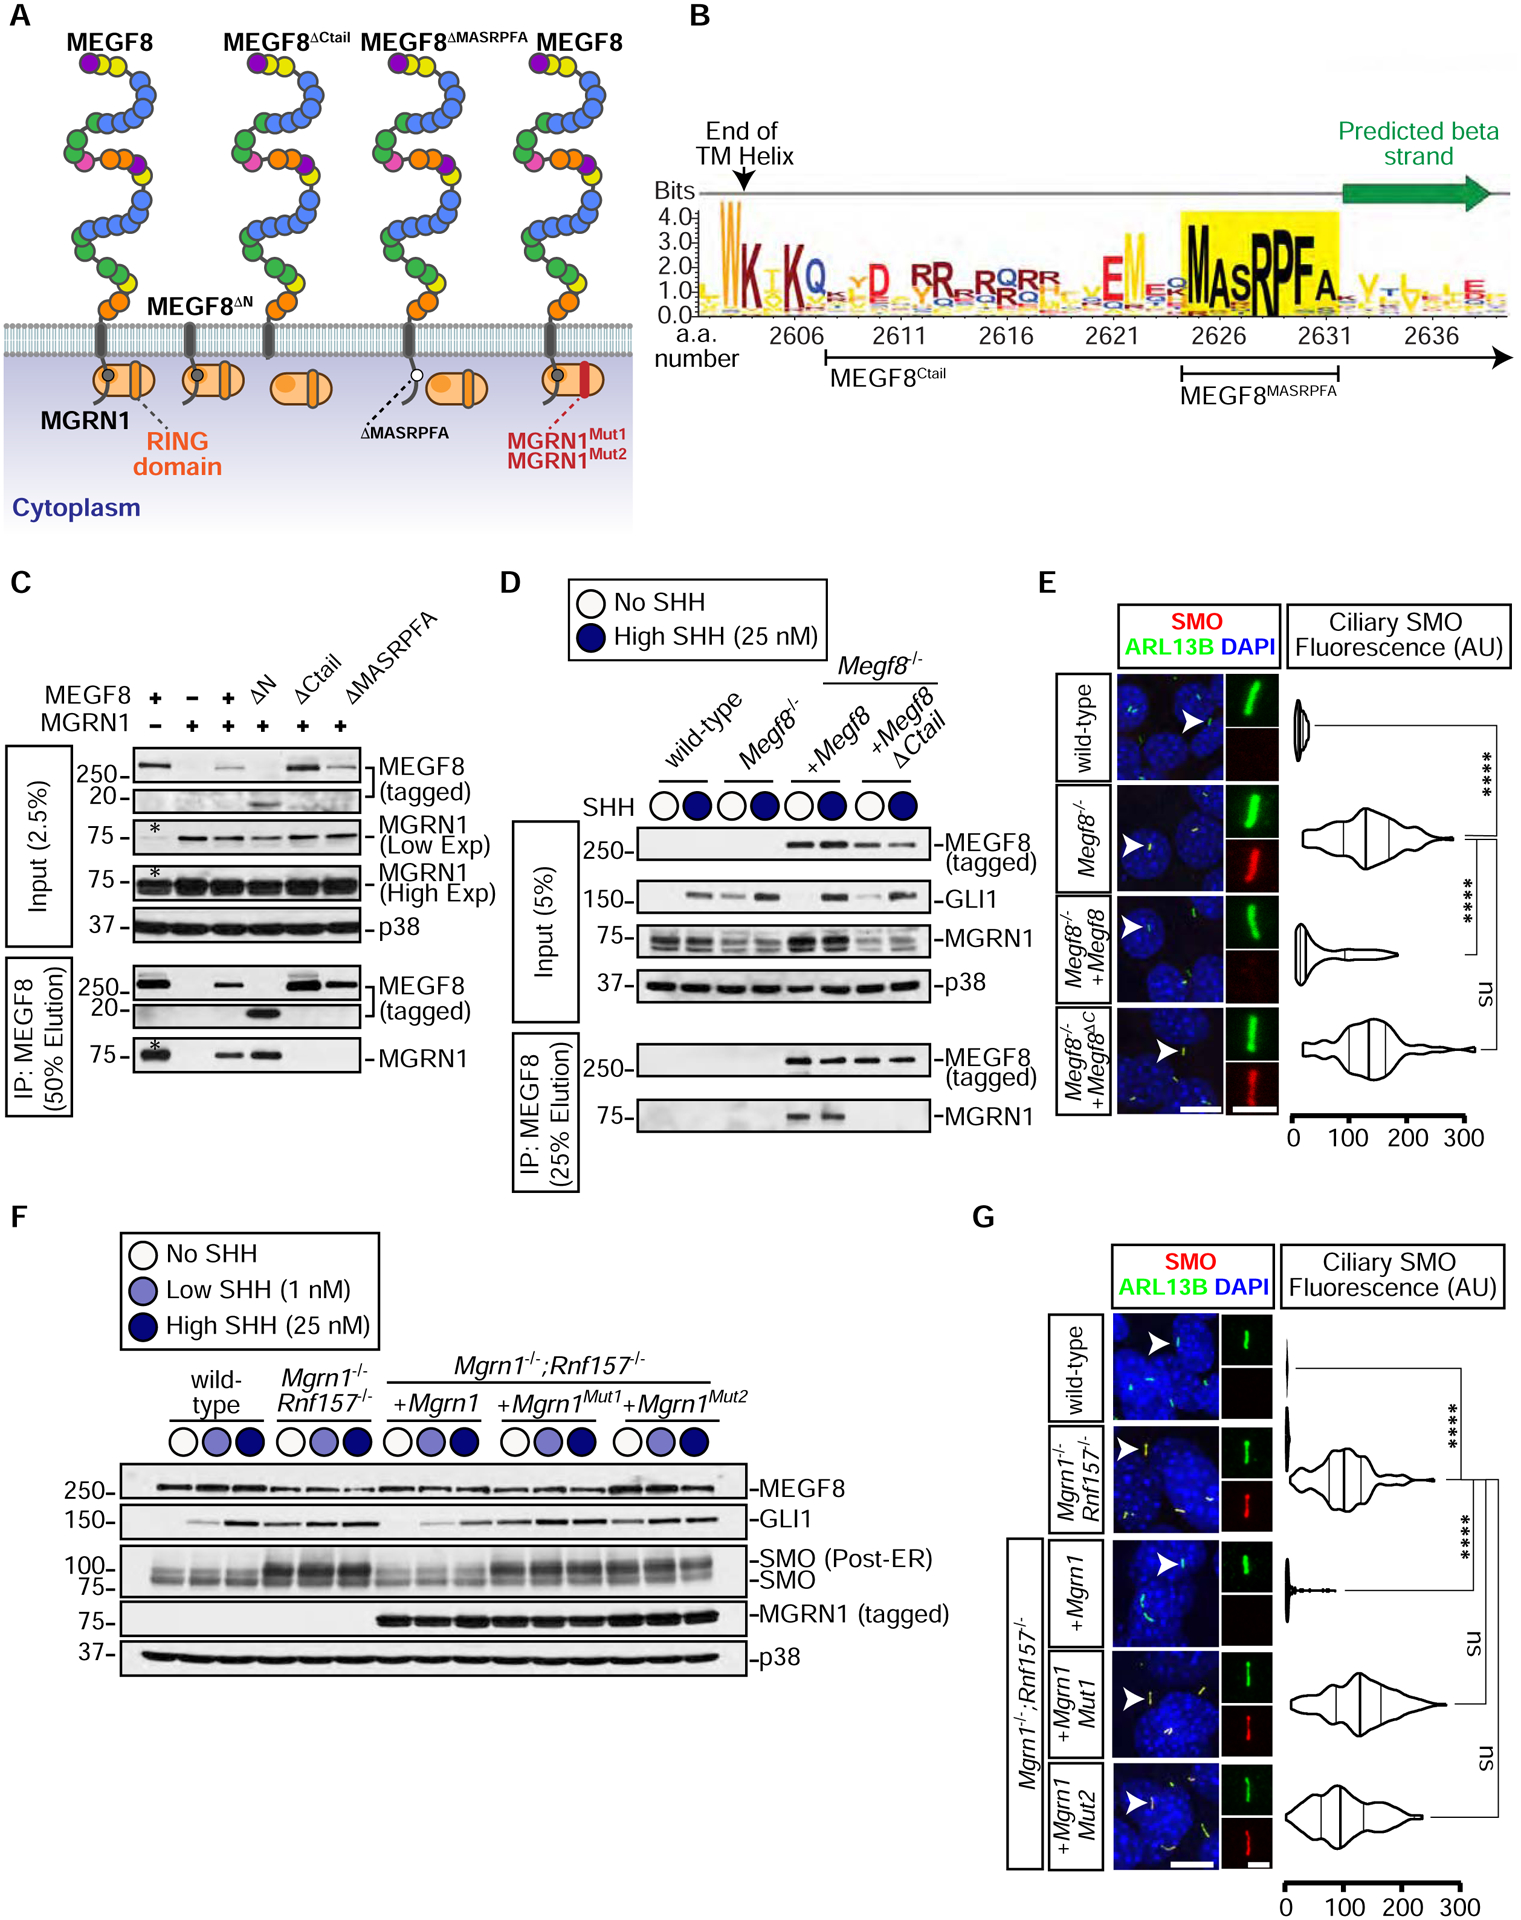
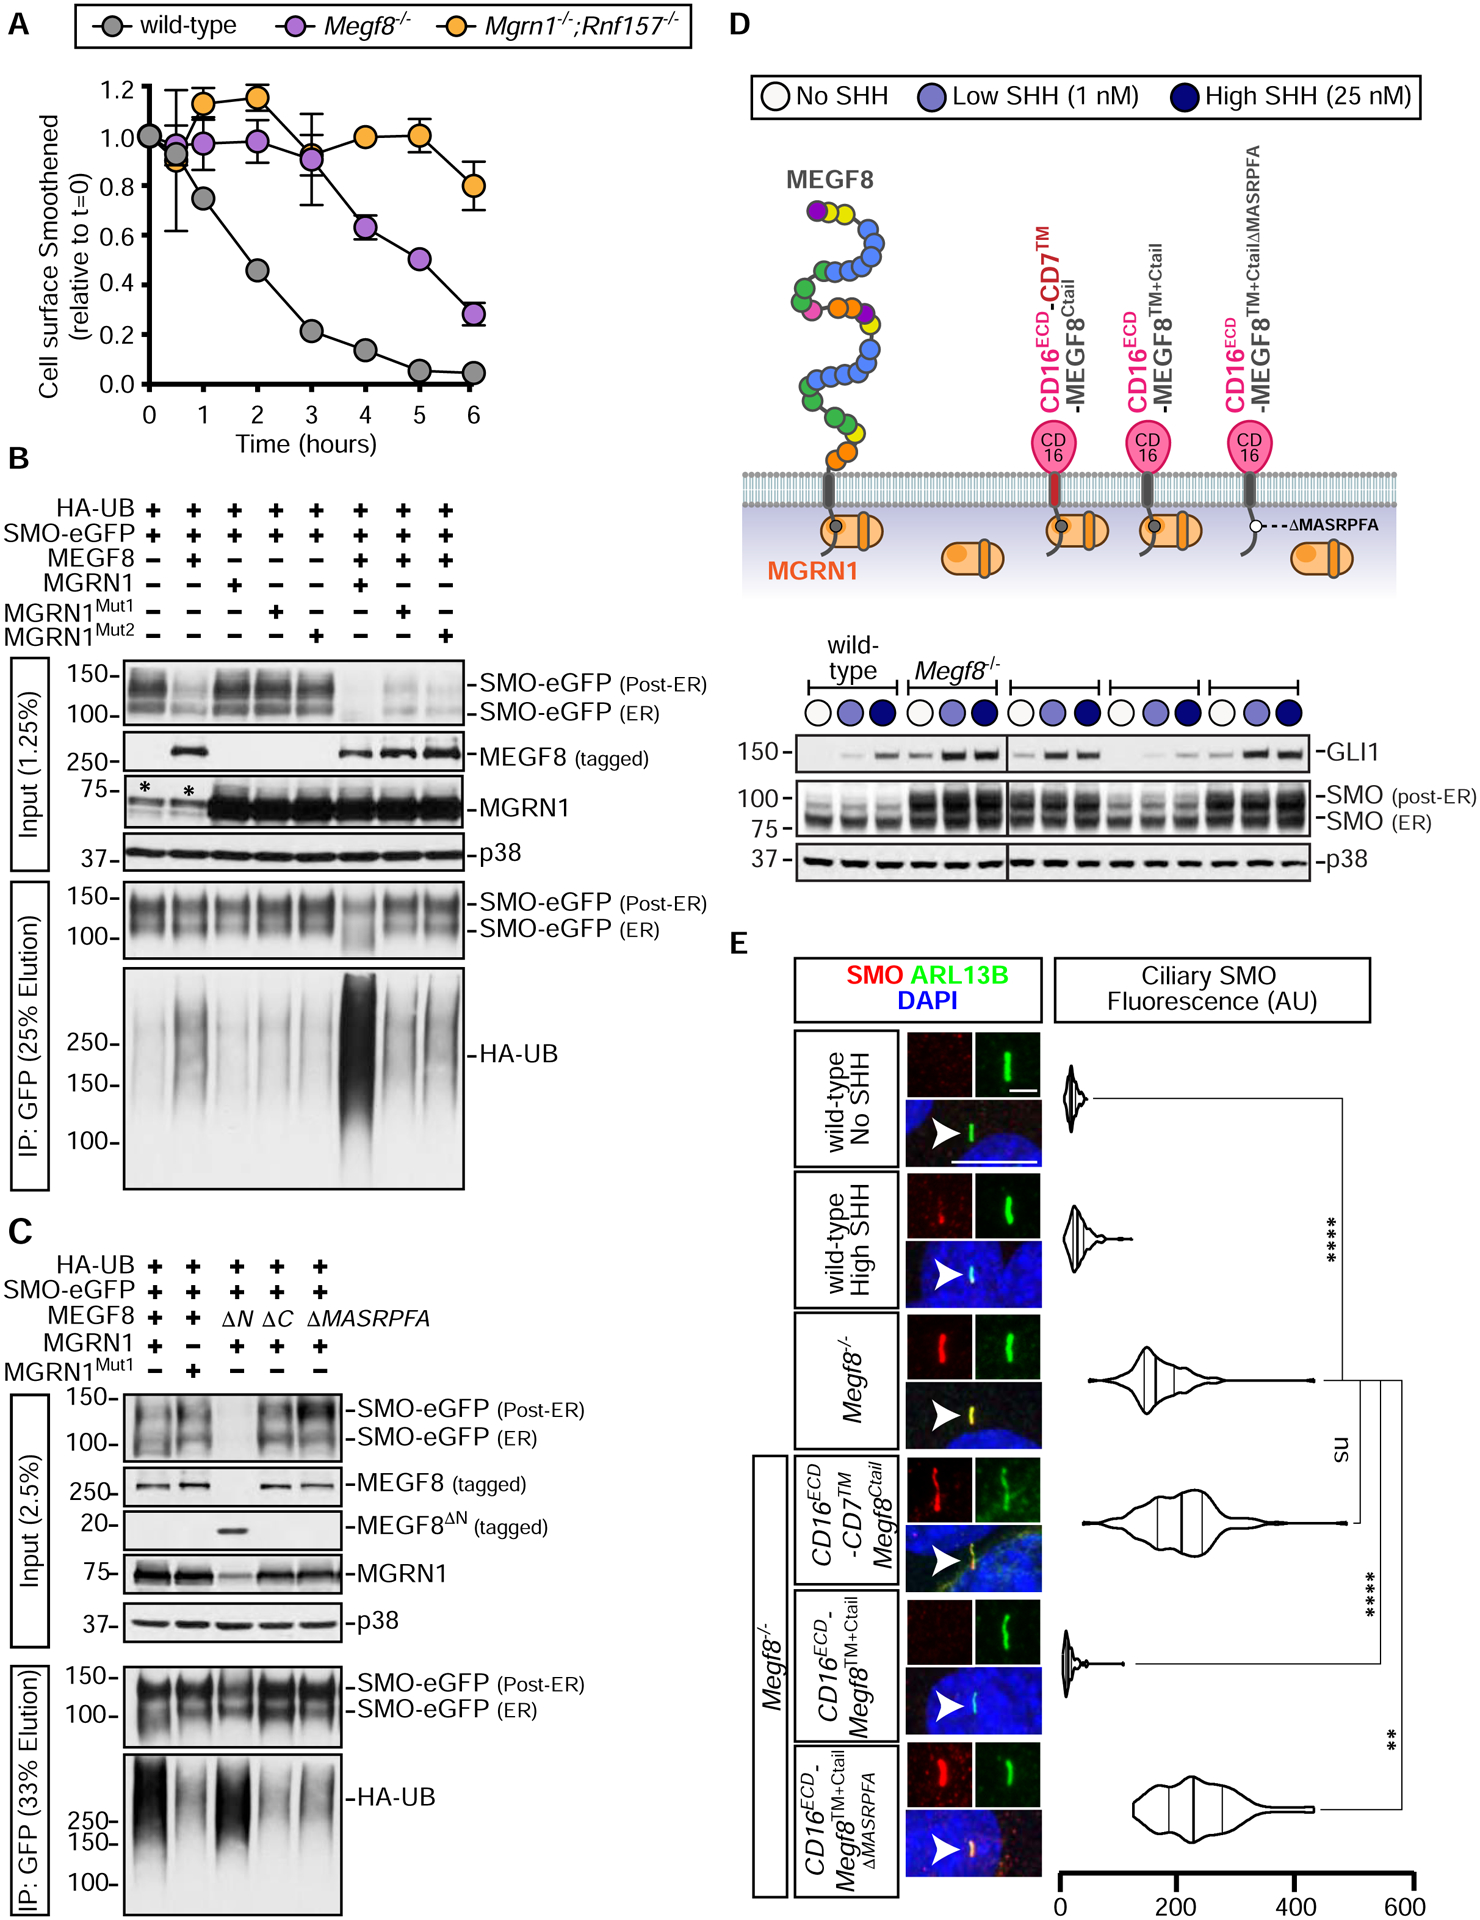
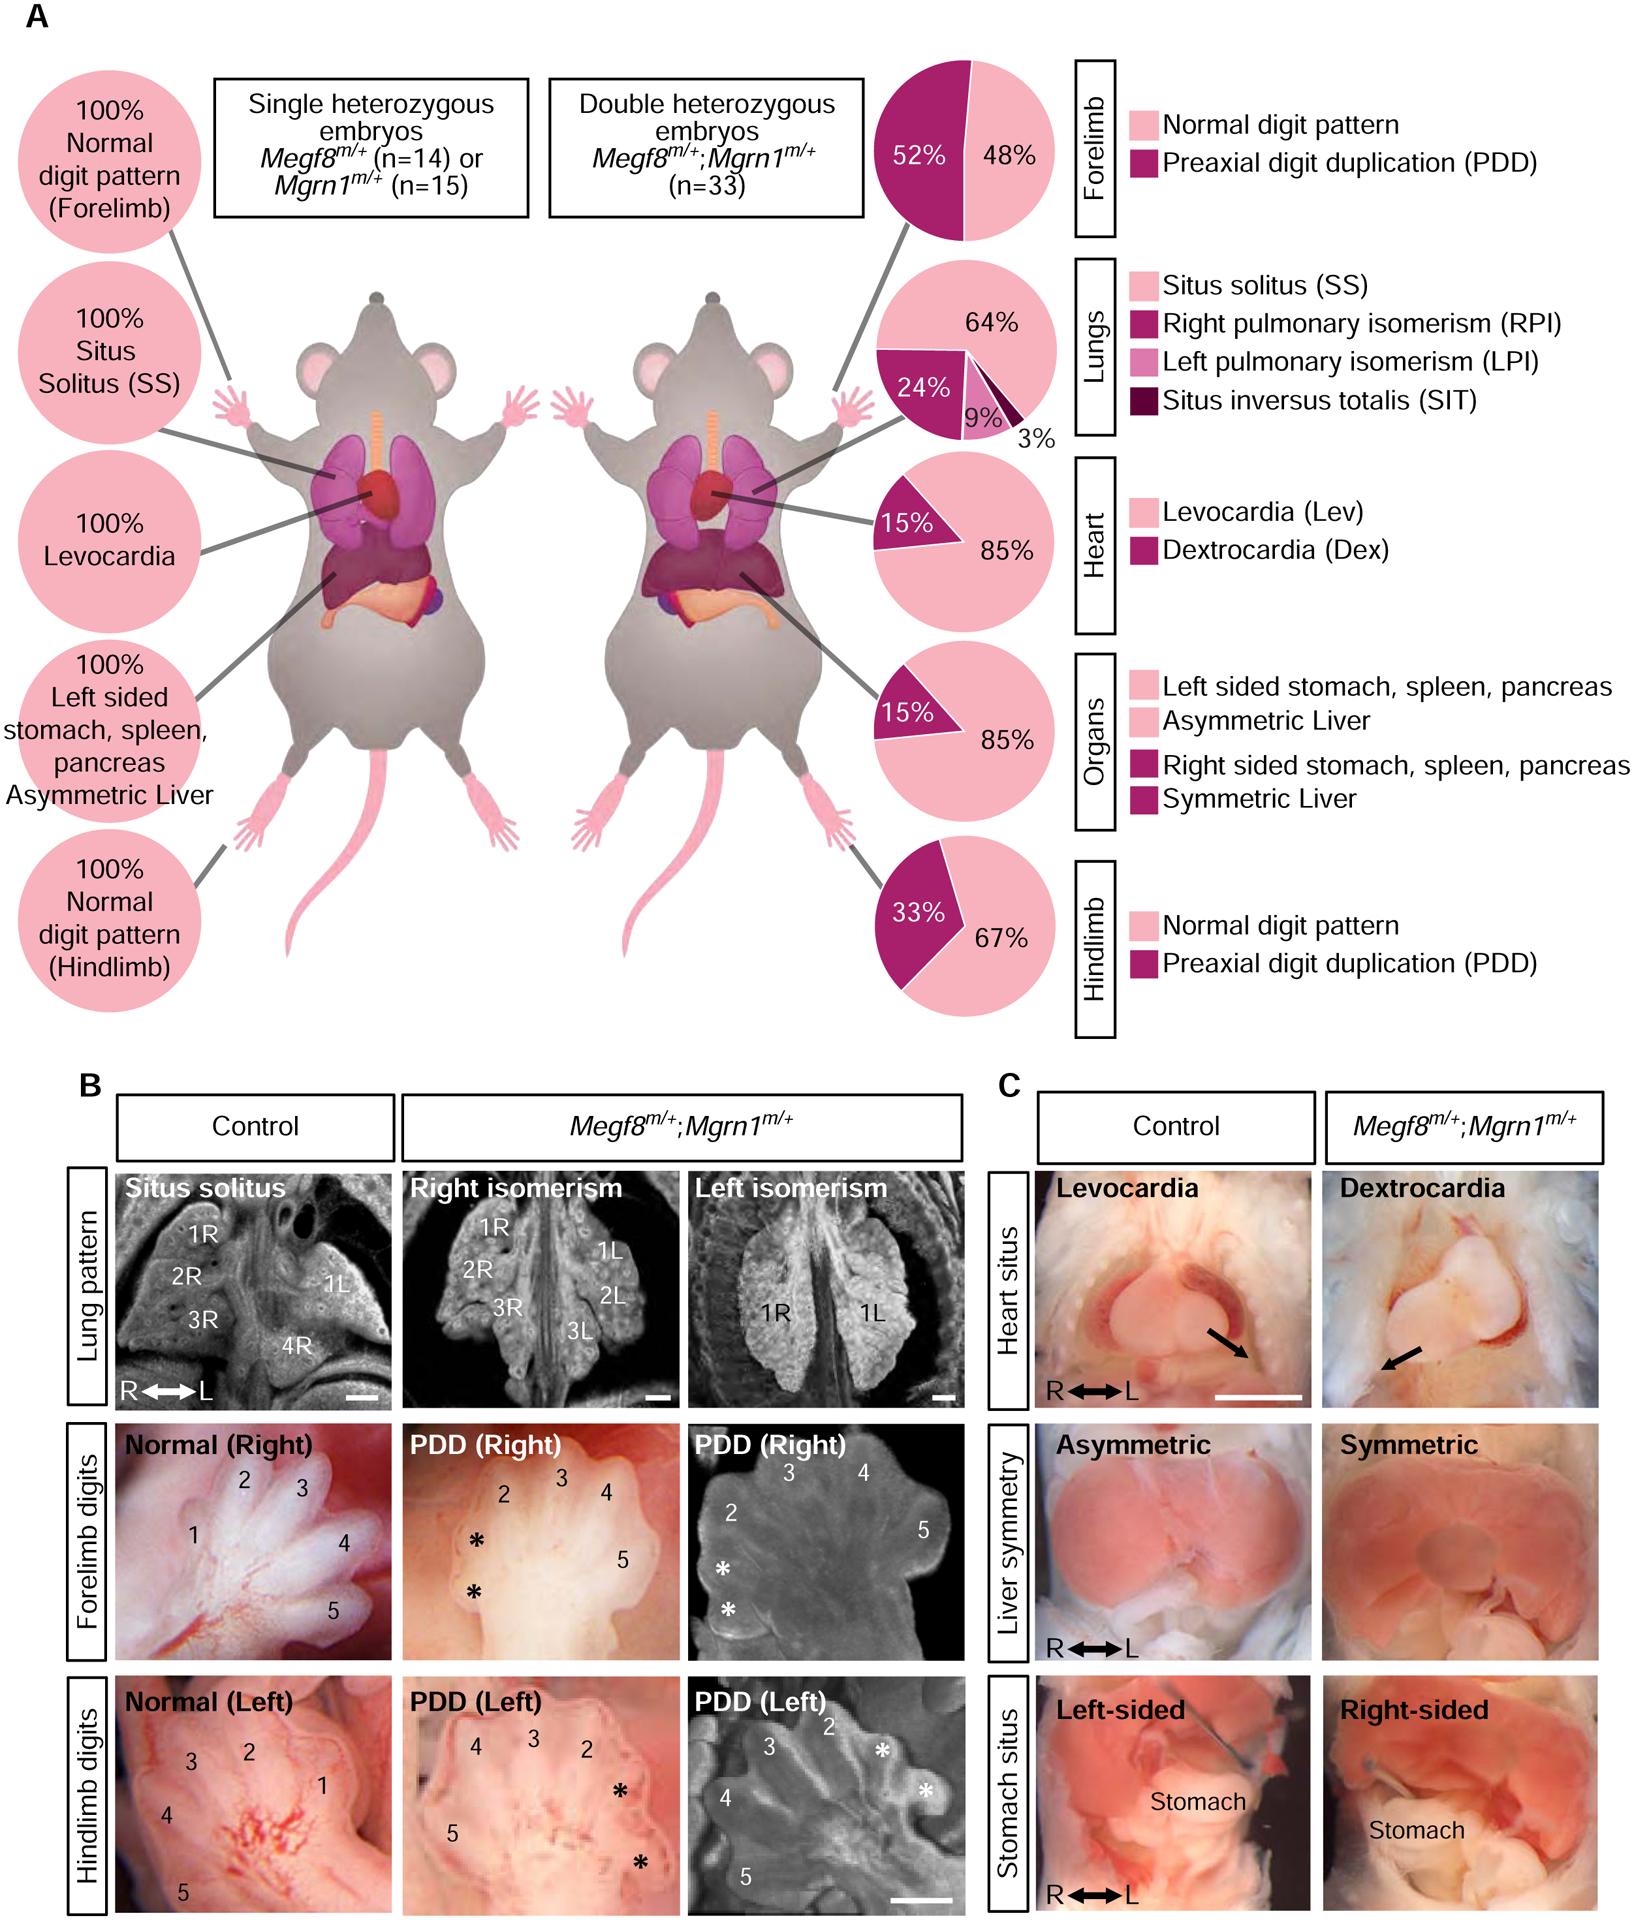
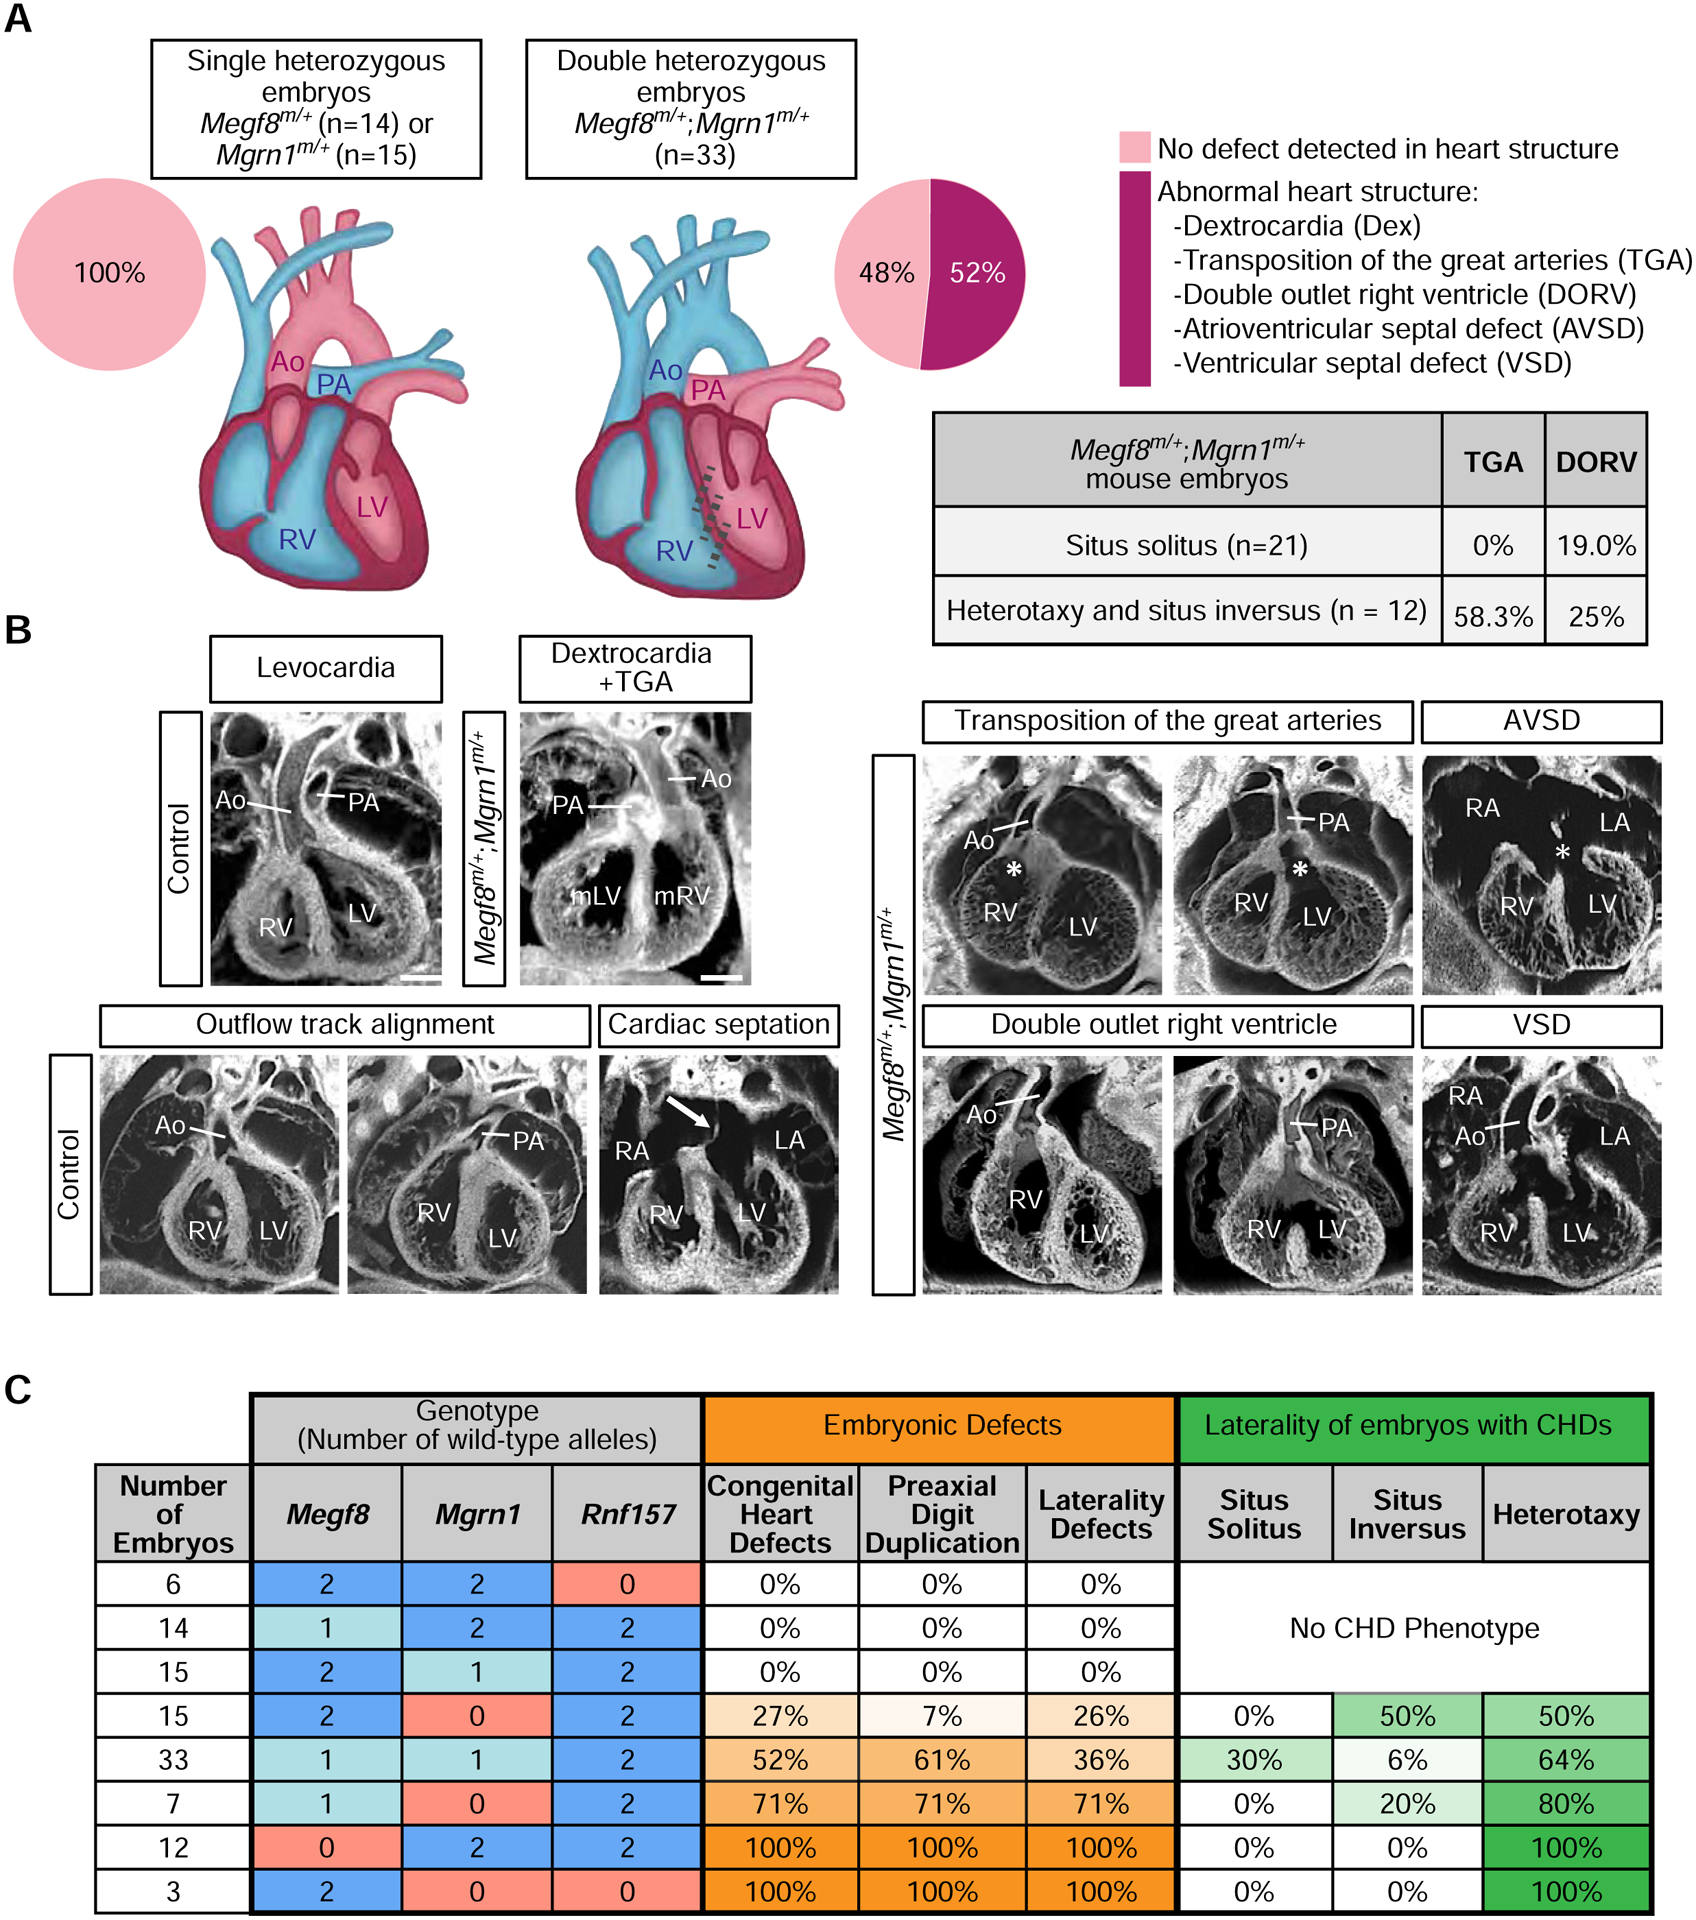
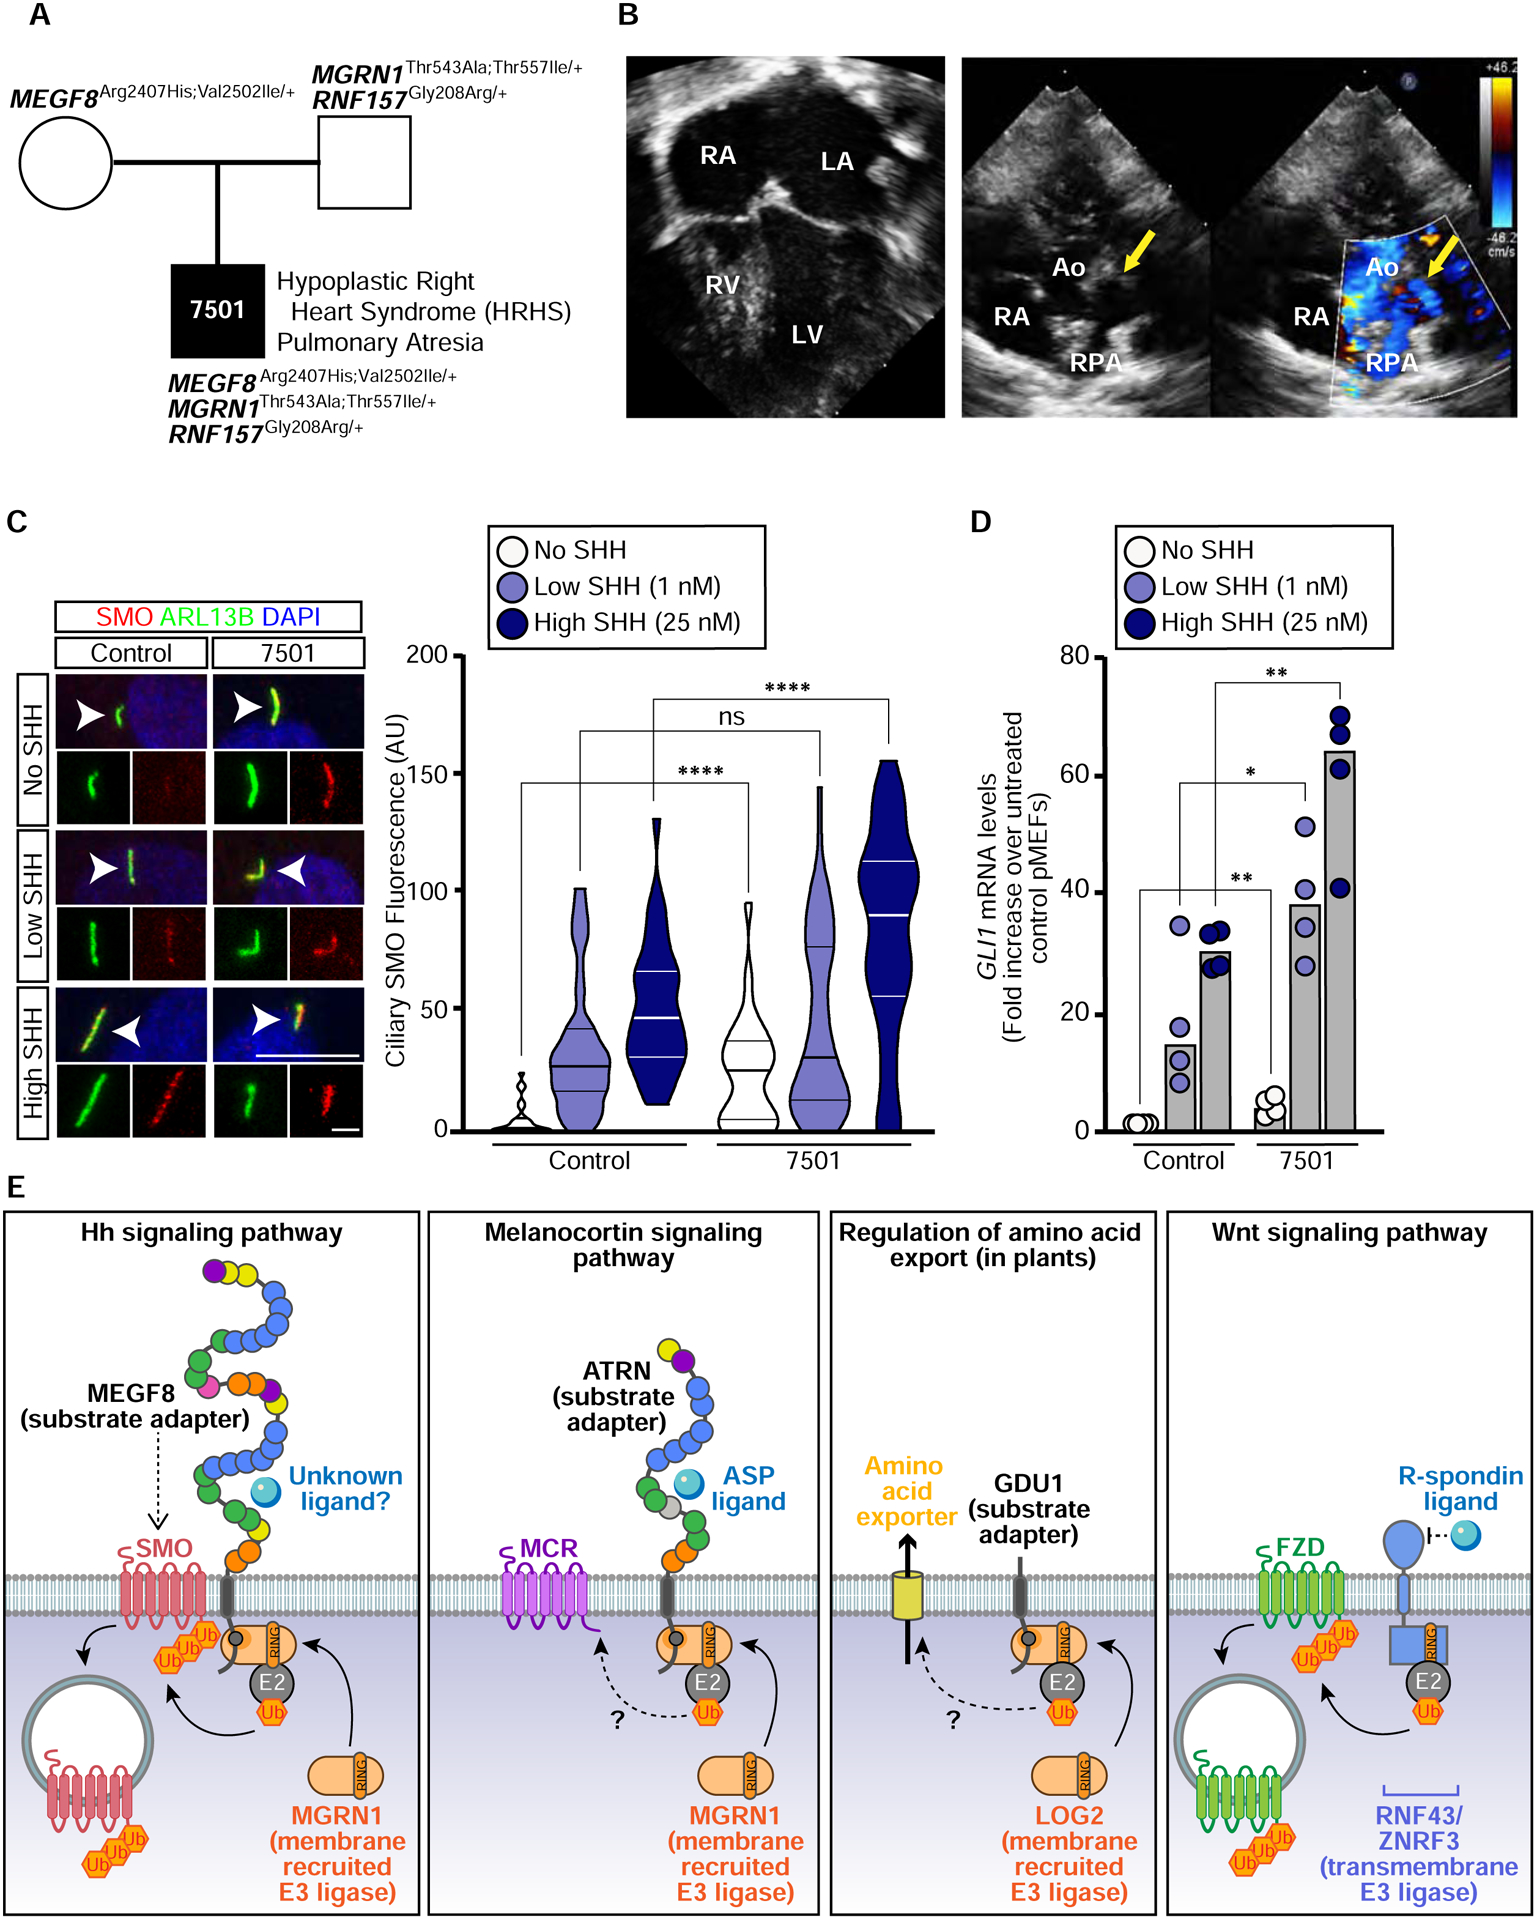
The etiology of congenital heart defects (CHDs), which are among the most common human birth defects, is poorly understood because of its complex genetic architecture. Here, we show that two genes implicated in CHDs, Megf8 and Mgrn1, interact genetically and biochemically to regulate the strength of Hedgehog signaling in target cells. MEGF8, a transmembrane protein, and MGRN1, a RING superfamily E3 ligase, assemble to form a receptor-like ubiquitin ligase complex that catalyzes the ubiquitination and degradation of the Hedgehog pathway transducer Smoothened. Homozygous Megf8 and Mgrn1 mutations increased Smoothened abundance and elevated sensitivity to Hedgehog ligands. While mice heterozygous for loss-of-function Megf8 or Mgrn1 mutations were normal, double heterozygous embryos exhibited an incompletely penetrant syndrome of CHDs with heterotaxy. Thus, genetic interactions can arise from biochemical mechanisms that calibrate morphogen signaling strength, a conclusion broadly relevant for the many human diseases in which oligogenic inheritance is emerging as a mechanism for heritability.

Keywords: Hedgehog signaling; Smoothened; congenital heart disease; heart development; heterotaxy; left-right patterning; morphogen; oligogenic inheritance; primary cilia; ubiquitin.


Conflict of interest statement

Declaration of Interests The authors declare no competing interests.

Figures

Figure 1:
Figure 1:. Elevated Hh signaling causes birth defect phenotypes in Megf8m/m embryos.
(A and B) Hh signaling strength was assessed using qRT-PCR (A) to measure mRNA for Gli1 (a direct Hh target gene used as a metric for signaling strength) or ciliary SMO abundance (B) in primary mouse embryonic fibroblasts (pMEFs) with the indicated genotypes. Each cell line tested was derived from a different embryo. Bars in (A) denote the median Gli1 mRNA values derived from the four individual measurements shown as circles. Violin plots in (B), with horizontal lines denoting the median and interquartile range, summarize SMO fluorescence at ~15–50 cilia. (C) Embryos (e14.5) of the indicated genotypes treated with Vismodegib according to the regimen shown at the top. The dotted box marks the hindlimb depicted in zoomed images and cartoons at the bottom show the number of digits. Scale bar, 1mm. (D) Graph showing the number of digits per limb (forelimb and hindlimb) in embryos of the indicated genotypes treated with Vismodegib. Each circle represents a single limb and the pink lines depict the median with interquartile range. (E) Table summarizing digit number and left-right patterning phenotypes in embryos of various genotypes, with or without Vismodegib treatment according to the regimen shown in (D). (F) A model for how the interaction between Vismodegib exposure and genotype influences digit number by altering the strength of Hh signaling Statistical significance was determined by one-way ANOVA (A) or Kruskal-Wallis (B and D); not-significant (ns) > 0.05 and ****p-value ≤ 0.0001. See also Figures S1 and S2.
Figure 2:
Figure 2:. RNF157 partially compensates for the loss of MGRN1
(A) Immunoblots showing GLI1 as a measure of Hh signaling strength and SMO abundance in the indicated NIH/3T3 cell lines treated with various concentrations of SHH. α-Tubulin (α-TUB) is a loading control. Two populations of SMO, localized in the ER or in post-ER compartments, are marked. An analysis of additional clonal cell lines is shown in Fig. S3C. (B) Unrooted maximum-likelihood tree topology showing the evolutionary relationship between MGRN1 and RNF157, with the vertebrate-specific RNF157 lineage highlighted in purple. The open circle denotes 100% confidence support (1000 replicates) and the scale bar indicates phylogenetic distance. The full Newick tree file is provided in Supplemental File 1. (C) Violin plots (left) with horizontal lines denoting the median and interquartile range and corresponding representative confocal fluorescence microscopy images (right) of SMO (red) at primary cilia (green, marked by ARL13B) in NIH/3T3 cells with the indicated genotypes (n~70 cilia/condition). Arrowheads identify individual cilia captured in the zoomed images above each panel. Statistical significance was determined by the Kruskal-Wallis test; **p-value ≤ 0.01 and ****p-value ≤ 0.0001. Scale bars, 10 μm in merged panels and 2 μm in zoomed displays. See Fig. S3D for an analysis of additional clonal cell lines. (D) Necropsy (top row) and episcopic confocal microscopy (ECM, bottom row) images of embryonic hearts from e13.5–14.5 embryos of the indicated genotypes. Scale bars, 200 μm. (E) Forelimbs of embryos show preaxial digit duplication (PDD). Asterisks (*) mark the duplicated digits. Scale bar, 200 μm. (F) Table summarizes the frequency of CHDs, heterotaxy, and PDD in Mgrn1m/m (n=15), Rnf157m/m (n=6), Megf8m/m (n=12), and Mgrn1m/m;Rnf157m/m (n=3) embryos. A detailed list of phenotypes observed in each embryo can be found in Table S1. See also Figure S3, Table S1, and File S1.
Figure 3:
Figure 3:. The interaction between MGRN1 and MEGF8 is required to attenuate Hedgehog signaling
(A) Depictions of full length MEGF8, truncated MEGF8 (MEGF8ΔN, MEGF8ΔCtail, MEGF8ΔMASRPFA), functional MGRN1, and catalytically inactive MGRN1 (MGRN1Mut1 and MGRN1Mut2) proteins. The multiple domains in the extracellular region of MEGF8 are shown as circles and colored as in Fig. S1A. (B) Sequence logo showing the conservation in sequence entropy bits of the MASRPFA sequence (yellow shading) in the cytoplasmic tail of MEGF8 and related proteins (alignment shown in Fig. S4A). Deletion boundaries for the MEGF8 mutants shown in Fig. 3A are noted below the logo. (C) The interaction between MEGF8 or MEGF8 mutants (see Fig. 3A, all 1D4 tagged) and MGRN1 (FLAG tagged) was tested by transient co-expression in HEK293T cells, followed by immunoprecipitation (IP) of MEGF8. Asterisk (*) indicates endogenous MGRN1 in HEK293T cells. (D and E) GLI1 abundance was measured by immunoblotting (D) and SMO ciliary abundance by confocal fluorescence microscopy (E) in Megf8−/− NIH/3T3 cells stably expressing 1D4-tagged MEGF8 or MEGF8ΔCtail (see Fig. 3A). The interaction between MEGF8 and endogenous MGRN1 was tested by co-IP in (D). (F and G) GLI, SMO and MEGF8 abundances were measured by immunoblotting (F) and SMO ciliary abundance by confocal fluorescence microscopy (G) in Mgrn1−/−;Rnf157−/− NIH/3T3 cells stably expressing wild-type MGRN1 or variants carrying inactivating mutations in the RING domain (MGRN1Mut1 and MGRN1Mut2, see Figs. 3A and S4B). Violin plots (E, G) summarize the quantification of SMO fluorescence (red) at ~50 individual cilia (green) per cell line from representative images of the type shown immediately to the left. Statistical significance was determined by the Kruskal-Wallis test; not-significant (ns) > 0.05 and ****p-value ≤ 0.0001. Scale bars, 10 μm in merged panels and 2 μm in zoomed displays. See also Figure S4.
Figure 4:
Figure 4:. Smoothened is ubiquitinated by the MEGF8-MGRN1 complex.
(A) Degradation of cell-surface SMO in NIH/3T3 cells of the indicated genotypes. See Fig. S5 for details. Error bars represent the standard error of two independent replicates. (B and C) SMO ubiquitination was assessed after transient co-expression of the indicated proteins in HEK293T cells (see Fig. 3A). Cells were lysed under denaturing conditions, SMO was purified by IP, and the amount of HA-UB covalently conjugated to SMO assessed using immunoblotting with an anti-HA antibody. An asterisk (*) indicates endogenous MGRN1. (D and E) Total GLI1 and SMO abundances were measured by immunoblotting (D) and ciliary SMO (n~50 cilia) by fluorescence confocal microscopy (E) in Megf8−/− cells expressing various CD16/CD7/MEGF8 chimeras. The ability of these chimeras to support SMO ubiquitination is shown in Fig. S6D and the abundances of chimeras at the cell surface is shown in Fig. S6E. Statistical significance in (E) was determined by the Kruskal-Wallis test; not-significant (ns) > 0.05, **p-value ≤ 0.01, and ****p-value ≤ 0.0001. Scale bars, 10 μm in merged panels and 2 μm in zoomed displays. See also Figures S5 and S6.
Figure 5:
Figure 5:. A genetic interaction between Megf8 and Mgrn1 causes heart defects and heterotaxy
(A) Summary of phenotypes observed in mouse embryos with the indicated genotypes (e13.5–14.5). Dex, dextrocardia; Lev, levocardia; LPI, left pulmonary isomerism; PDD, preaxial digit duplication; RPI, right pulmonary isomerism; SIT, situs inversus; SS, situs solitus. A detailed list of phenotypes observed in each embryo can be found in Tables S2, S3, and S4. (B) Representative light microscopy and ECM images of the developing lungs and limbs of single (control) and double heterozygous embryos. The normal right lung has 4 lobes (1R, 2R, 3R and 4R) and the left lung has one lobe (1L). Asterisks (*) mark the duplicated preaxial digits. (C) Representative necropsy images showing the position of the heart, symmetry of the liver, and location of the stomach in single (control) and double heterozygous embryos. Arrow (top row) denotes the direction of the cardiac apex. See also Tables S2, S3, and S4.
Figure 6:
Figure 6:. Spectrum of heart defects in mice carrying mutant alleles of Megf8 and Mgrn1
(A and B) Summary of congenital heart defects (CHDs) in mouse embryos of various genotypes (e13.5–14.5) as determined by ECM imaging. (B) Shows representative ECM images of the many defects observed in double heterozygous embryos, along with normal hearts from control (single heterozygous) embryos. Ao, aorta; AVSD, atrioventricular septal defect; Dex, dextrocardia; LA, left atrium; LV, left ventricle; mLV, morphological left ventricle; mRV, morphological right ventricle; PA, pulmonary artery; RA, right atrium; RV, right ventricle; VSD, ventricular septal defect. A detailed phenotypic analysis of each embryo can be found in Tables S2, S3, and S4. Scale bars, 100 μm. (C) Table shows the frequencies of CHDs, preaxial digit duplication, and laterality defects observed in mouse embryos carrying increasing numbers of mutant alleles of Megf8, Mgrn1, and Rnf157. Darker shades of orange and green indicate a higher penetrance of the indicated birth defect and laterality phenotype, respectively. A detailed phenotypic analysis of every embryo of each genotype can be found in Tables S1–S5 and a full compilation of the penetrance of various phenotypes is provided in Table S6. For a more detailed analysis of the correlation between laterality and CHD phenotypes observed in Megf8m/+;Mgrn1m/+ embryos, refer to Table S7. See also Tables S1–S7.
Figure 7:
Figure 7:. Damaging variants in MEGF8, MGRN1, and RNF157 are associated with congenital heart defects in humans
(A) Trio pedigree analysis showing the inheritance of MEGF8, MGRN1, and RNF157 variants from two affected parents to a progeny (patient 7501) with severe CHDs. The position of these variants in MEGF8, MGRN1, and RNF157, their evolutionary conservation, allele frequency and predicted damaging effect on protein function are shown in Figs. S7A and S7B. Whole exome sequencing results can be found in Table S8. (B) Four-chamber view (left) or short axis view (right) of an echocardiogram from patient 7501 demonstrating a hypoplastic right ventricle (RV) and membranous pulmonary atresia (yellow arrows). RA, right atrium; LA, left atrium; LV, left ventricle; RPA, Right Pulmonary Artery; Ao, Aorta. (C and D) Ciliary SMO (C) or GLI1 qRT-PCR (D) was used to assess Hh signaling in primary fibroblasts from patient 7501 (A) and from an unaffected control. Scale bars are 10 μm in merged panels and 2 μm in zoomed displays. The violin plot in (C) summarizes the quantification of SMO at ~20–50 cilia for each condition and the bars in (D) denote the median GLI1 mRNA values derived from the four individual measurements shown. Statistical significance was determined by the Mann-Whitney test (C) and unpaired t-test (D); not-significant (ns) > 0.05, *p-value ≤ 0.05, **p-value ≤ 0.01, ****p-value ≤ 0.0001. (E) Regulation of signaling and transport by receptor-like E3 ubiquitin ligases. A model for the mechanism of SMO regulation by the MEGF8-MGRN1 complex (far left) highlights its conceptual similarity to the regulation of melanocortin receptors (MCRs) by the ATRN-MGRN1 complex (middle left), amino acid export by the GDU1-LOG2 complex in plants (middle right), and Frizzled (FZD) receptors for WNT ligands by the ZNRF3/RNF43 family of transmembrane E3 ligases (far right). MEGF8 functions as a transmembrane substrate adaptor, recruiting MGRN1 (and presumably an unknown E2 enzyme) through its cytoplasmic tail to promote the ubiquitination of SMO. SMO ubiquitination leads to its internalization and degradation, thus attenuating responses to Hh ligands. See also Figure S7 and Table S8.

Comment in

References

    1. Altschul SF, Madden TL, Schäffer AA, Zhang J, Zhang Z, Miller W, and Lipman DJ (1997). Gapped BLAST and PSI-BLAST: a new generation of protein database search programs. Nucleic Acid s Research 25: 3389––3402. - PMC - PubMed
    1. Ashkenazy H, Abadi S, Martz E, Chay O, Mayrose I, Pupko T, and Ben-Tal N (2016). ConSurf 2016: an improved methodology to estimate and visualize evolutionary conservation in macromolecules. Nucleic Acids Res. 44, W344–W350. - PMC - PubMed
    1. Aune CN, Chatterjee B, Zhao X-Q, Francis R, Bracero L, Yu Q, Rosenthal J, Leatherbury L, and Lo CW (2008). Mouse model of heterotaxy with single ventricle spectrum of cardiac anomalies. Pediatr. Res 63, 9–14. - PubMed
    1. Auwera G, and Others (2016). From FastQ data to high confidence variant calls: the Genome Analysis Toolkit best practices pipeline. HHS Public Access, Published online October 15, 2013. - PMC - PubMed
    1. Badano JL, Mitsuma N, Beales PL, and Katsanis N (2006). The ciliopathies: an emerging class of human genetic disorders. Annu. Rev. Genomics Hum. Genet 7, 125–148. - PubMed

Publication types