. 2021 Mar;191(3):425-437.
doi: 10.1016/j.ajpath.2020.09.004. Epub 2020 Sep 20.

Characterization of Clinical and Immune Responses in an Experimental Chronic Autoimmune Uveitis Model

Affiliations

Characterization of Clinical and Immune Responses in an Experimental Chronic Autoimmune Uveitis Model

Nai-Wen Fan et al. Am J Pathol. 2021 Mar.

Abstract

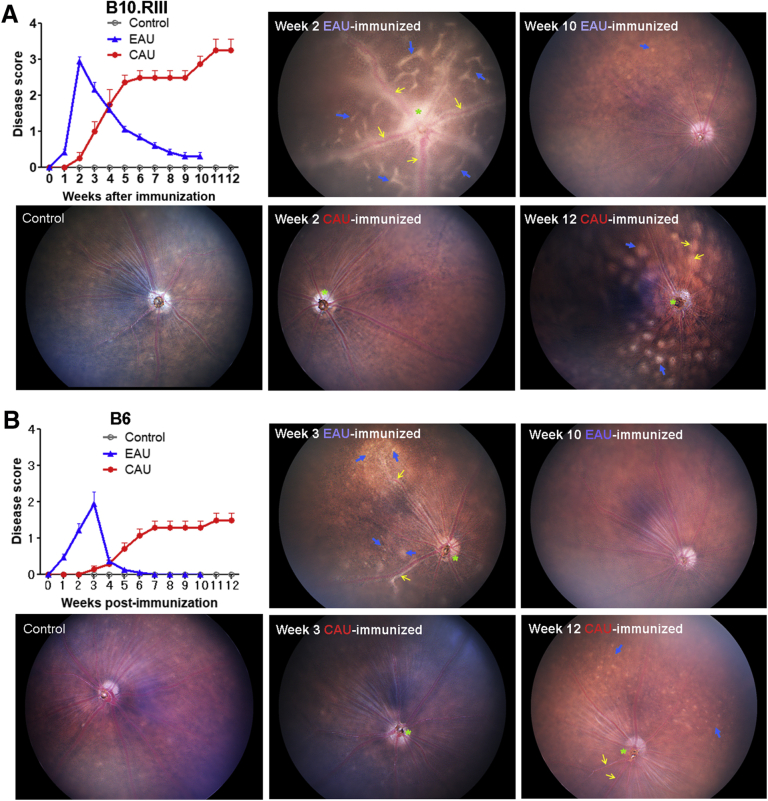
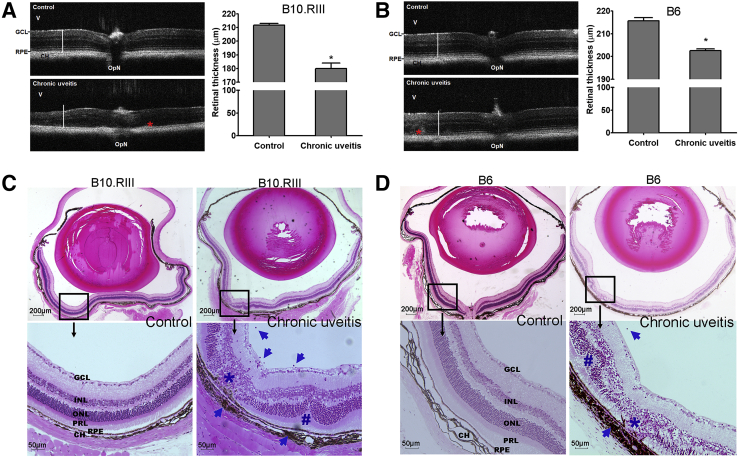
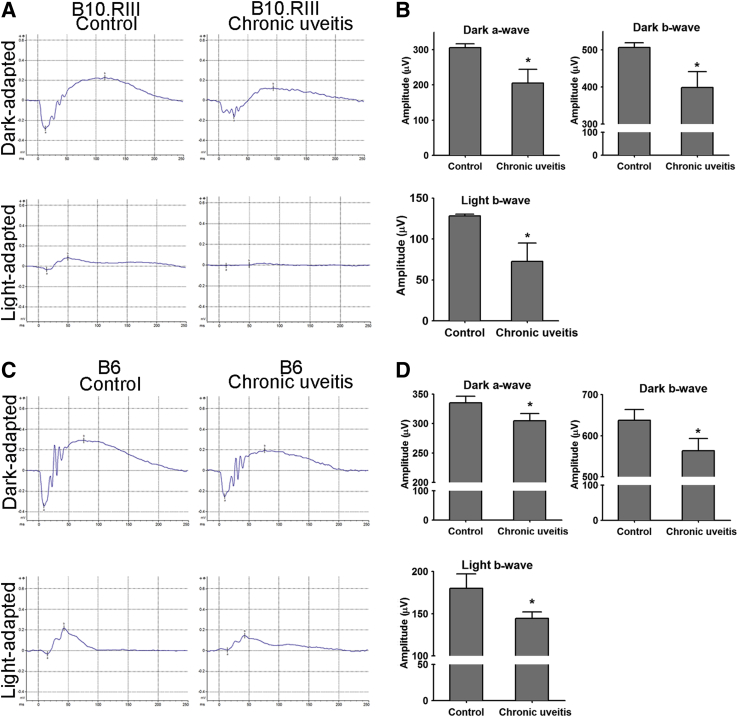
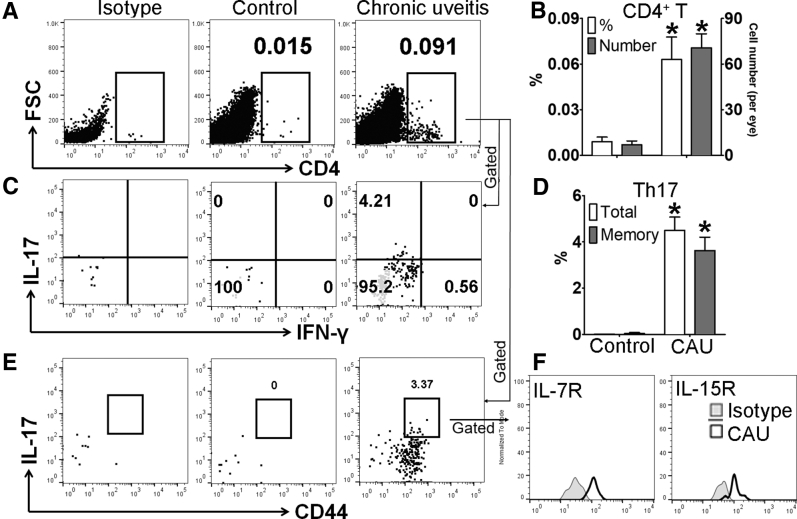
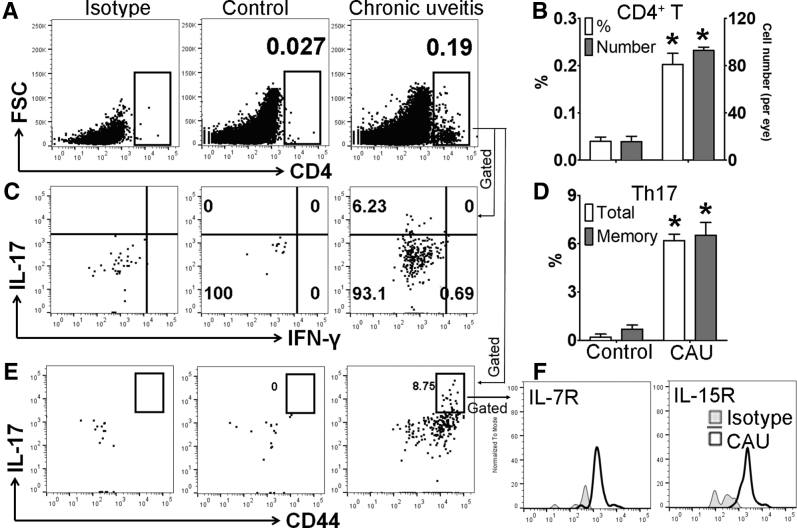
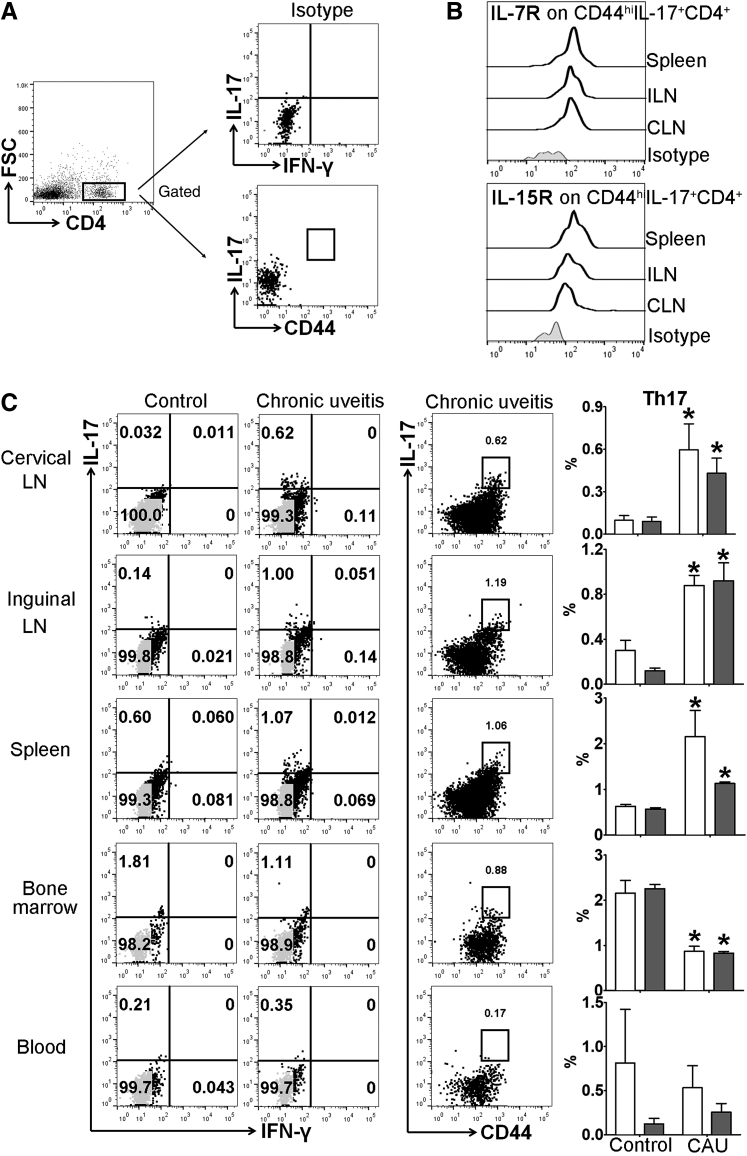
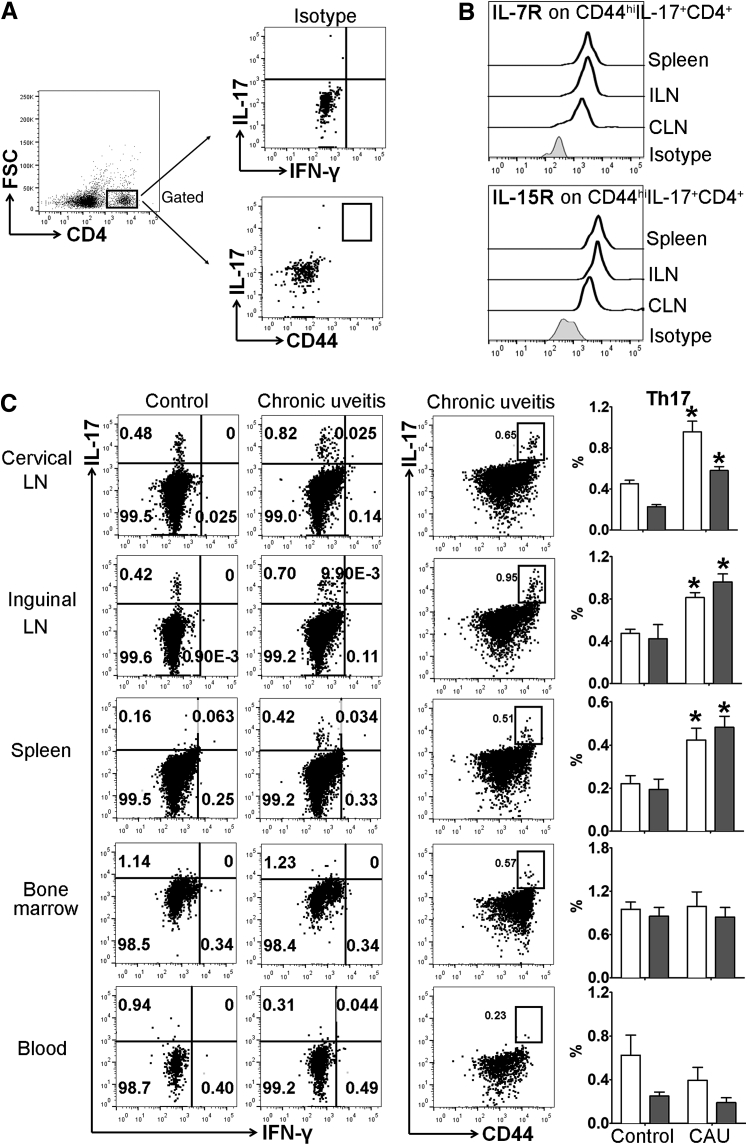
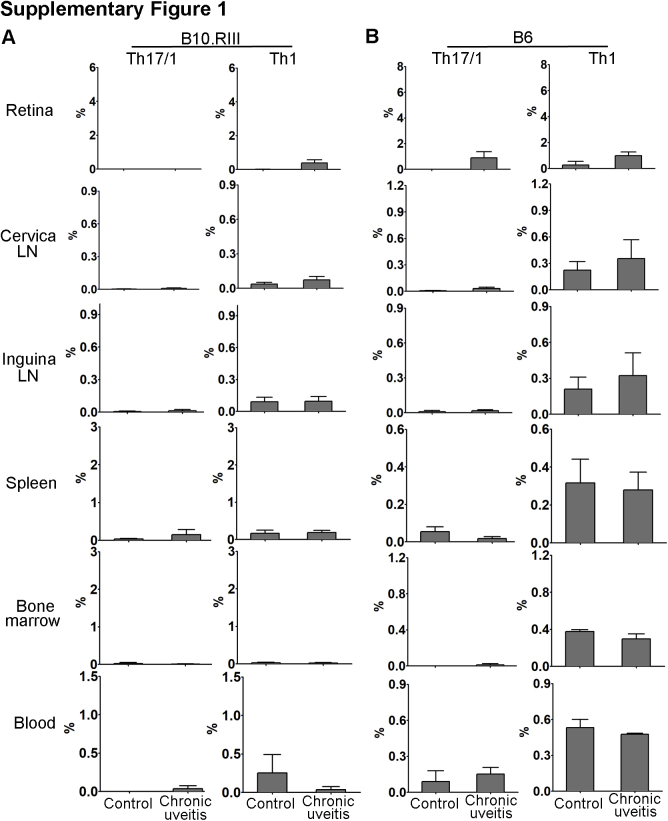
Autoimmune uveitis is a sight-threatening intraocular inflammatory disease. For >30 years, the mouse model of experimental autoimmune uveitis has been employed to investigate disease mechanisms and test immunotherapeutic approaches. However, inflammation in this model is self-limited, and does not replicate the chronic, insidious nature prevalent in the human disease. Herein, a robust and reliable model of chronic autoimmune uveitis was developed and characterized in two strains of wild-type mice by modifying interphotoreceptor retinoid-binding protein dose and peptide fragments from conventional experimental autoimmune uveitis models. In both of these murine strains, immunization with our modified protocols resulted in a slowly progressive uveitis, with retinal scars and atrophy observed in the chronic stage by fundoscopy. Optical coherence tomography demonstrated decreased retinal thickness in chronic autoimmune uveitis mice, and electroretinography showed significantly reduced amplitudes of dark-adapted a- and b-waves and light-adapted b-waves. Histologic examination revealed prominent choroiditis with extensive retinal damage. Flow cytometry analysis showed substantially increased numbers of CD44hiIL-17+IFN-γ- memory T-helper 17 (Th17) cells in the retina, cervical lymph nodes, inguinal lymph nodes, and spleen. These data establish new modified protocols for inducing chronic uveitis in wild-type mice, and demonstrate a predominant memory Th17 cell response, suggesting an important role for memory Th17 cells in driving chronic inflammation in autoimmune uveitis.


Figures

Figure 1
Figure 1
Fundoscopic evaluation of chronic uveitis disease activity. A: Following immunization in B10.RIII mice, digital fundus images were taken on a weekly basis, and graded on a scale of 0 to 4 by averaging the scores of optic disc, retinal vessel, and retinal tissue changes. Representative digital fundus images at indicated time points are shown. At week 2, EAU reaches disease peak, showing severe optic disc inflammation with some vessels in the optic disc masked (asterisk, scoring of 4/4), severe perivascular cuffing (yellow arrows, scoring of 4/4), and multiple retinal linear lesions (blue arrows, scoring of 4/4), which is finally graded as 4. In contrast, CAU at week 2 only shows slightly blurred optic disc margins (asterisk, scoring of 1/4) without vessel or retinal tissue changes (scoring of 0/4 for each), which is finally graded as 0.3. By week 10, EAU shows almost complete disease resolution with only isolated small retinal lesions identified (blue arrow, scoring of 1/4), which is finally graded as 0.3. However, CAU shows disease progression and reaches disease peak by week 12, exhibiting extensive inflammation in the optic disc and juxtapapillary area with some vessels in the optic disc masked and invisible (asterisk, scoring of 3/4), sclerotic vessels with moderate perivascular cuffing (yellow arrows, scoring of 3/4), and pan-retinal atrophy with many large lesions (blue arrows, scoring of 4/4), which is finally graded as 3.3. B: Following immunization in C57BL/6 (B6) mice, digital fundus images were similarly taken and scored. Representative digital fundus images at indicated time points are shown. At week 3, EAU reaches disease peak, showing swelling of optic disc and blurred optic disc margins (asterisk, scoring of 2/4), extensive perivascular cuffing (yellow arrows, scoring of 3/4), and diffuse and linear whitish lesions (blue arrows, scoring of 4/4), which is finally graded as 3. In contrast, CAU shows slightly blurred optic disc margins (asterisk, scoring of 1/4) with normally appearing retinal vessels and tissues (scoring of 0/4 for each), which is finally graded as 0.3 on average. By week 10, EAU shows complete disease resolution; yet, CAU shows disease progression and reaches disease peak by week 12 with slightly blurred optic disc margins (asterisk, scoring of 1/4), engorged vessels (yellow arrows, scoring of 1/4), and pan-retinal atrophy with numerous small lesions (blue arrows, scoring of 3/4), which is finally graded as 1.7. Data are presented as means ± SEM of a single representative experiment (out of two performed) of 14 eyes from seven mice in CAU group, and 10 eyes from five mice in each of EAU and control (mice receiving CFA and Bordetella pertussis toxin without the peptide) group (A and B). B6, C57BL/6.
Figure 2
Figure 2
Optical coherence tomography (OCT) assessment and histopathology of retina in chronic uveitis. A and B: Retinal anatomy of B10.RIII (A) and C57BL/6 (B6; B) mice was evaluated by OCT in control (mice receiving CFA and Bordetella pertussis toxin without the peptide) and chronic uveitis mice at week 12. Representative images (left panels) and summary bar charts (right panels) are shown. Retinal thickness was measured from the interface of the vitreous (V) and the ganglion cell layer (GCL) to the interface between the retinal pigment epithelium (RPE) and choroid (CH). White bars in the images represent the normal retinal thickness in each mouse strain, which indicates the reduced thickness in mice with chronic uveitis. Asterisks indicate focal areas of thickening in both strains of chronic uveitis. C and D: Representative sections of hematoxylin and eosin–stained eyeballs at week 12 are shown. Characteristic changes in chronic uveitis in B10.RIII (C) and B6 (D) mice include the following: i) degeneration of the retinal pigment epithelium, the photoreceptor layer, and nuclear layers (asterisk); ii) retinal folds (hash mark); and iii) inflammatory infiltrates in the vitreous and choroid (arrows). Data are given as means ± SEM (A and B); n = 5 (A and B). ∗P < 0.05 versus control. Scale bars: 200 μm (C and D, top rows); 50 μm (C and D, bottom rows). INL, inner nuclear layer; ONL, outer nuclear layer; OpN, optic nerve; PRL, photoreceptor layer.
Figure 3
Figure 3
Electroretinography (ERG) evaluation of retinal function in chronic uveitis. ERG responses from dark- and light-adapted eyes were recorded and analyzed at week 12. Representative ERG responses to light stimuli at 24.1 and 25.6 cd s/m2 for scotopic dark- and photopic light-adapted ERG in B10.RIII (A) and C57BL/6 (B6; C) mice are shown, respectively. The a-wave amplitude was measured from the baseline to the trough of the a-wave, and b-wave amplitude was measured from the trough of the a-wave to the peak of the b-wave. Amplitudes are depicted in bar charts for B10.RIII (B) and B6 (D) mice. Data shown are means ± SEM (B and D). n = 5 animals in each group (B and D). ∗P < 0.05 versus control.
Figure 4
Figure 4
Memory T-helper 17 (Th17) response in retinal tissues in B10.RIII mice with chronic autoimmune uveitis (CAU). Retinal tissues were harvested and prepared for flow cytometric assessment at week 12. Frequencies and numbers of total CD4+ T cells in retina were determined after debris and doublet exclusions (A), and are summarized in bar chart (B). Furthermore, frequencies of IL17+IFN-γ-CD4+ (total Th17) and CD44hiIL-17+CD4+ (memory Th17) cells among total CD4+ T cells were examined with representative flow cytometry dot plots (C and E), and bar charts summarizing total and memory Th17 cells (D). CD44hi Th17 cells were further characterized according to the expression of the memory markers IL-7R and IL-15R (F). Results are from a single experiment (with each sample pooled from four eyes) and are representative of two performed. n = 3 per group. ∗P < 0.05 versus control. FSC, forward scatter; IFN-γ, interferon-γ.
Figure 5
Figure 5
Memory T-helper 17 (Th17) response in retinal tissues in C57BL/6 mice with chronic autoimmune uveitis (CAU). Retinal tissues were harvested and prepared for flow cytometric assessment at week 12. Frequencies and numbers of total CD4+ T cells in retina were determined after debris and doublet exclusions (A), and are summarized in bar chart (B). Furthermore, frequencies of IL17+IFN-γ-CD4+ (total Th17) and CD44hiIL-17+CD4+ (memory Th17) cells among total CD4+ T cells were examined with representative flow cytometry dot plots (C and E), and bar charts summarizing total and memory Th17 cells (D). CD44hi Th17 cells were further characterized according to the expression of the memory markers IL-7R and IL-15R (F). Results are from a single experiment (with each sample pooled from four eyes) and are representative of two performed. n = 3 per group. ∗P < 0.05 versus control. FSC, forward scatter; IFN-γ, interferon-γ.
Figure 6
Figure 6
Memory T-helper 17 (Th17) response in lymphoid tissues in B10.RIII mice with chronic autoimmune uveitis. Cervical draining lymph node (CLN), distal inguinal LN (ILN), spleen, bone marrow, and peripheral blood samples were collected and prepared for flow cytometric assessment at week 12. A: Gating strategy and isotype controls for analyzing total and memory Th17 cells. B: Representative flow cytometry histograms show the expression of IL-7R and IL-15R on CD44hi Th17 cells. Results are from a single experiment and are representative of two performed. C: Frequencies of IL17+IFN-γCD4+ (total Th17, white bars) and CD44hiIL-17+CD4+ (memory Th17, gray bars) cells among total CD4+ T cells were examined with representative flow cytometry dot plots shown on the left, and bar charts summarizing total and memory Th17 cells shown on the far right. n = 3 to 4 per group (B). ∗P < 0.05 versus control. FSC, forward scatter; IFN-γ, interferon-γ.
Figure 7
Figure 7
Memory T-helper 17 (Th17) response in lymphoid tissues in C57BL/6 mice with chronic autoimmune uveitis (CAU). Cervical draining lymph node (CLN), distal inguinal LN (ILN), spleen, bone marrow, and peripheral blood samples were collected and prepared for flow cytometric assessment at week 12. A: Gating strategy and isotype controls for analyzing total and memory Th17 cells. B: Representative flow cytometry histograms show the expression of IL-7R and IL-15R on CD44hi Th17 cells. Results are from a single experiment and are representative of two performed. C: Frequencies of IL17+IFN-γCD4+ (total Th17, white bars) and CD44hiIL-17+CD4+ (memory Th17, gray bars) cells among total CD4+ T cells were examined with representative flow cytometry dot plots shown on the left, and bar charts summarizing total and memory Th17 cells shown on the far right. n = 3 to 4 per group (B). ∗P < 0.05 versus control. FSC, forward scatter; IFN-γ, interferon-γ.
Supplemental Figure S1
T-helper 17 Th17)/T-helper 1 (Th1) and Th1 cell response in B10.RIII and C57BL/6 (B6) mice with chronic autoimmune uveitis. Frequencies of the IL17+IFN-γ+ Th17/Th1 and IL17IFN-γ+ Th1 subsets were evaluated in the retina, cervical lymph node (LN), distal inguinal LN, spleen, bone marrow, and peripheral blood of mice with chronic autoimmune uveitis at week 12. Summary bar graphs in B10.RIII (A) and B6 (B) chronic autoimmune uveitis mice are shown (with each sample pooled from four eyes). Results are from a single experiment and are representative of two performed. n = 3 for retina (A and B); n = 3 to 4 for other tissues (A and B).

References

    1. Sheu S.J., Chen S.C. Recent advances in managing and understanding uveitis. F1000Res. 2017;6:280. - PMC - PubMed
    1. Nussenblatt R.B. The natural history of uveitis. Int Ophthalmol. 1990;14:303–308. - PubMed
    1. Acharya N.R., Tham V.M., Esterberg E., Borkar D.S., Parker J.V., Vinoya A.C., Uchida A. Incidence and prevalence of uveitis: results from the Pacific Ocular Inflammation Study. JAMA Ophthalmol. 2013;131:1405–1412. - PubMed
    1. Goldstein H. The reported demography and causes of blindness throughout the world. Adv Ophthalmol. 1980;40:1–99. - PubMed
    1. Darrell R.W., Wagener H.P., Kurland L.T. Epidemiology of uveitis: incidence and prevalence in a small urban community. Arch Ophthalmol. 1962;68:502–514. - PubMed

Publication types