

Classifications of Neurodegenerative Disorders Using a Multiplex Blood Biomarkers-Based Machine Learning Model
- PMID: 32967146
- PMCID: PMC7555120
- DOI: 10.3390/ijms21186914
Classifications of Neurodegenerative Disorders Using a Multiplex Blood Biomarkers-Based Machine Learning Model
Abstract
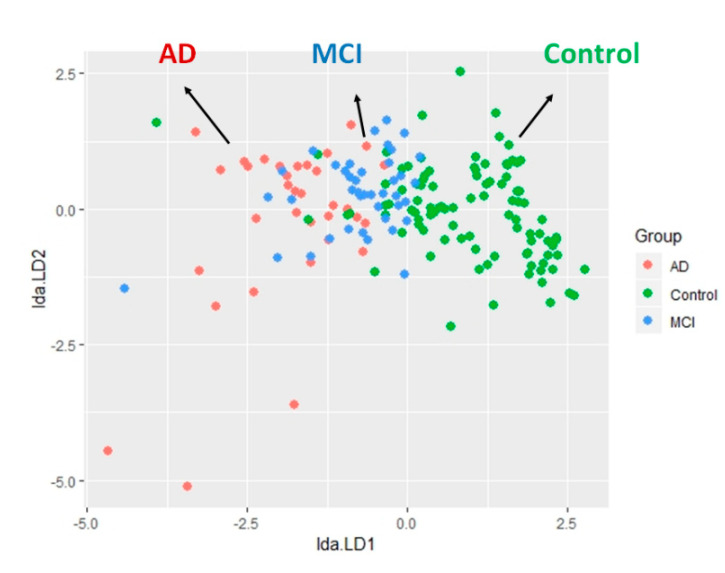
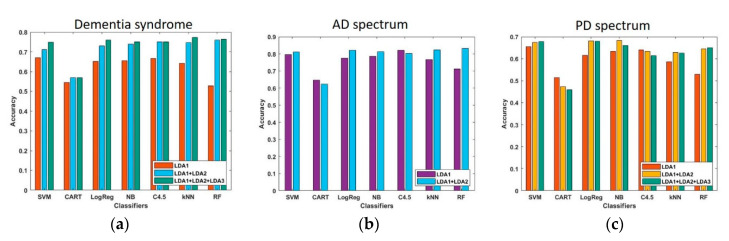
Easily accessible biomarkers for Alzheimer's disease (AD), Parkinson's disease (PD), frontotemporal dementia (FTD), and related neurodegenerative disorders are urgently needed in an aging society to assist early-stage diagnoses. In this study, we aimed to develop machine learning algorithms using the multiplex blood-based biomarkers to identify patients with different neurodegenerative diseases. Plasma samples (n = 377) were obtained from healthy controls, patients with AD spectrum (including mild cognitive impairment (MCI)), PD spectrum with variable cognitive severity (including PD with dementia (PDD)), and FTD. We measured plasma levels of amyloid-beta 42 (Aβ42), Aβ40, total Tau, p-Tau181, and α-synuclein using an immunomagnetic reduction-based immunoassay. We observed increased levels of all biomarkers except Aβ40 in the AD group when compared to the MCI and controls. The plasma α-synuclein levels increased in PDD when compared to PD with normal cognition. We applied machine learning-based frameworks, including a linear discriminant analysis (LDA), for feature extraction and several classifiers, using features from these blood-based biomarkers to classify these neurodegenerative disorders. We found that the random forest (RF) was the best classifier to separate different dementia syndromes. Using RF, the established LDA model had an average accuracy of 76% when classifying AD, PD spectrum, and FTD. Moreover, we found 83% and 63% accuracies when differentiating the individual disease severity of subgroups in the AD and PD spectrum, respectively. The developed LDA model with the RF classifier can assist clinicians in distinguishing variable neurodegenerative disorders.
Keywords: Alzheimer’s disease; Parkinson’s disease; biomarkers; classification; deep learning model; frontotemporal dementia; linear discriminant analysis; multivariate imputation by chained equations; neurodegenerative disorders.
Conflict of interest statement
The authors declare no conflict of interest.
Figures


Similar articles
-
Cerebrospinal Fluid and Plasma Biomarkers in Neurodegenerative Diseases.J Alzheimers Dis. 2019;68(1):395-404. doi: 10.3233/JAD-181152. J Alzheimers Dis. 2019. PMID: 30814356
-
High discriminatory ability of peripheral and CFSF biomarkers in Lewy body diseases.J Neural Transm (Vienna). 2020 Mar;127(3):311-322. doi: 10.1007/s00702-019-02137-2. Epub 2020 Jan 7. J Neural Transm (Vienna). 2020. PMID: 31912280
-
Plasma extracellular vesicles tau and β-amyloid as biomarkers of cognitive dysfunction of Parkinson's disease.FASEB J. 2021 Oct;35(10):e21895. doi: 10.1096/fj.202100787R. FASEB J. 2021. PMID: 34478572 Clinical Trial.
-
How many biomarkers to discriminate neurodegenerative dementia?Crit Rev Clin Lab Sci. 2015;52(6):314-26. doi: 10.3109/10408363.2015.1051658. Epub 2015 Aug 17. Crit Rev Clin Lab Sci. 2015. PMID: 26292074 Review.
-
Amyloid beta protein and tau in cerebrospinal fluid and plasma as biomarkers for dementia: a review of recent literature.Curr Clin Pharmacol. 2008 May;3(2):123-31. doi: 10.2174/157488408784293723. Curr Clin Pharmacol. 2008. PMID: 18700307 Review.
Cited by
-
Alpha-Synuclein in Peripheral Tissues as a Possible Marker for Neurological Diseases and Other Medical Conditions.Biomolecules. 2023 Aug 18;13(8):1263. doi: 10.3390/biom13081263. Biomolecules. 2023. PMID: 37627328 Free PMC article. Review.
-
Ultrasensitive Assays Detect Different Conformations of Plasma β Amyloids.ACS Omega. 2025 Feb 11;10(7):7256-7263. doi: 10.1021/acsomega.4c10879. eCollection 2025 Feb 25. ACS Omega. 2025. PMID: 40028141 Free PMC article.
-
Compared with the monocyte to high-density lipoprotein ratio (MHR) and the neutrophil to lymphocyte ratio (NLR), the neutrophil to high-density lipoprotein ratio (NHR) is more valuable for assessing the inflammatory process in Parkinson's disease.Lipids Health Dis. 2021 Apr 19;20(1):35. doi: 10.1186/s12944-021-01462-4. Lipids Health Dis. 2021. PMID: 33874966 Free PMC article.
-
The identification of cognitive impairment in Parkinson's disease using biofluids, neuroimaging, and artificial intelligence.Front Neurosci. 2024 Sep 26;18:1446878. doi: 10.3389/fnins.2024.1446878. eCollection 2024. Front Neurosci. 2024. PMID: 39403068 Free PMC article.
-
Systematic Review: Genetic, Neuroimaging, and Fluids Biomarkers for Frontotemporal Dementia Across Latin America Countries.Front Neurol. 2021 Jun 24;12:663407. doi: 10.3389/fneur.2021.663407. eCollection 2021. Front Neurol. 2021. PMID: 34248820 Free PMC article.
References
-
- McKhann G., Drachman D., Folstein M., Katzman R., Price D., Stadlan E.M. Clinical diagnosis of Alzheimer’s disease: Report of the NINCDS-ADRDA Work Group under the auspices of Department of Health and Human Services Task Force on Alzheimer’s Disease. Neurology. 1984;34:939–944. doi: 10.1212/WNL.34.7.939. - DOI - PubMed
Publication types
MeSH terms
Substances
Grants and funding
LinkOut - more resources
Full Text Sources
Medical
Miscellaneous
