. 2020 Sep 21;10(9):1349.
doi: 10.3390/biom10091349.

G-Quadruplexes in the Archaea Domain

Affiliations

G-Quadruplexes in the Archaea Domain

Václav Brázda et al. Biomolecules. .

Abstract

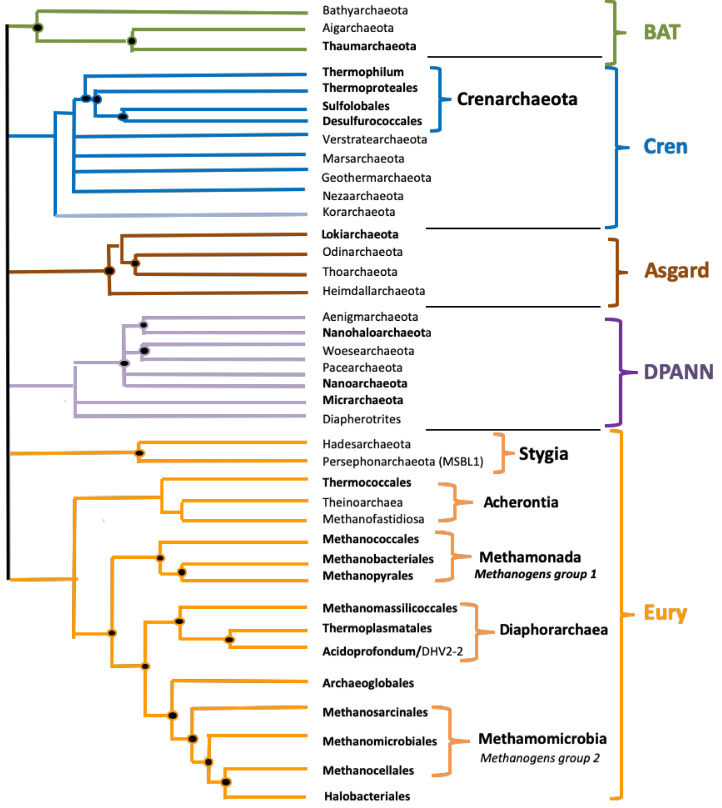
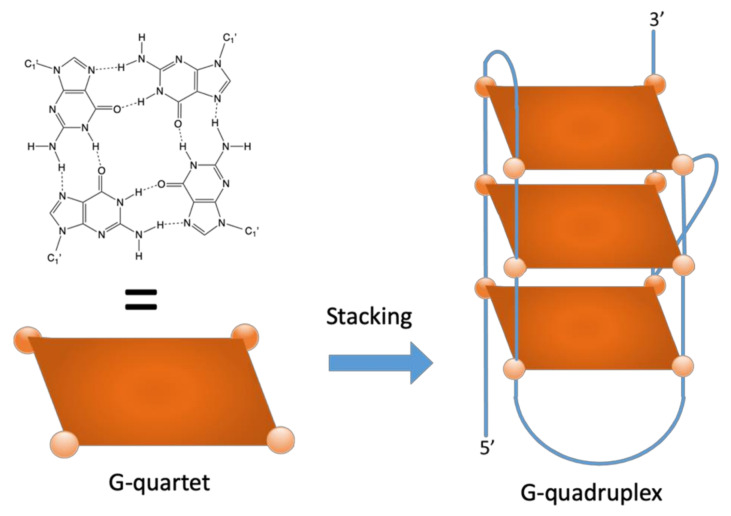
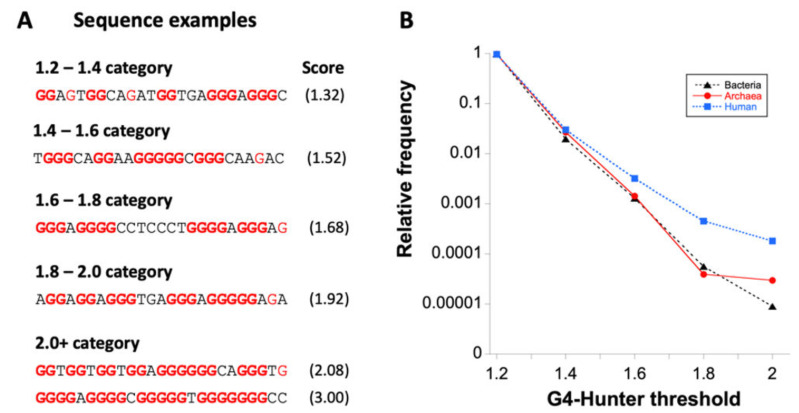
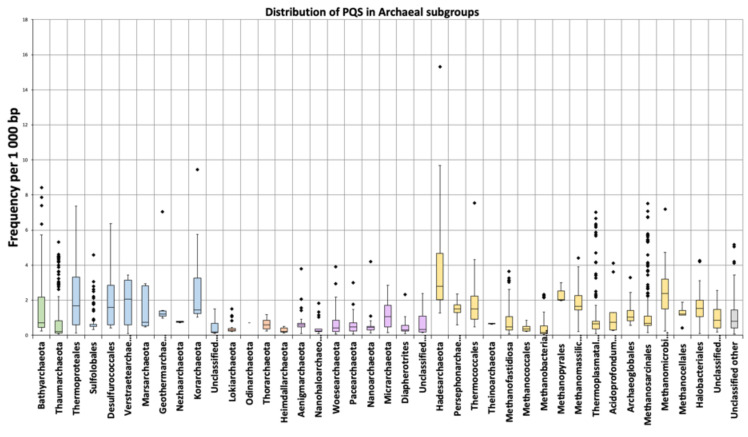
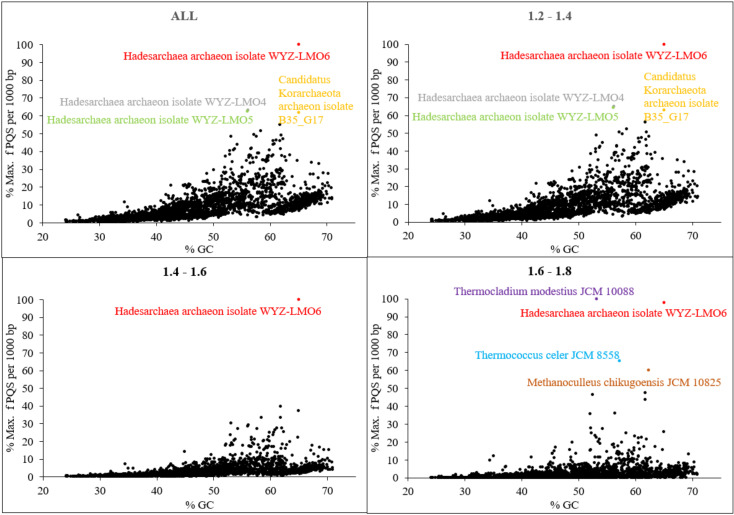
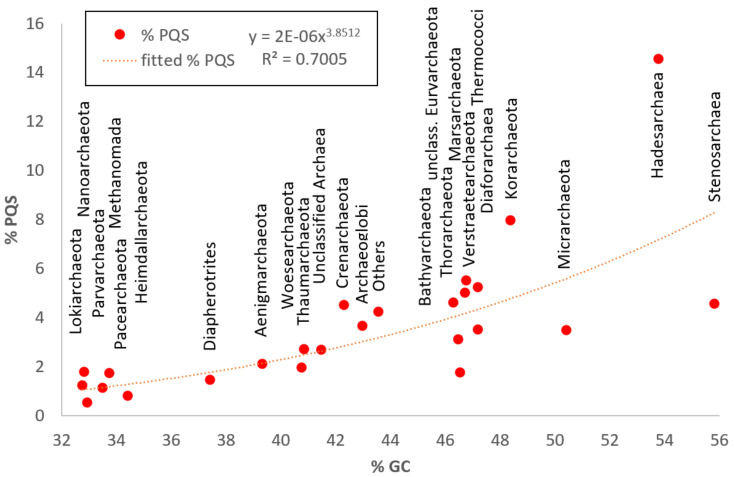
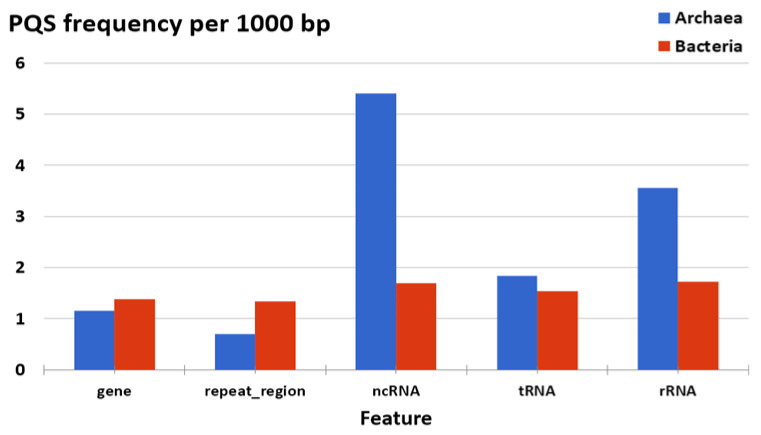
The importance of unusual DNA structures in the regulation of basic cellular processes is an emerging field of research. Amongst local non-B DNA structures, G-quadruplexes (G4s) have gained in popularity during the last decade, and their presence and functional relevance at the DNA and RNA level has been demonstrated in a number of viral, bacterial, and eukaryotic genomes, including humans. Here, we performed the first systematic search of G4-forming sequences in all archaeal genomes available in the NCBI database. In this article, we investigate the presence and locations of G-quadruplex forming sequences using the G4Hunter algorithm. G-quadruplex-prone sequences were identified in all archaeal species, with highly significant differences in frequency, from 0.037 to 15.31 potential quadruplex sequences per kb. While G4 forming sequences were extremely abundant in Hadesarchaea archeon (strikingly, more than 50% of the Hadesarchaea archaeon isolate WYZ-LMO6 genome is a potential part of a G4-motif), they were very rare in the Parvarchaeota phylum. The presence of G-quadruplex forming sequences does not follow a random distribution with an over-representation in non-coding RNA, suggesting possible roles for ncRNA regulation. These data illustrate the unique and non-random localization of G-quadruplexes in Archaea.

Keywords: Archaea; G4-forming motif; genome analysis; sequence prediction; unusual nucleic acid structures.


Conflict of interest statement

The authors declare no conflict of interest. The funders had no role in the design of the study; in the collection, analyses, or interpretation of data; in the writing of the manuscript, or in the decision to publish the results.

Figures

Figure 1
Figure 1
A schematic phylogenic tree for Archaea. This unrooted evolutionary tree of Archaea is based on the schematic tree of Forterre (2015) [17] updated according to recent phylogenetic analyses [9,18]. BAT stands for Bathyarchaeota, Aigarchaeota, and Thaumarchaeota. DPANN is an acronym based on the first five groups discovered: Diapherotrites, Parvarchaeota, Aenigmarchaeota, Nanoarchaeota, and Nanohaloarchaeota. The term BAT superphylum has been proposed by Gaia et al. in 2018 [19], and the terms Eury and Cren superphyla are suggested here. The terms Cren superphylum is suggested here because the phyla Crenarchaeota, Verstratearchaeota Marsarchaeota, Nezaarchaeota, and Geothermarchaeota form a consensus monophyletic clade in all archaeal phylogeny. We included Korarchaeota in this superphylum because they often branch as sister groups of the above phyla in archaeal phylogenies, although the fast evolutionary rate made their positioning sometimes difficult. We suggested in parallel the term Eury superphylum because Euryarchaeota includes very diverse groups of cultivated and uncultivated Archaea which are difficult to the group in a single phylum, especially considering that phyla, such as Verstratearchaeota Marsarchaeota, or Nezaarchaeota only contain few uncultivated species only defined by a few metagenome associated genomes (MAGs). Names in bold letters correspond to subgroups that include cultivated species; names in thin letters correspond to subgroups that include only MAGs.
Figure 2
Figure 2
A G-quartet involves four coplanar guanines establishing a cyclic array of H-bonds (left). Stacking of two or more (three in this example) quartets leads to the formation of a G-quadruplex structure (right), stabilized by cations, such as potassium (not shown).
Figure 3
Figure 3
Examples of sequences with different G-quadruplexes (G4) Hunter scores (G4HS) and distribution of PQS according to threshold category. (A) Examples of archaea 25-nt long sequences (corresponding to the window size chosen for the analysis) for which G4Hunter scores are provided within parentheses. Isolated guanines are shown in red, all other guanines in bold red characters. Longer archaea motifs with high G4H scores are provided in Table 3. (B) Distribution of G4-prone motifs according to the G4Hunter score. 1.2 means any sequence with a score between 1.2 and 1.399; 1.4 between 1.4 and 1.599, etc. These numbers are normalized by the total number of PQS found in bacteria, archaea, and compared with Homo sapiens. The first category represents 97.9% and 97.2% of all PQS sequences in bacteria and archaea, respectively. Note the log scale on the Y-axis.
Figure 4
Figure 4
Frequencies of PQS in subgroups of analyzed archaeal genomes. Data within boxes span the interquartile range, and whiskers show the lowest and highest values within 1.5 interquartile range. Black points denote outliers. Horizontal black lines inside boxplots are median values.
Figure 5
Figure 5
Cluster dendrogram of PQS characteristics of archaeal subgroups. Cluster dendrogram of PQS characteristics (Supplementary Table S4) was made in R v. 3.6.3 (code provided in Supplementary Table S4) using pvclust package with these parameters: Cluster method ‘ward.D2′, distance ‘euclidean’, number of bootstrap resamplings was 10,000. AU values are in blue and indicate the statistical significance of particular branching (values above 95 are equivalent to p-values lesser than 0.05). Statistically significant clusters are highlighted by red dashed rectangles.
Figure 6
Figure 6
Relationship between the observed frequency of PQS per 1000 bp and GC content. Different G4Hunter score intervals are considered. In each G4Hunter score interval miniplot, frequencies were normalized according to the highest observed frequency of PQS. Organisms with max. frequency per 1000 bp greater than 50% are described and highlighted in color.
Figure 7
Figure 7
Relationship between GC percentage and % of PQS in genomes of particular archaeal subgroups. The Fitted equation with the R2 coefficient is depicted on the top side of the plot.
Figure 8
Figure 8
Differences in PQS frequency by DNA locus. The chart shows PQS frequencies normalized per 1000 bp annotated locations from the NCBI database and shows a comparison between Archaea and Bacteria. Archaea G4-prone motifs are strongly over-represented in ncRNA and rRNA compared to the average G4 density in Archaea (mean f = 1.207), but also compared to bacteria. PQS count is provided in Supplementary Table S3 Excel file.
Figure 9
Figure 9
Experimental evidence for quadruplex formation with archaea sequences. Isothermal differential absorbance (IDS; panel A) and circular dichroism (CD; panels B and C) spectra of Hadesarchaea archeon DNA sequences were recorded at 20 °C (panels A and B) or at a high temperature (80 °C) for CD (panel C).

References

    1. Woese C.R., Fox G.E. Phylogenetic structure of the prokaryotic domain: The primary kingdoms. Proc. Natl. Sci. Acad. USA. 1977;74:5088–5090. doi: 10.1073/pnas.74.11.5088. - DOI - PMC - PubMed
    1. Olsen G.J., Woese C.R. Archaeal genomics: An overview. Cell. 1997;89:991–994. doi: 10.1016/S0092-8674(00)80284-6. - DOI - PubMed
    1. Forterre P. Archaea: What can we learn from their sequences? Curr. Opin. Genet. Dev. 1997;7:764–770. doi: 10.1016/S0959-437X(97)80038-X. - DOI - PubMed
    1. Grüber G., Manimekalai M.S.S., Mayer F., Müller V. ATP synthases from archaea: The beauty of a molecular motor. Biochim. Biophys. Acta. 2014;1837:940–952. doi: 10.1016/j.bbabio.2014.03.004. - DOI - PubMed
    1. Bolhuis A. The archaeal Sec-dependent protein translocation pathway. Philos. Trans. R. Soc. Lond. B Biol. Sci. 2004;359:919–927. doi: 10.1098/rstb.2003.1461. - DOI - PMC - PubMed

Publication types

MeSH terms

LinkOut - more resources