. 2020 Sep 23;319(6):G669-G684.
doi: 10.1152/ajpgi.00175.2020. Online ahead of print.

Assessment of the role of FGF15 in mediating the metabolic outcomes of murine Vertical Sleeve Gastrectomy (VSG)

Affiliations

Assessment of the role of FGF15 in mediating the metabolic outcomes of murine Vertical Sleeve Gastrectomy (VSG)

Andriy Myronovych et al. Am J Physiol Gastrointest Liver Physiol. .

Abstract

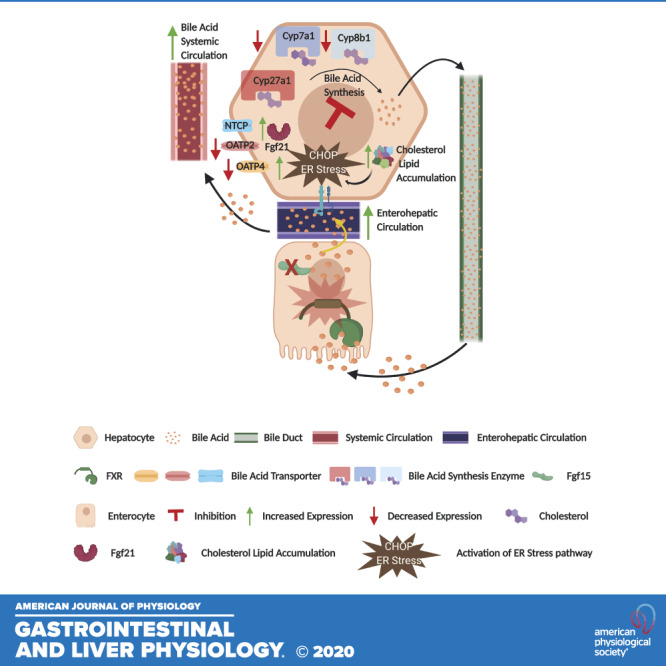
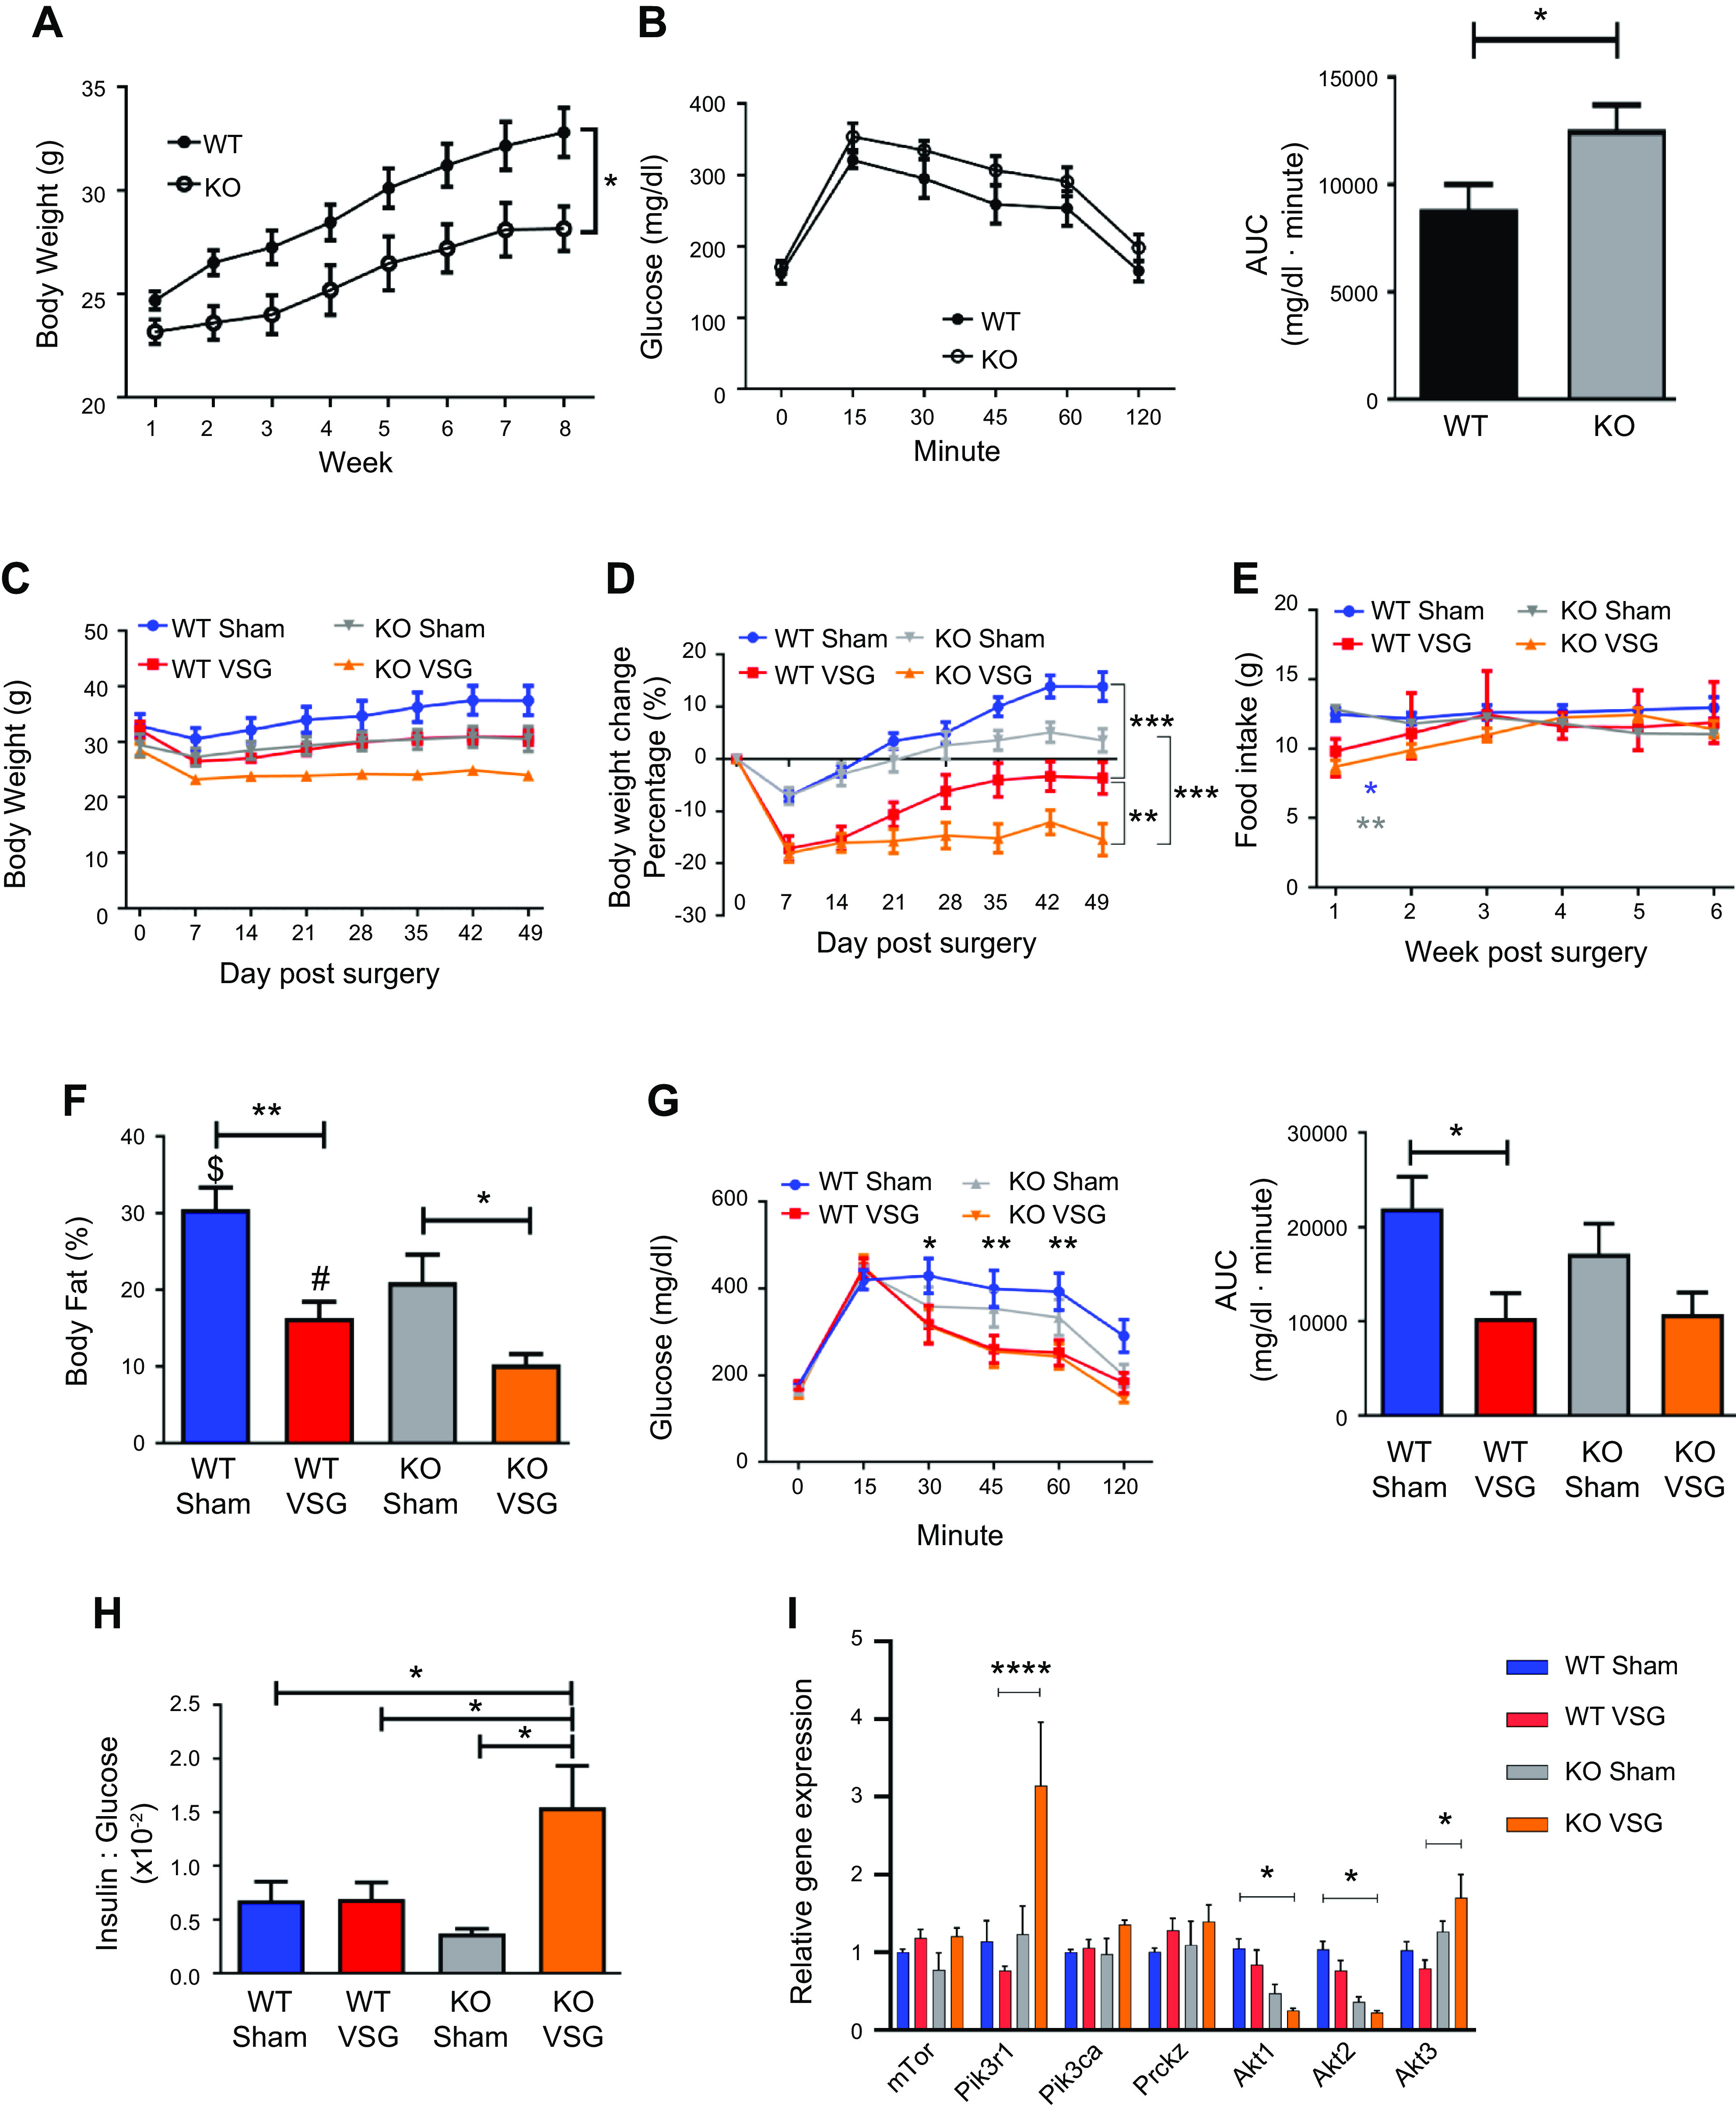
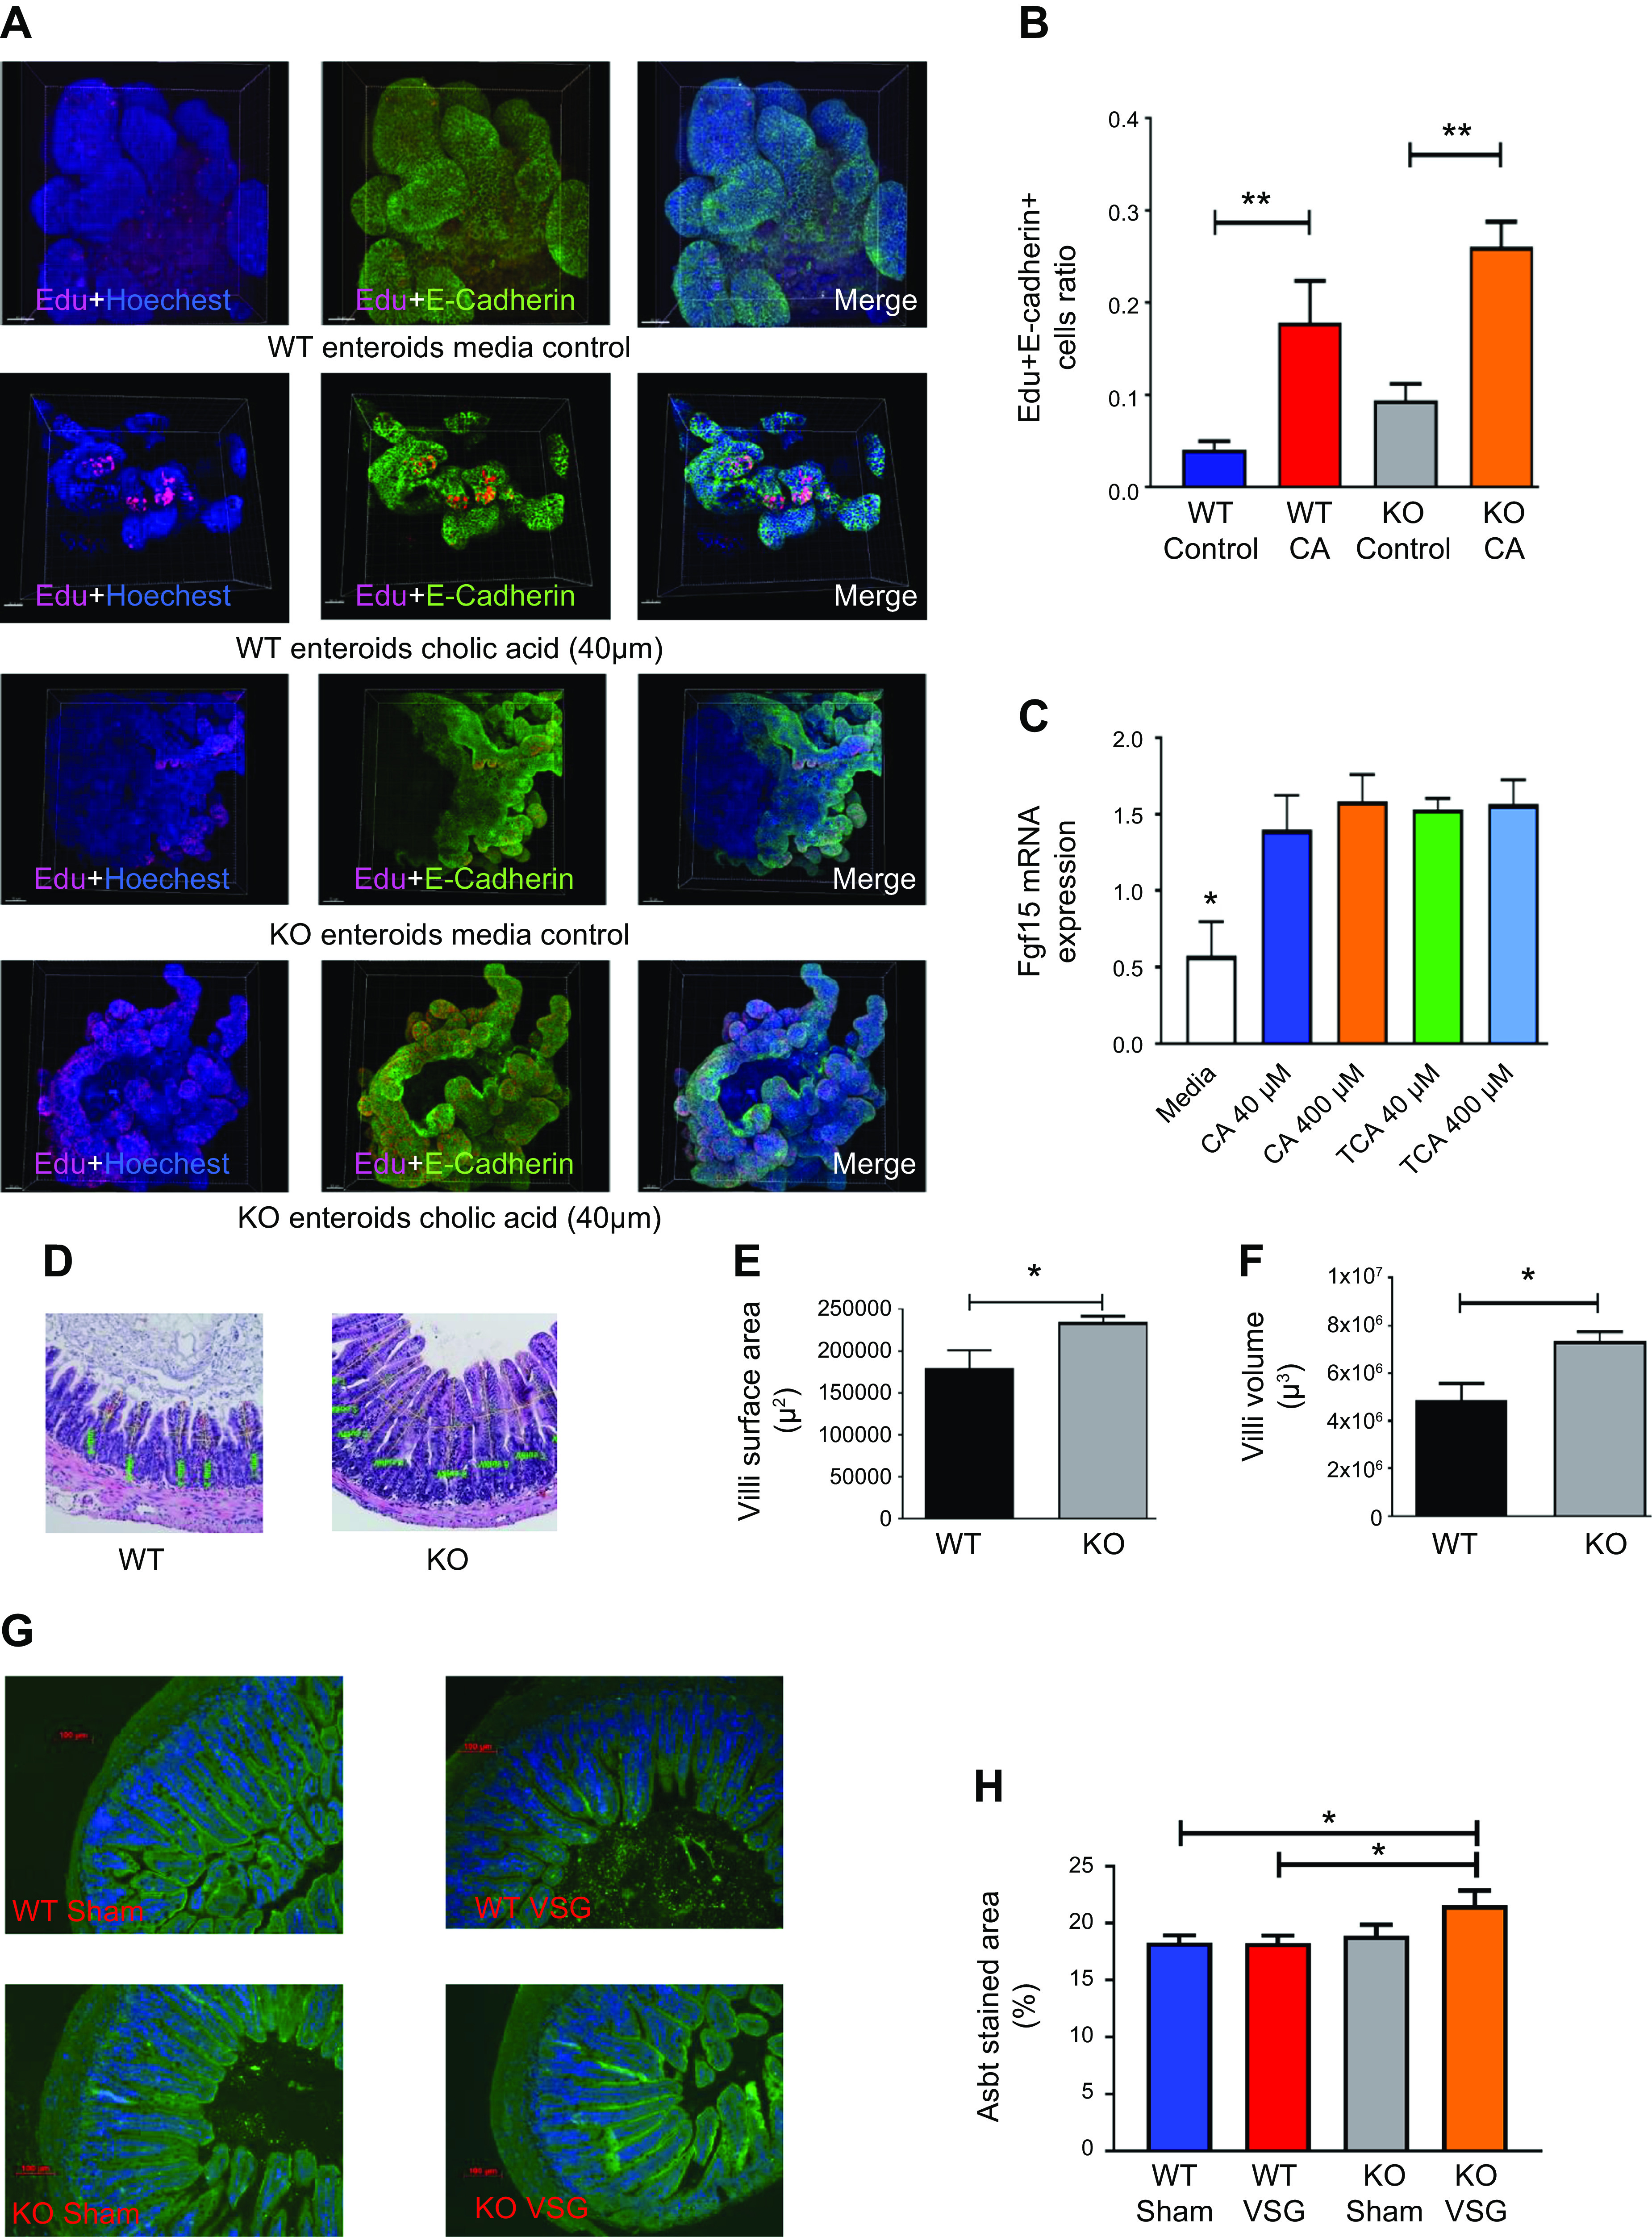
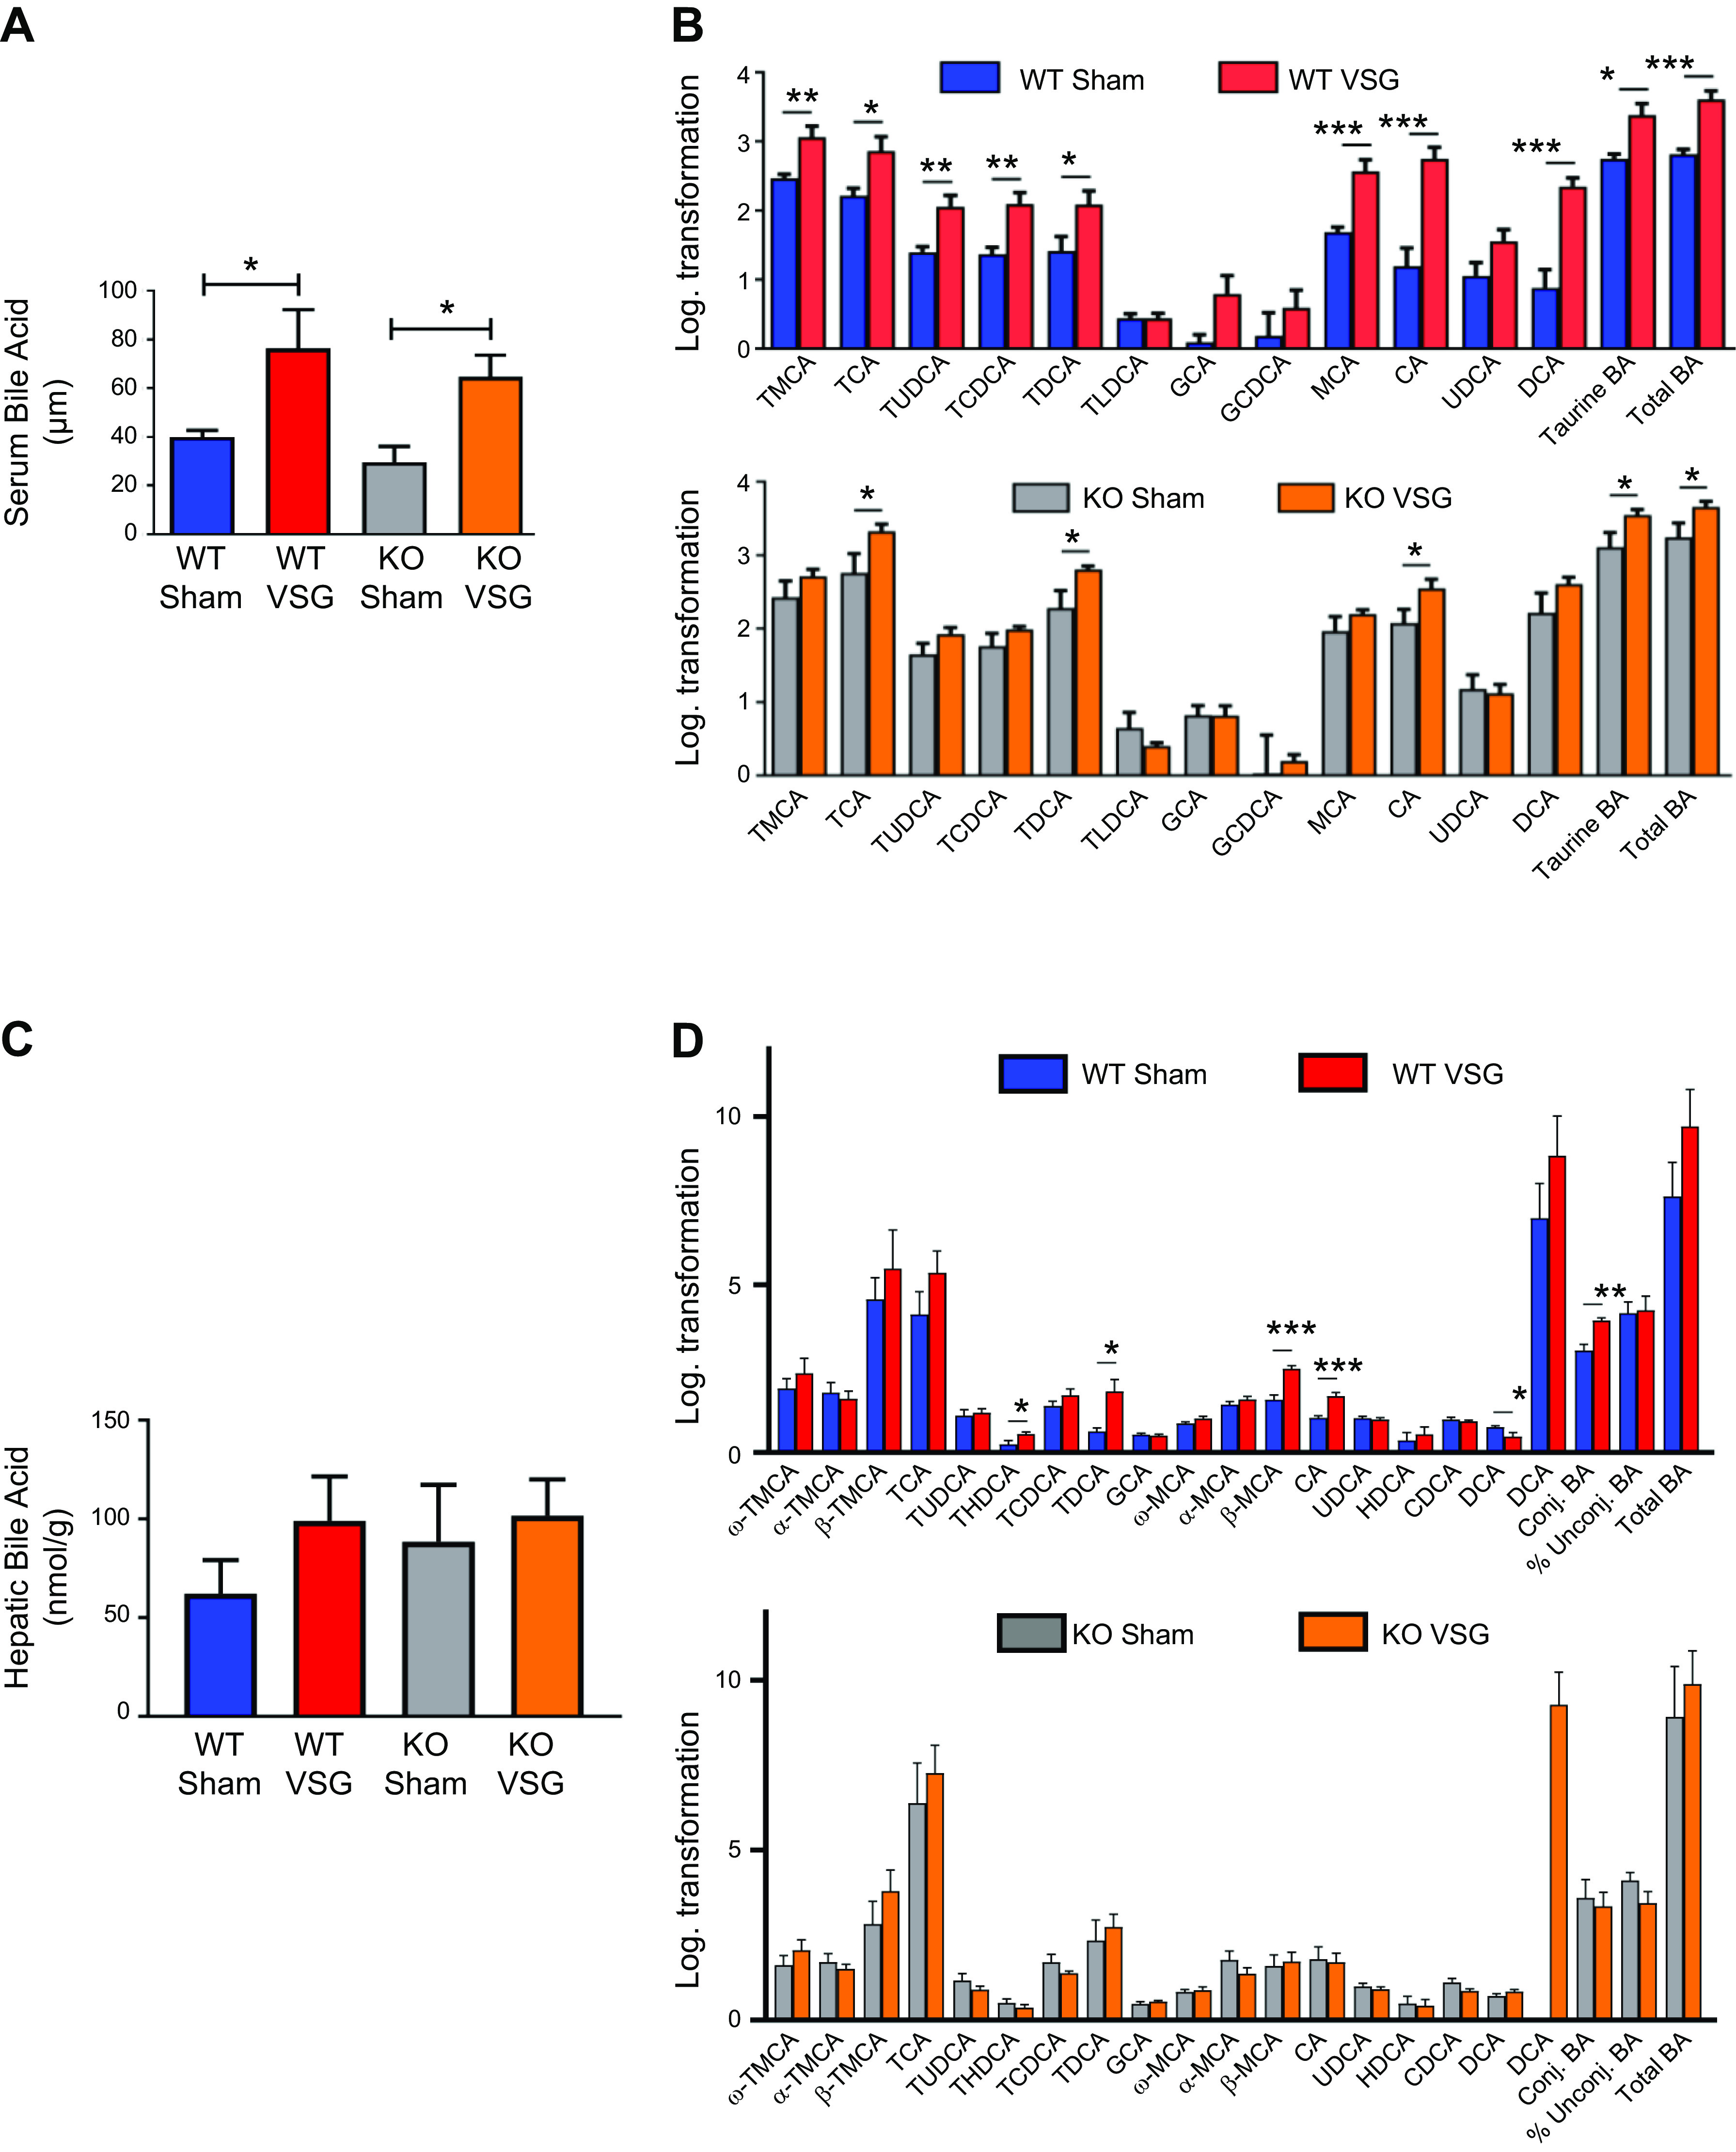
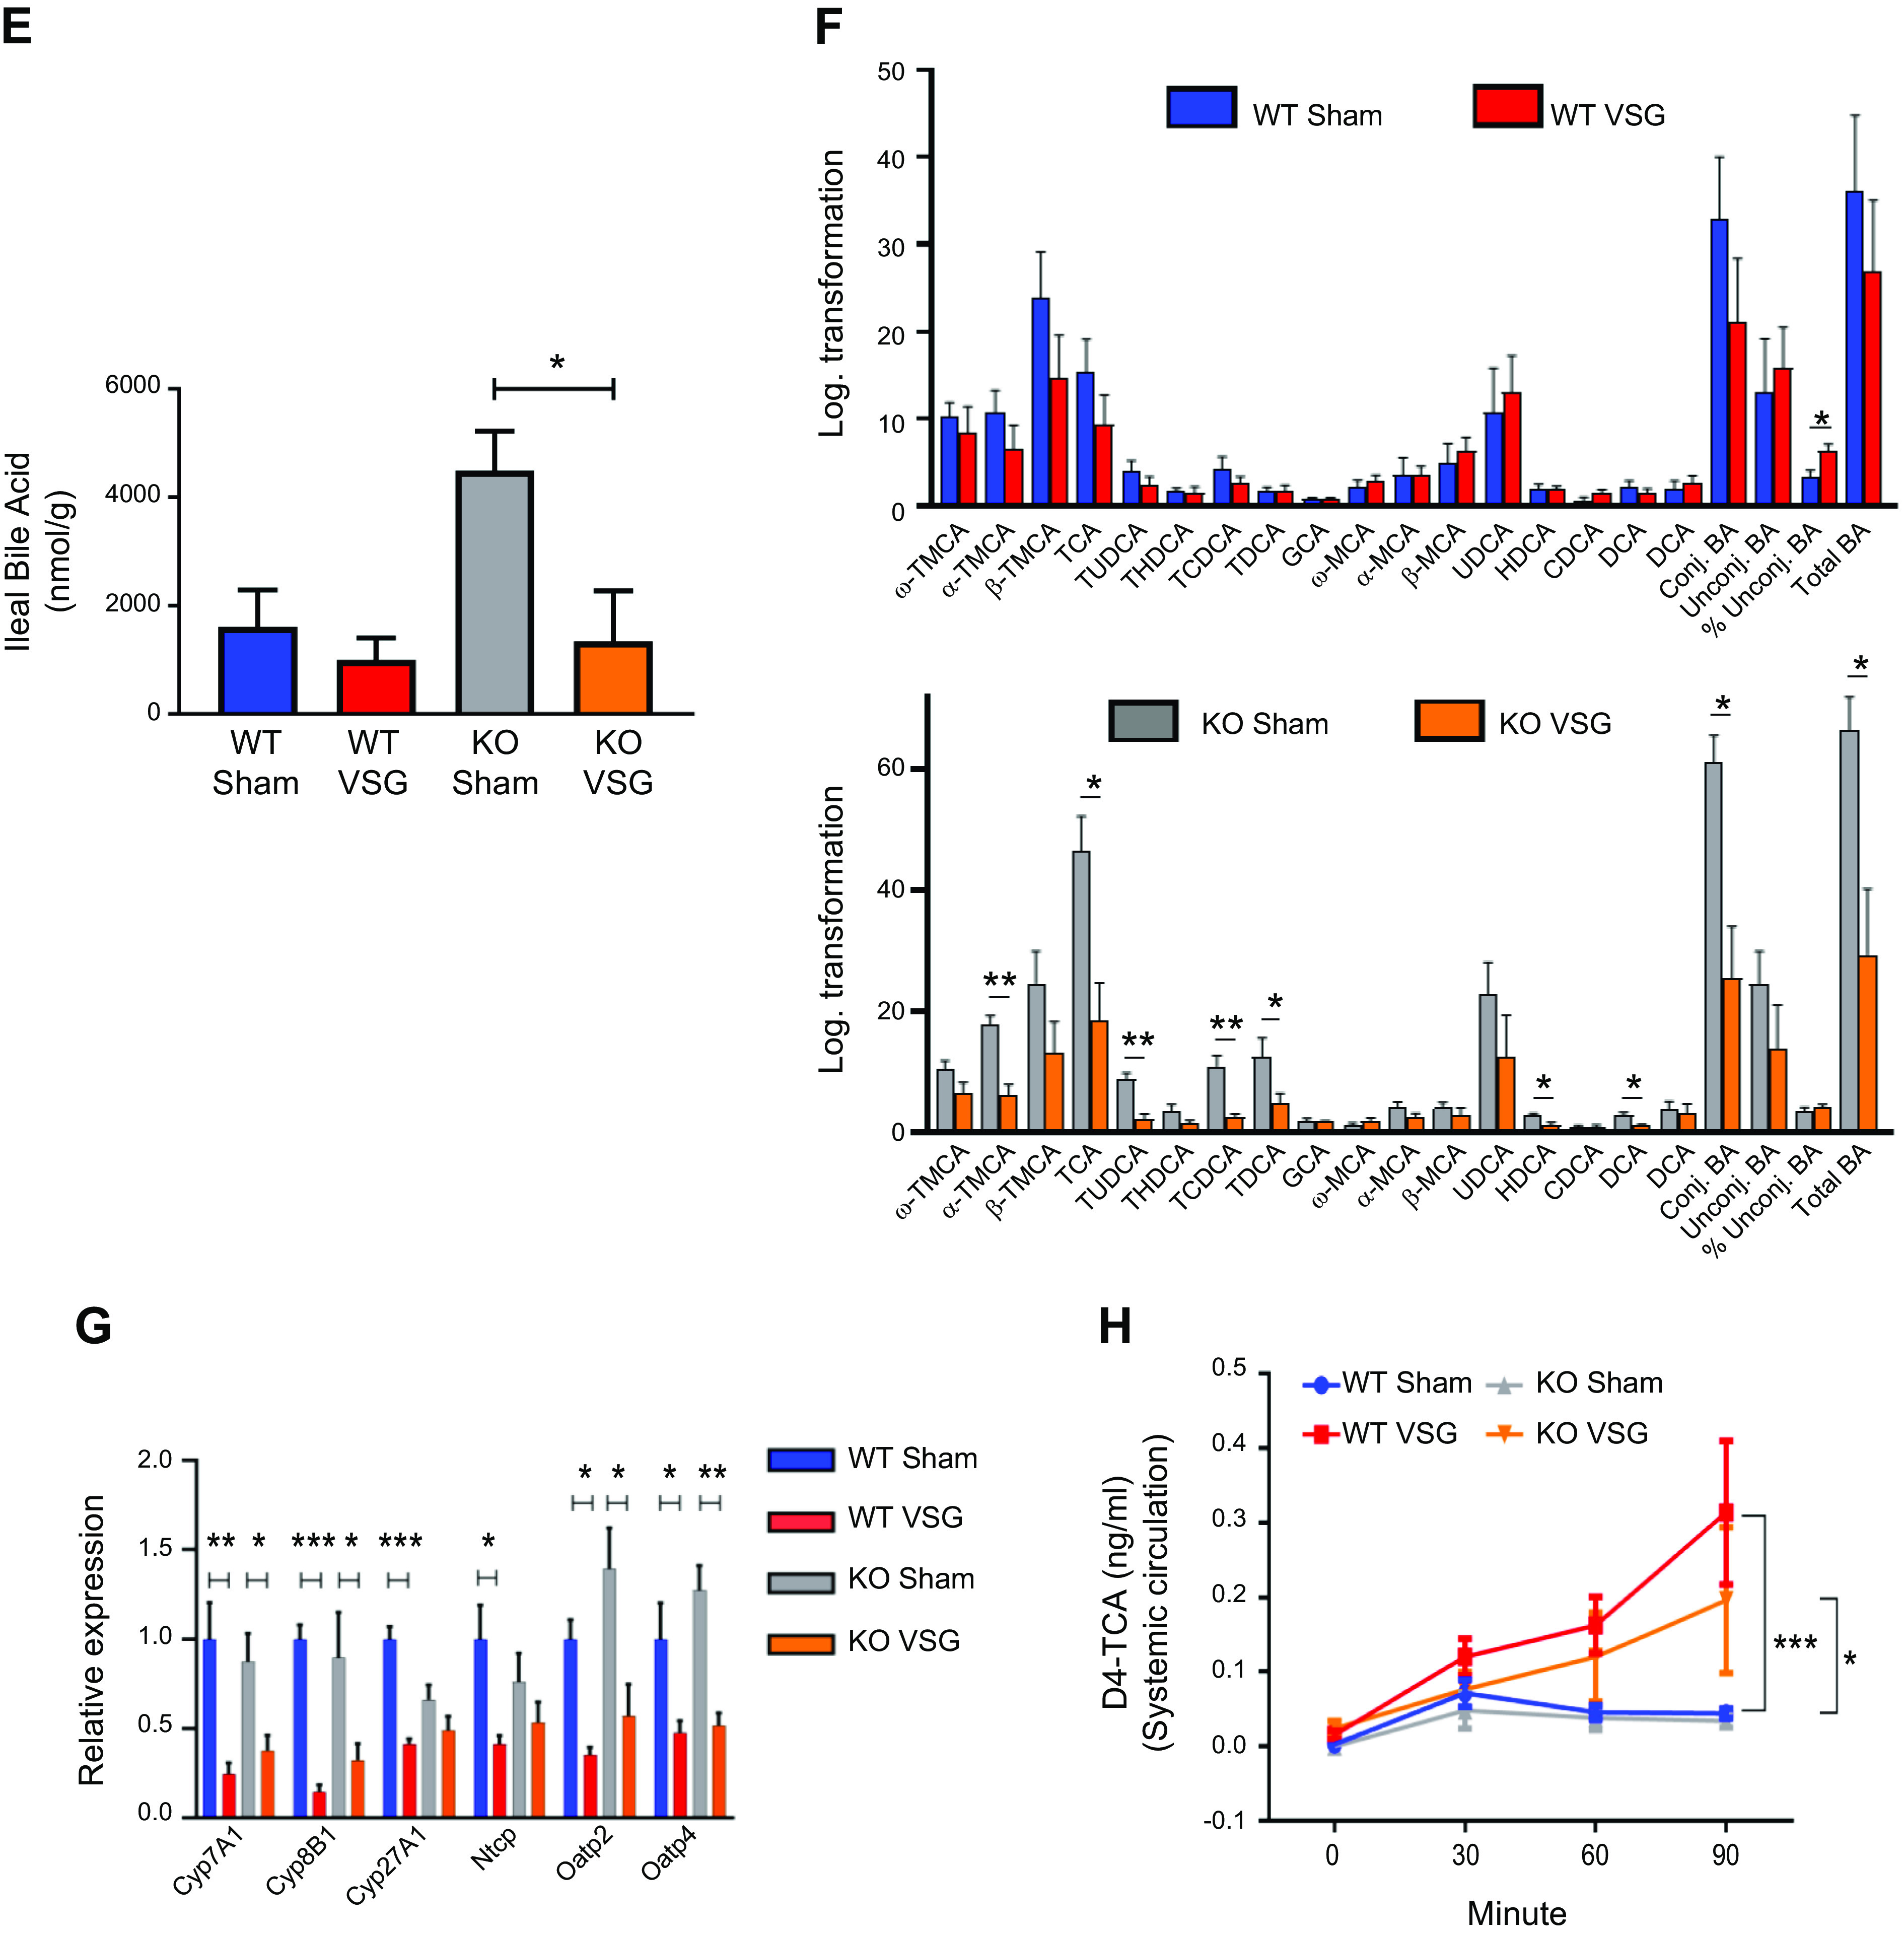
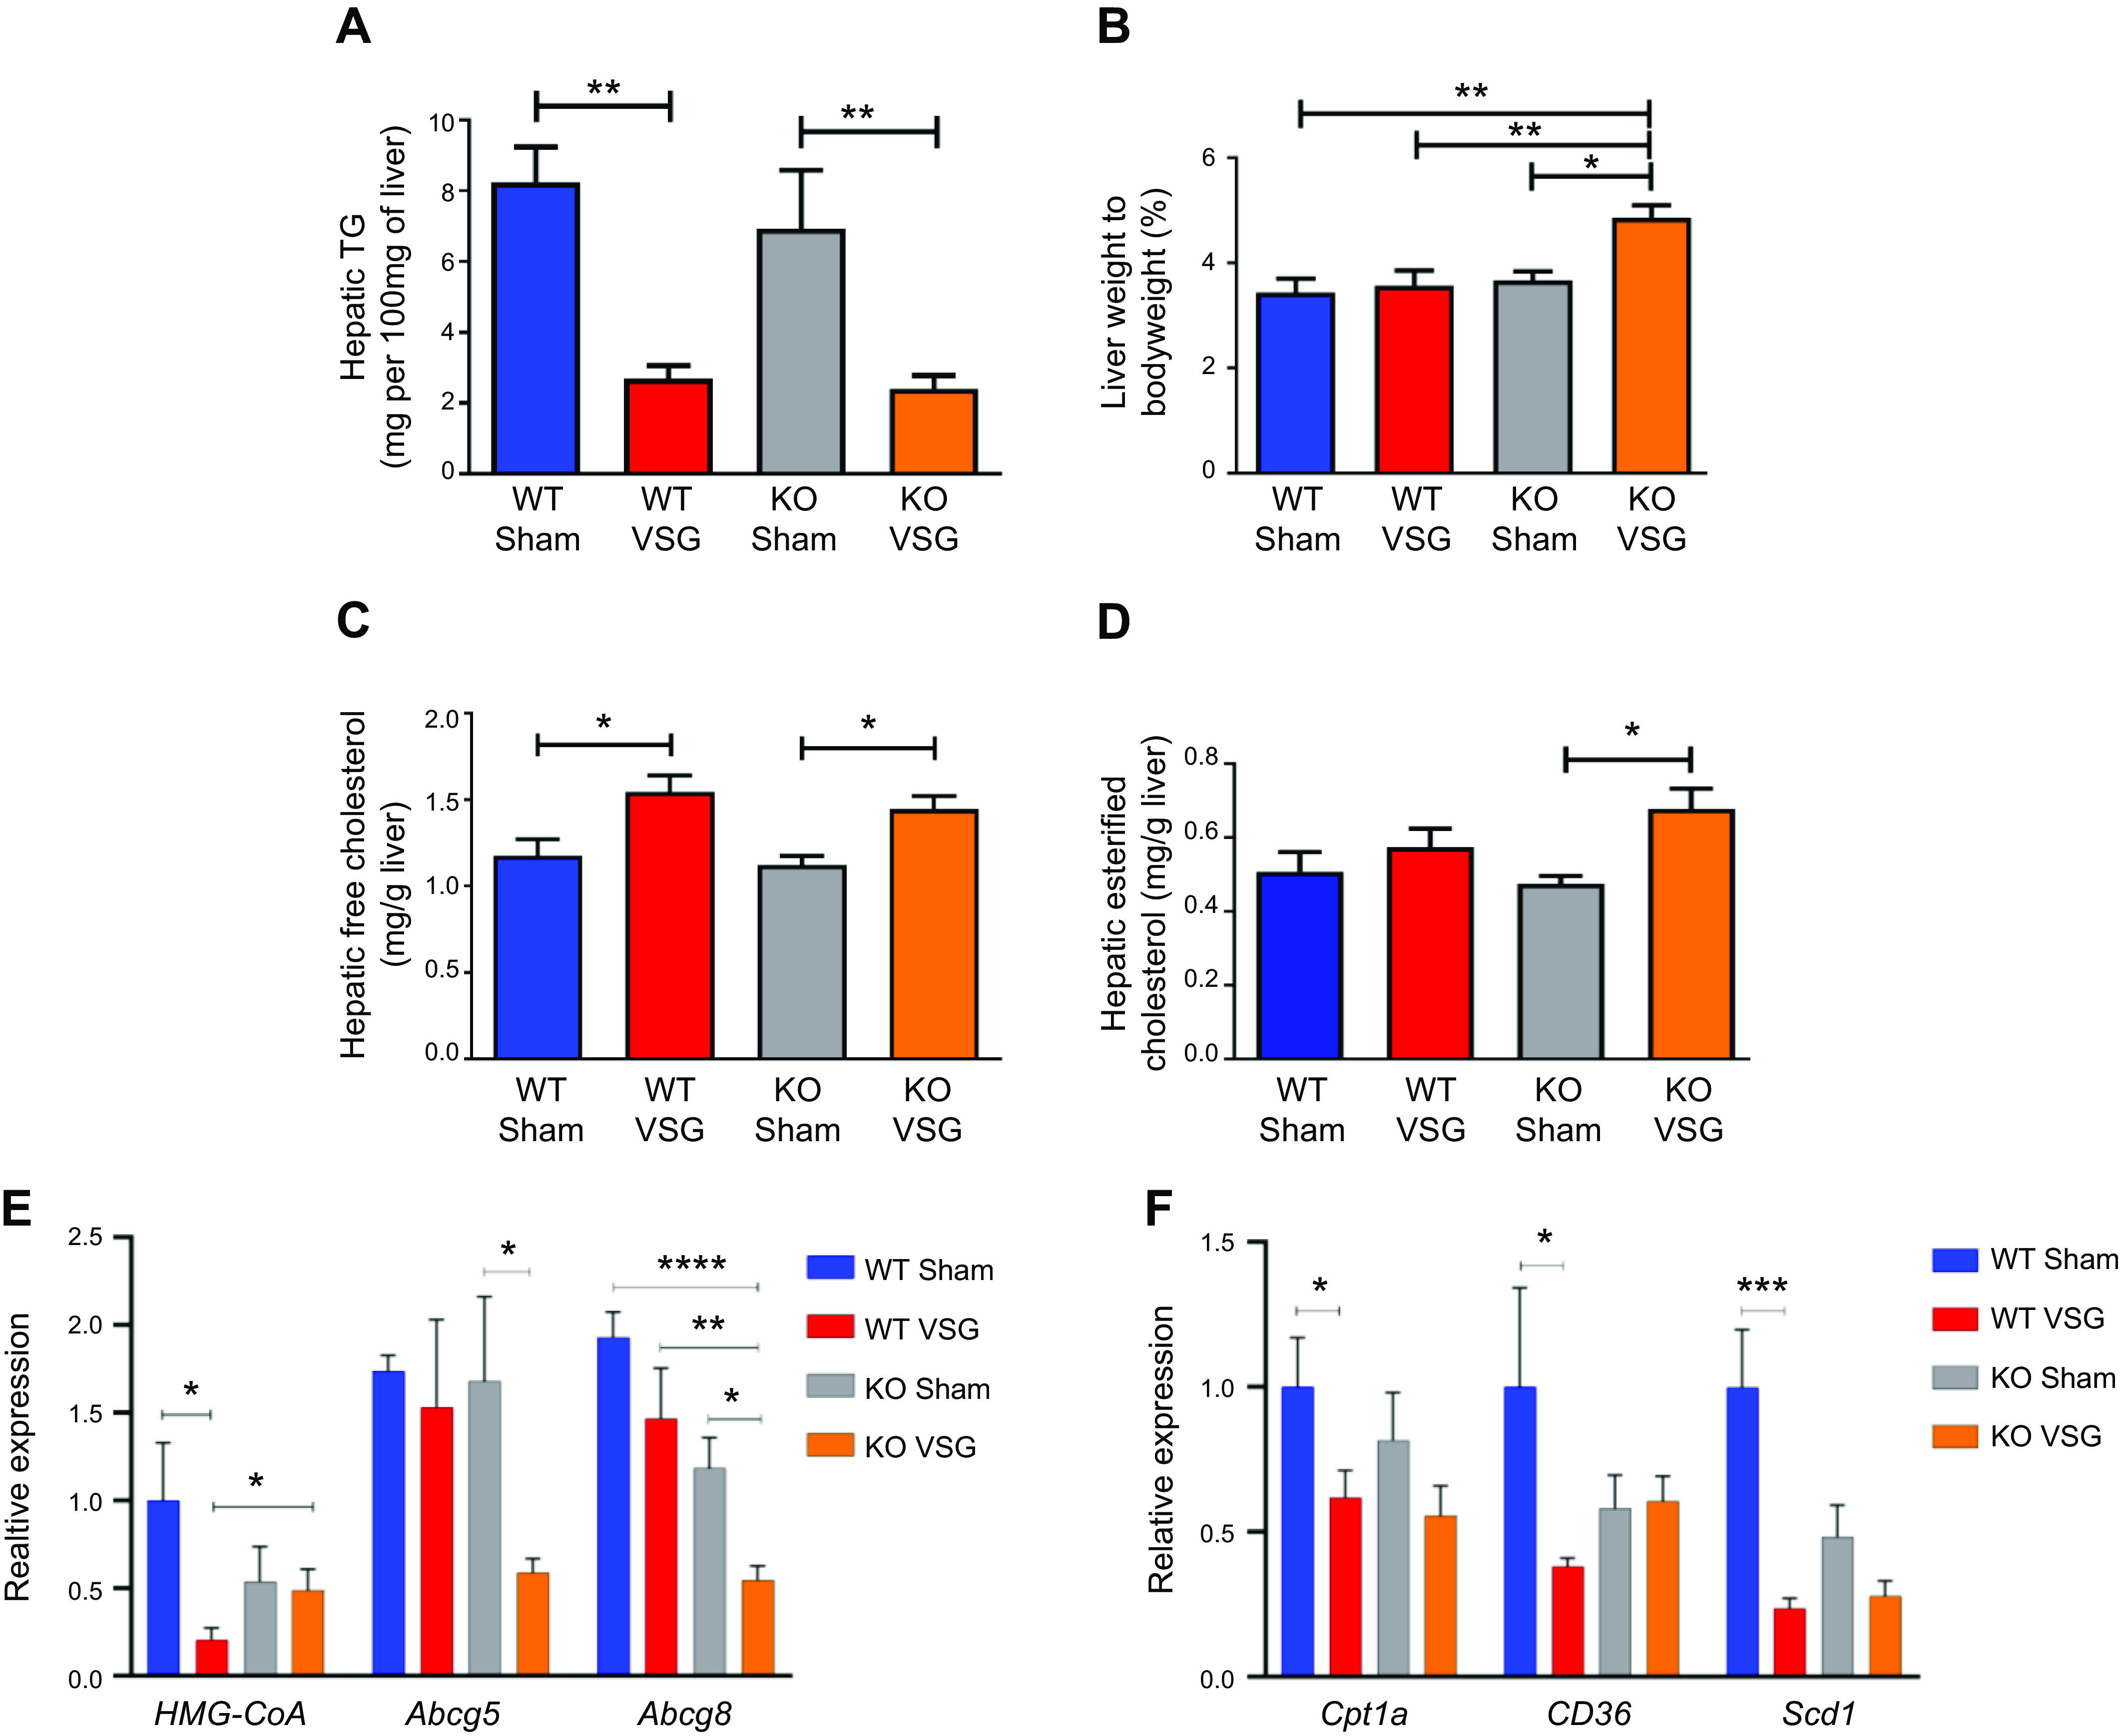
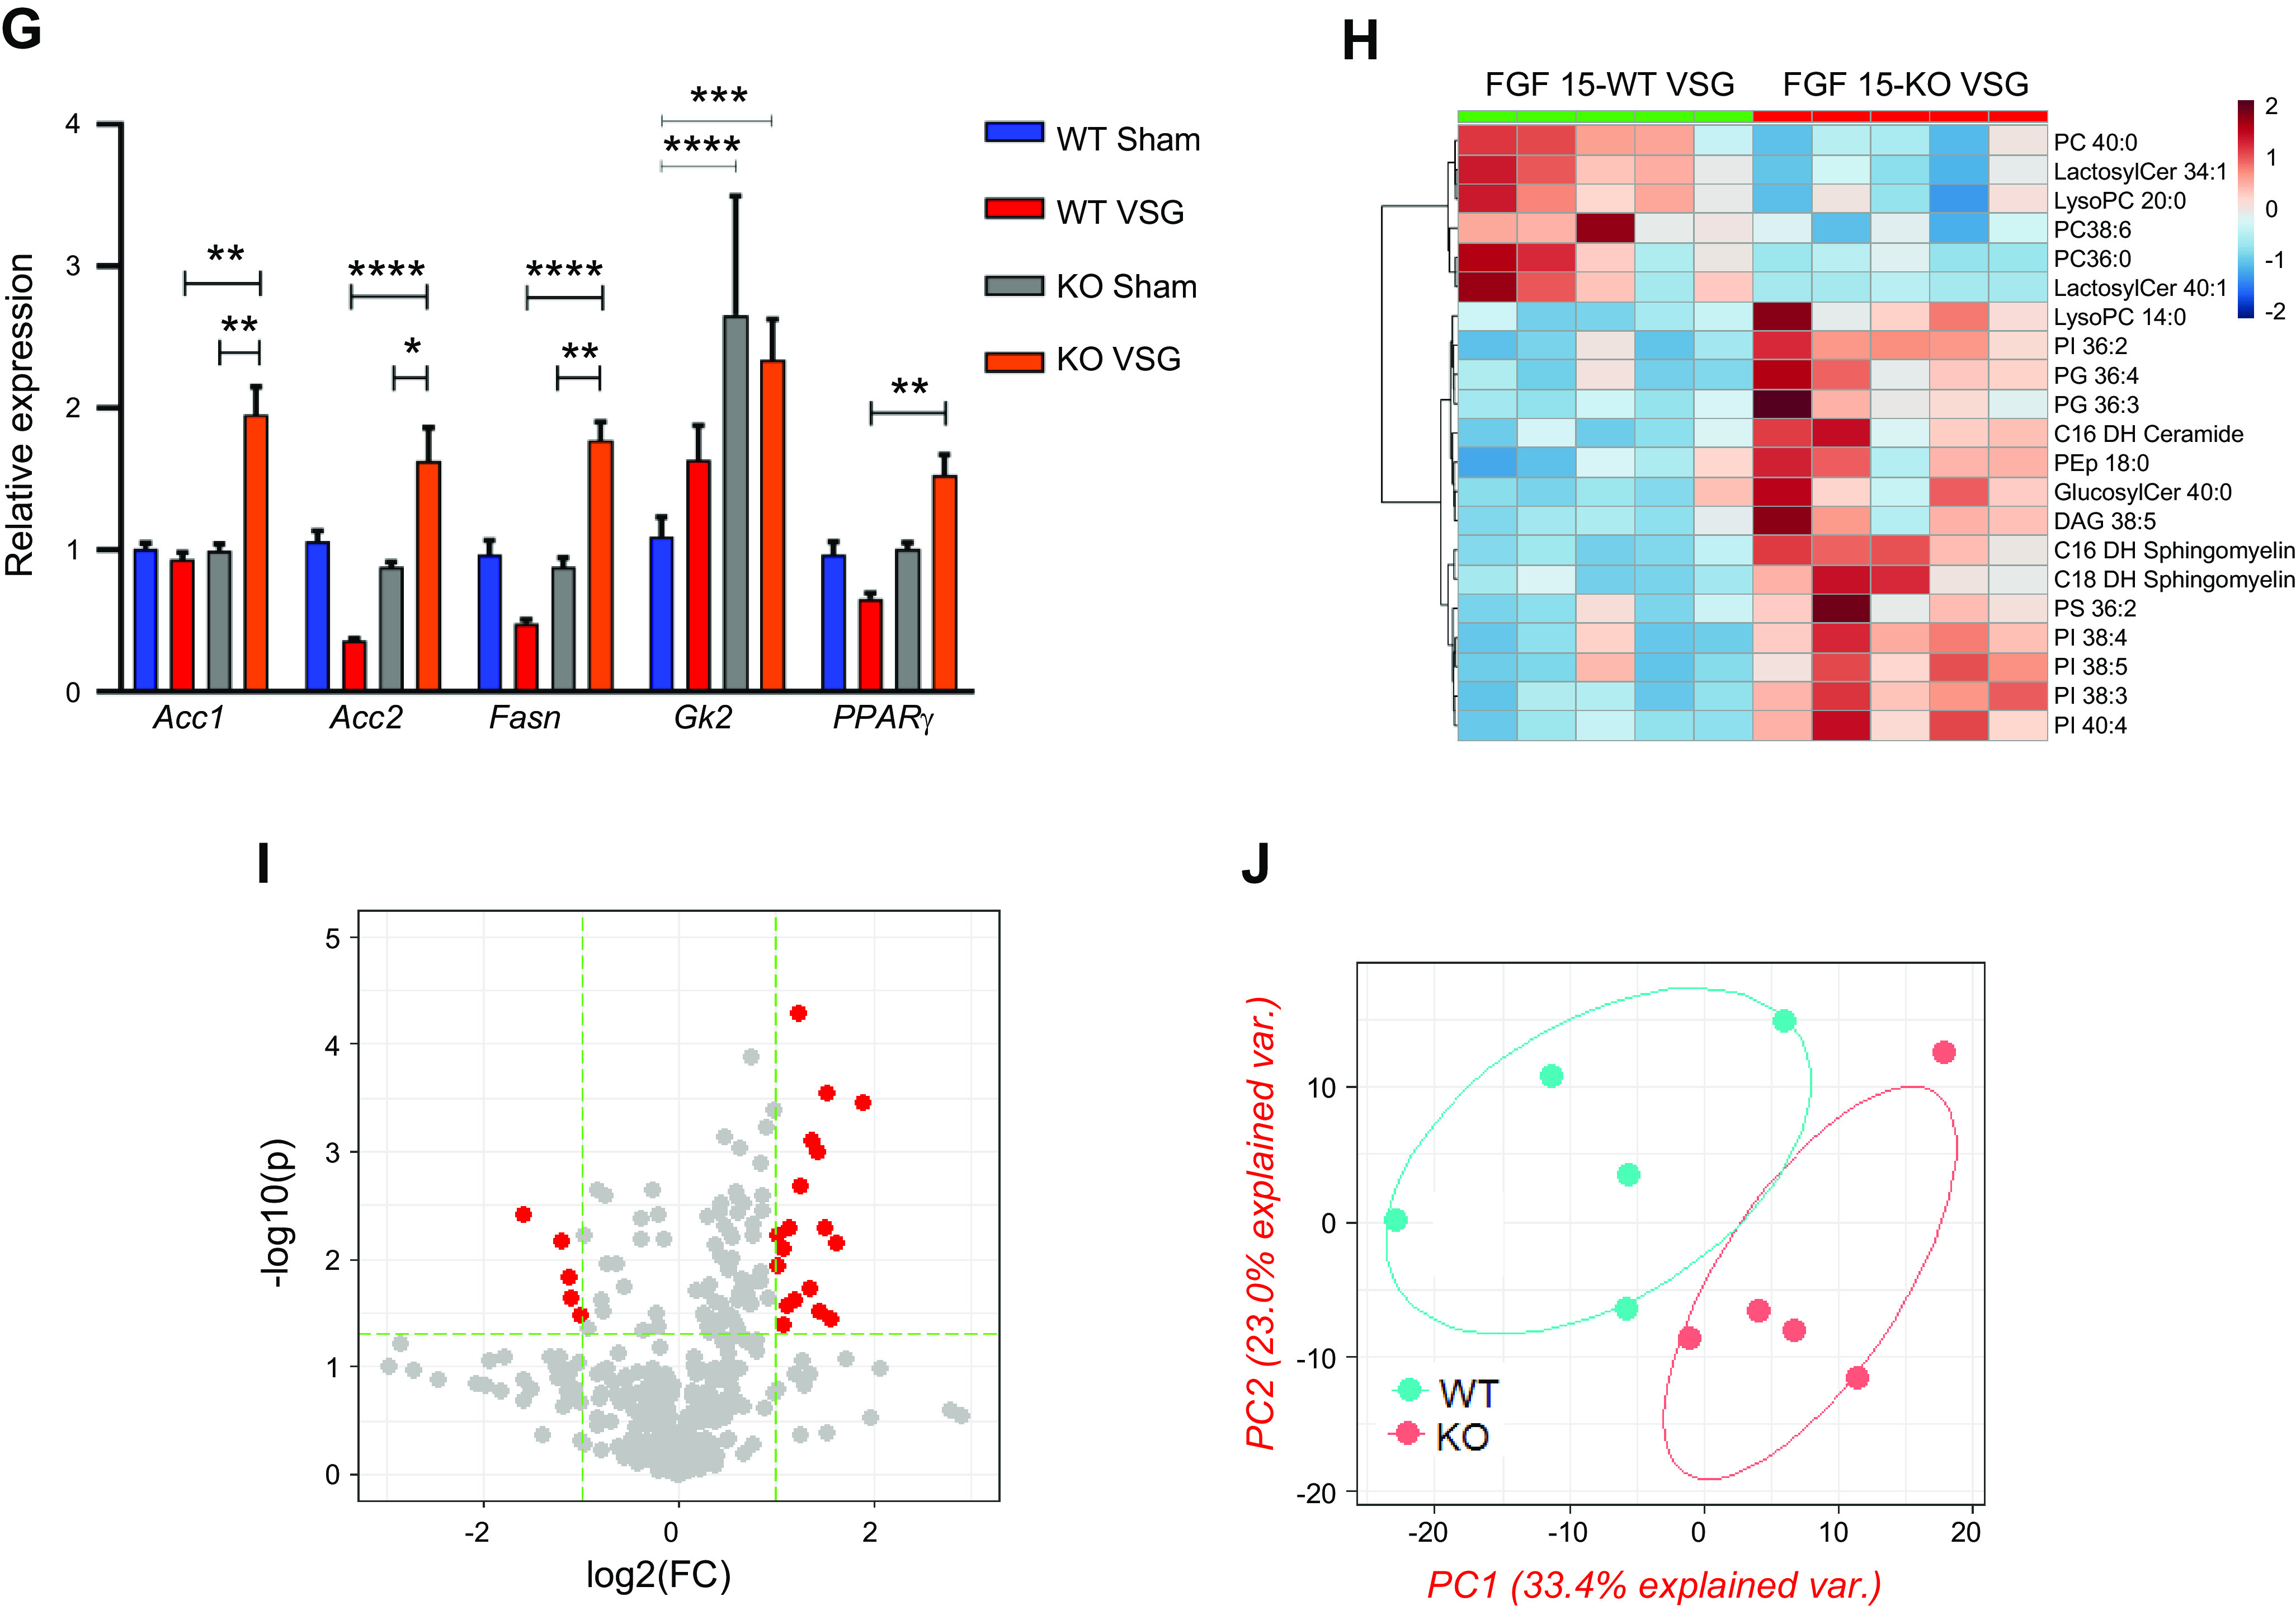
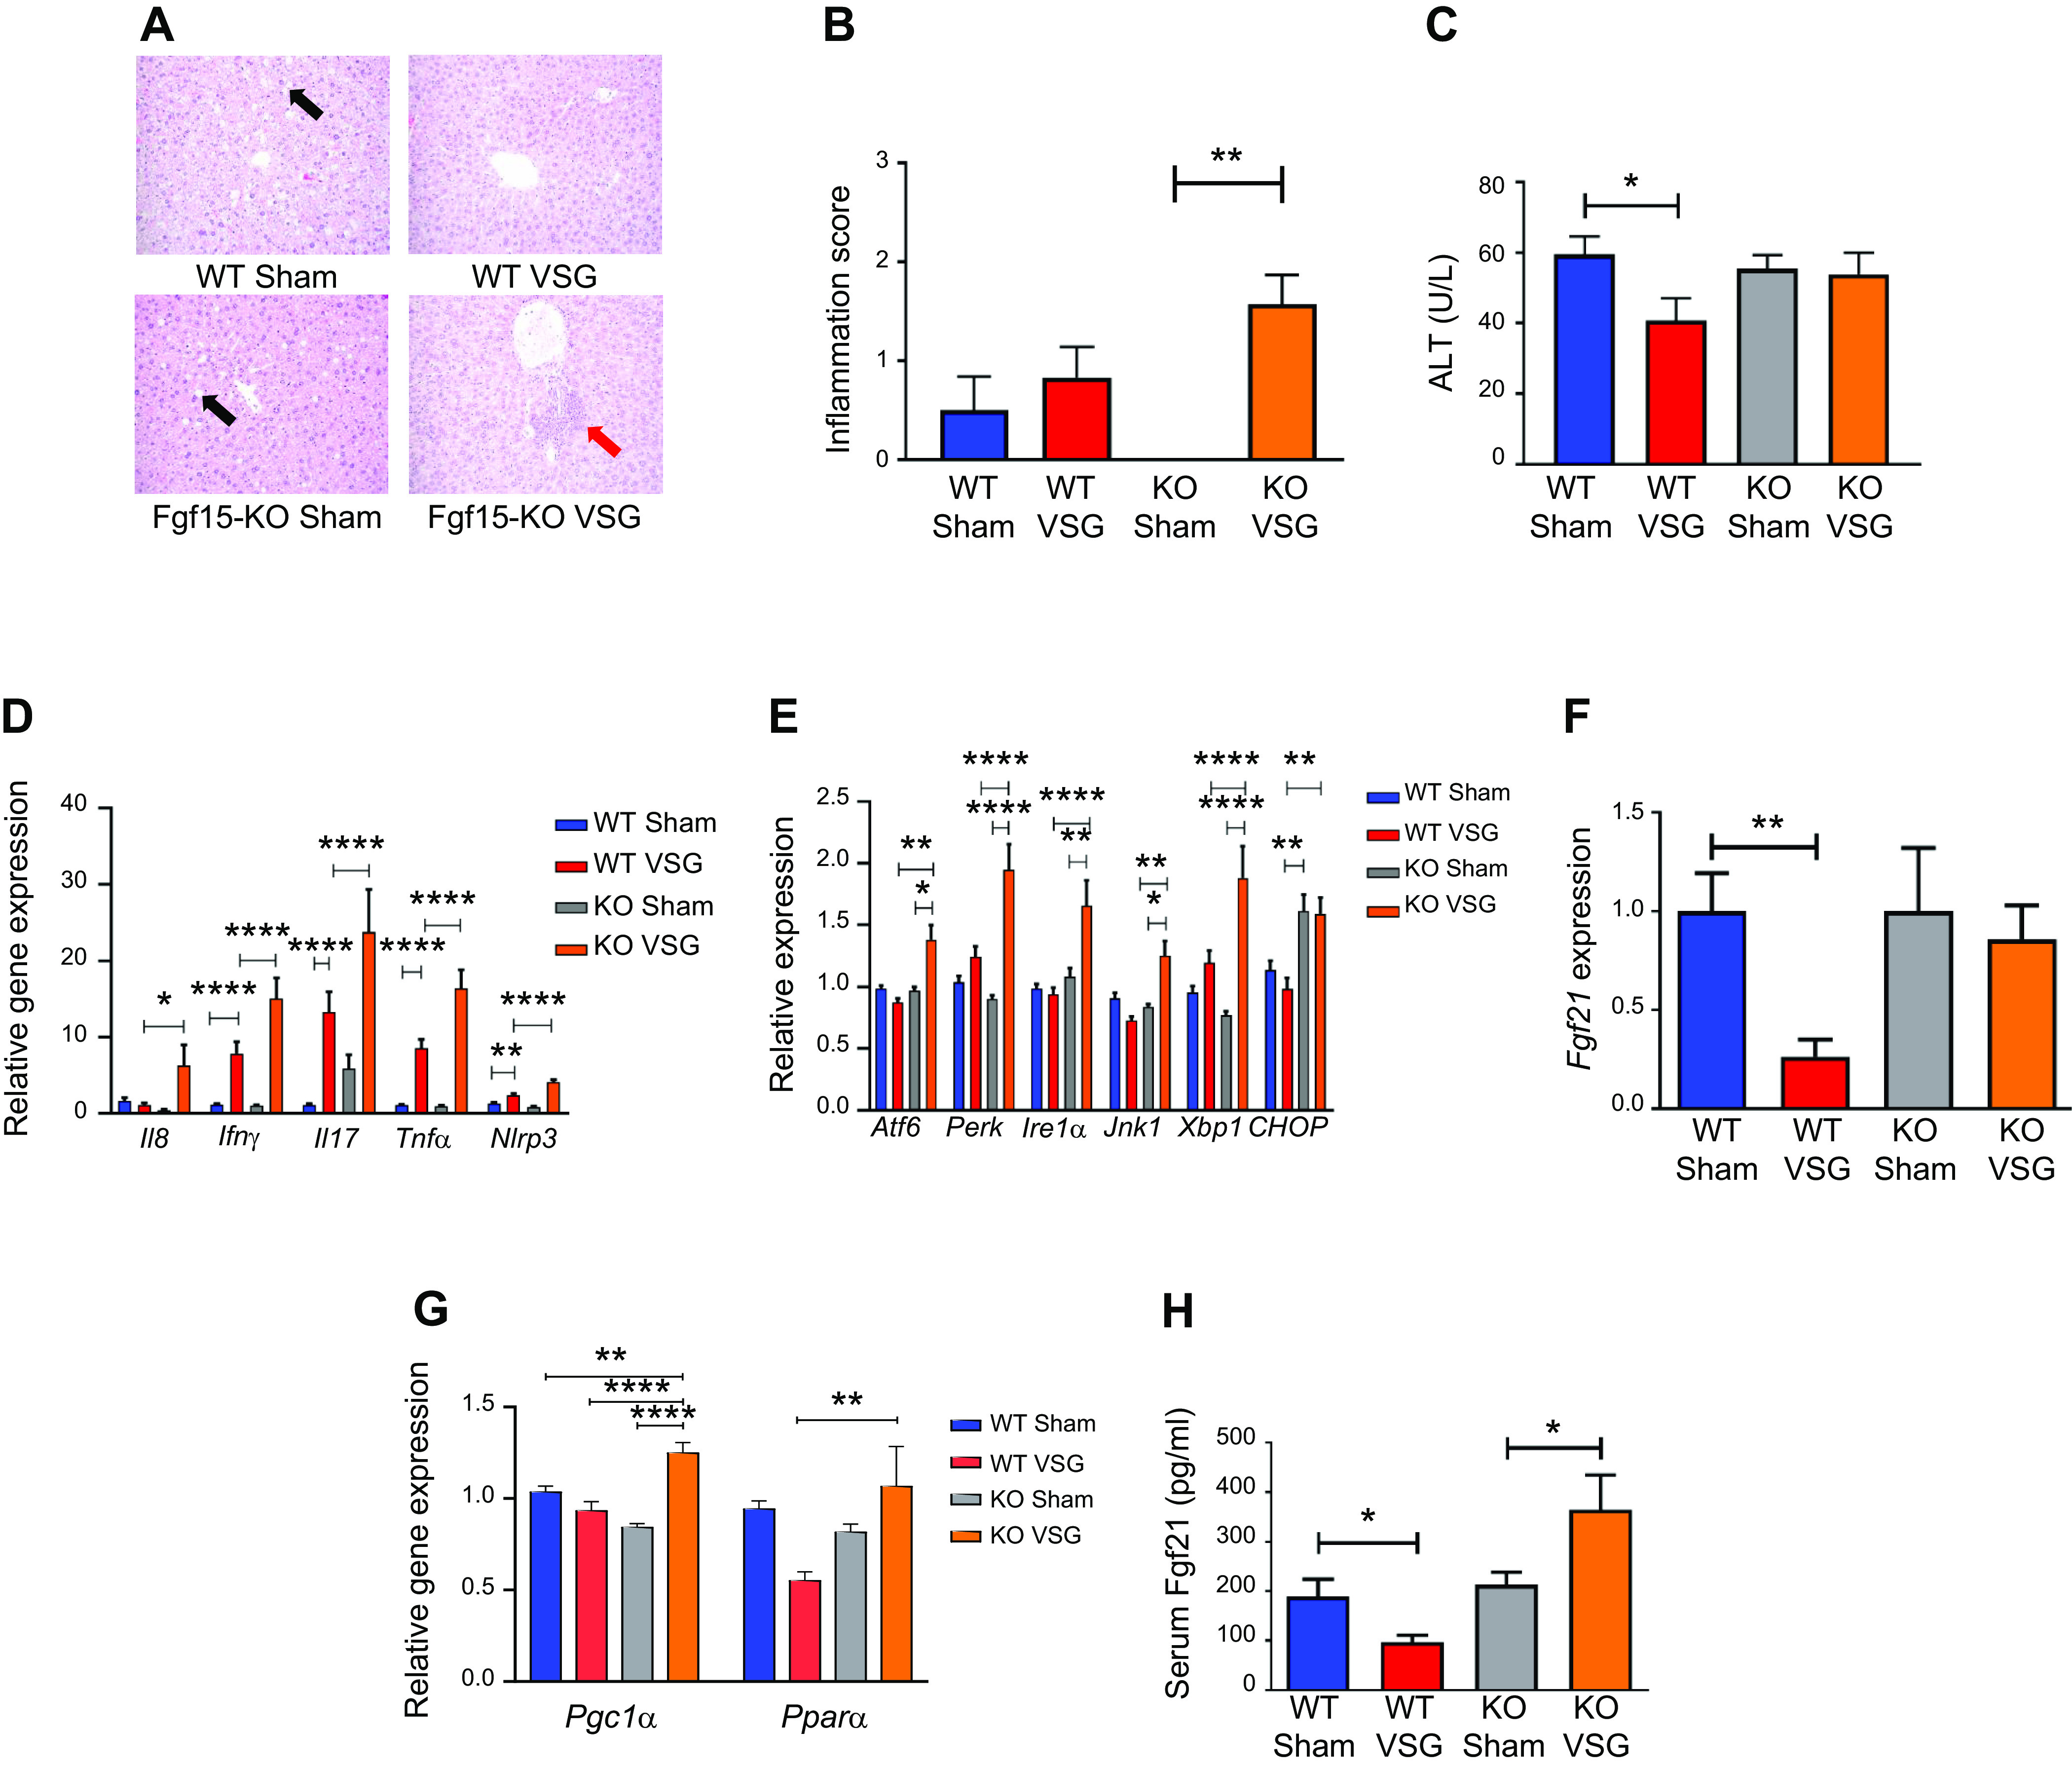
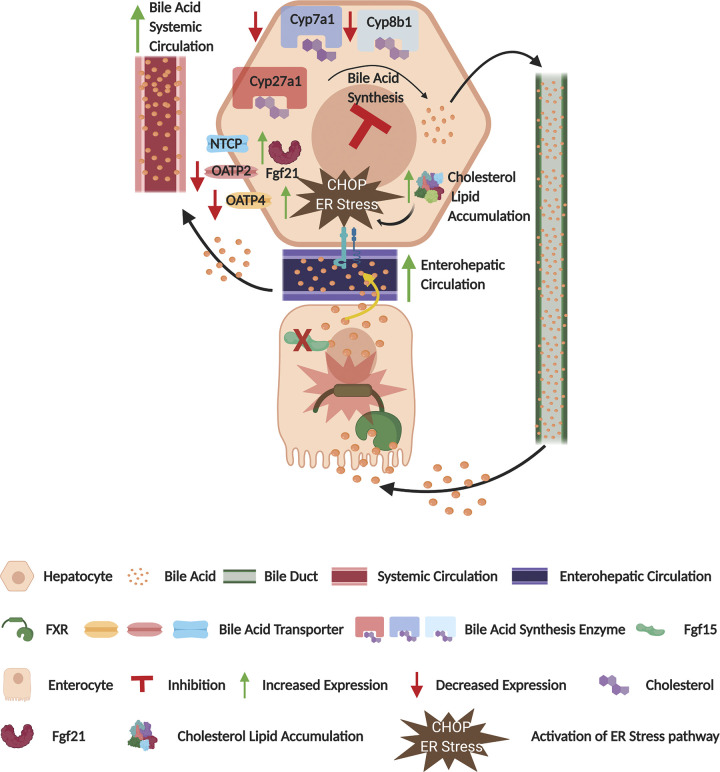
Vertical sleeve gastrectomy (VSG) is the best current therapy for remission of obesity and its co-morbidities. It is understood to alter the enterohepatic circulation of bile acids in vivo. Fibroblast growth factor 19 (FGF19) in human and its murine orthologue Fgf15 plays a pivotal role in this bile acid driven enterohepatic signaling. The present study evaluated the metabolic outcomes of VSG in Fgf15 deficient mice. 6-8 weeks old male wildtype mice (WT) and Fgf15 deficient mice (KO) were fed a high fat diet (HFD) for 8 weeks. At 8th week of diet, both WT and KO mice were randomly distributed to VSG or sham surgery. Post-surgery, mice were observed for 8 weeks while fed a HFD and then euthanized to collect tissues for experimental analysis. Fgf15 deficient (KO) mice lost weight post VSG, but glucose tolerance in KO mice did not improve post VSG compared to WT mice. Enteroids derived from WT and KO mice proliferated with bile acid exposure in vitro. Post VSG both WT and KO mice had similarly altered bile acid enterohepatic flux, however Fgf15 deficient mice post VSG had increased hepatic accumulation of free and esterified cholesterol leading to lipotoxicity related ER stress, inflammasome activation, and increased Fgf21 expression. Intact Fgf15 mediated enterohepatic bile acid signaling, but not changes in bile acid flux, appear to be important for the metabolic improvements post-murine bariatric surgery. These novel data introduce a potential point of distinction between bile acids acting as ligands compared to their canonical downstream signaling pathways.

Keywords: Bile acid; bariatric surgery; lipidomics; liver physiology; obesity.


Conflict of interest statement

R.J.S. has received research support from Novo Nordisk, Zafgen, MedImmune, and Sanofi and has served as a paid consultant to Ethicon Endo-Surgery/Johnson & Johnson, Orexigen, Novo Nordisk, Daiichi Sankyo, Janssen/Johnson & Johnson, Novartis, Paul Hastings Law Firm, Scohia, and Kallyope Inc. D.A.S. receives research support from Novo Nordisk, Ethicon Endo-Surgery, and Zafgen. R.K. receives research support from Johnson & Johnson. None of the other authors has any conflicts of interest, financial or otherwise, to disclose.

Figures

None
Graphical abstract
Fig. 1.
Fig. 1.
Fibroblast growth factor 15 (Fgf15) deficiency exacerbates glucose intolerance despite loss of body weight post-vertical sleeve gastrectomy (VSG). A: presurgery body weight dynamics in wild-type (WT) and knockout (KO) mice. Both groups gained weight on high-fat diet (HFD); however, KO mice were much lighter than WT mice; n: WT = 12, KO = 12. *P < 0.05, one-way ANOVA. B: oral glucose tolerance test presurgery and area under the curve (AUC). WT mice before surgery had lower glucose excursions compared with their KO littermates; n: WT = 9, KO = 9. *P < 0.05, t test. C: postsurgery body weight in WT and KO mice. Both VSG groups lost more weight than their respective Sham groups. However, because of KO VSG group’s postsurgery body weight plateau, it became significantly lighter compared with WT VSG group; n: WT Sham = 6, WT VSG = 6, KO Sham = 5, KO VSG = 7. D: postsurgery body weight percentage loss in WT and KO mice. KO VSG mice had the maximum body weight loss percentage postsurgery; n: WT Sham = 6, WT VSG = 6, KO Sham = 5, KO VSG = 7. **P < 0.01, ***P < 0.0001, two-way ANOVA. E: weekly average food intake. Both VSG groups consumed much less food during the first week after surgery compared with both Sham groups. No difference in food consumption was observed between VSG groups; n: WT Sham = 6, WT VSG = 6, KO Sham = 5, KO VSG = 7. *P < 0.05, WT Sham vs. WT VSG, ***P < 0.0001, KO Sham vs. KO VSG, two-way ANOVA. F: body fat content postsurgery. Fat mass was greater in Sham groups compared with their respective VSG groups. Furthermore, fat ratio was much lower in KO VSG compared with WT VSG mice; n: WT Sham = 6, WT VSG = 6, KO Sham = 5, KO VSG = 7. *P < 0.05, **P < 0.01, $P < 0.05 WT Sham vs. KO Sham, #P < 0.05 WT VSG vs. KO VSG, one-way ANOVA, t test). G: oral glucose tolerance test 28 days postsurgery and area under the curve. Blood glucose levels were lower in both VSG groups compared with their Sham groups; n: WT Sham = 6, WT VSG = 6, KO Sham = 5, KO VSG = 7. *P < 0.05, ***P < 0.01, one-way ANOVA. H: insulin/glucose ratio 14 days postsurgery. Insulin/glucose ratio was decreased in all groups except KO VSG; n: WT Sham = 6, WT VSG = 6, KO Sham = 5, KO VSG = 7. *P < 0.05, one-way ANOVA. I: hepatic insulin signaling gene expression at day 49 postsurgery. mRNA levels of genes coding for insulin signaling were measured by Biomark HD System high-throughput PCR and expressed in relative expression units. Pik3r1 and Akt3 genes were significantly overexpressed, whereas Akt1 and Akt2 were downregulated in KO VSG compared with WT VSG mice; n: WT Sham = 4, WT VSG = 5, KO Sham = 4, KO VSG = 6. *P < 0.05, **P < 0.01, ****P < 0.0001, one-way ANOVA.
Fig. 2.
Fig. 2.
Bile acid exposure increases ileal proliferation both in vitro and in vivo. A: 5-ethynyl-2′-deoxyuridine (EdU) staining of wild-type (WT)- and knockout (KO)-derived cholic acid (CA)-treated intestinal organoids. Ileum-derived ileal organoids actively proliferate when treated with 40 µM CA. E-cadherin (green), EdU proliferation (red), DAPI nucleus (blue); ×20 magnification. B: Edu/E-cadherin ratio of CA-treated intestinal organoids. Cell proliferation marker EdU incorporation was significantly increased in both WT- and KO-derived intestinal organoids after 40 µM CA treatment compared with organoids cultured in medium without CA addition; n: WT control = 11, WT CA = 11. **P < 0.01, t test). C: fibroblast growth factor 15 (Fgf15) expression in intestinal organoids after bile acid addition. Treatment of WT-derived intestinal organoids with 40 µM and 400 µM concentrations of CA and taurocholic acid (TCA) resulted in increased expression of Fgf15 gene; n: medium = 12, CA 40 µM = 12, CA 400 µM = 12, TCA 40 µM = 12, TCA 400 µM = 9. *P < 0.05, one-way ANOVA. D: hematoxylin-eosin-stained terminal ileum sections of WT and KO mice. Representative ×20 magnified terminal ileum sections. Drastic differences were not observed during morphological examination of the sections. E: villi surface area of WT and KO mice. Villi surface area of KO mice was significantly larger compared with WT mice; n: WT = 5, KO = 5. *P < 0.05, t test). F: villi volume of WT and KO mice. Villi volume of KO mice was significantly higher compared with WT mice; n: WT = 5, KO = 5. *P < 0.05, t test. G: representative ×20 magnified terminal ileum sections stained with apical sodium-dependent bile acid transporter (Asbt) antibody (green). H: Asbt surface area staining quantification in the ileum of WT and KO mice. Quantification is expressed as a ratio of Asbt antibody-stained area to total area. Stained area was larger in KO vertical sleeve gastrectomy (VSG) mice compared with mice of WT groups; n: WT Sham = 10, WT VSG = 14, KO Sham = 7, KO VSG = 13. *P < 0.05, t test.
Fig. 3.
Fig. 3.
Enterohepatic bile acid (BA) circulation in wild-type (WT) and knockout (KO) mice after vertical sleeve gastrectomy (VSG). A: total serum bile acid levels at day 49 postsurgery. Serum bile acid levels were higher in both VSG groups compared with Sham groups 49 days postsurgery; n: WT Sham = 6, WT VSG = 6, KO Sham = 5, KO VSG = 7. *P < 0.05, one-way ANOVA, t test. B: serum bile acid composition analysis at day 49 postsurgery. Most individual bile acids were elevated in serum of WT mice after VSG, whereas both VSG groups had increased serum levels of combined taurine-conjugated bile acids and total bile acids compared with their Sham groups. The following bile acids are indicated: tauromuricholate (TMCA), taurocholate (TCA), tauroursodeoxycholate (TUDCA), taurochenodeoxycholate (TCDCA), taurodeoxycholate (TDCA), taurolithocholate (TLCA), glycocholate (GCA), glycochenodeoxycholate (GCDCA), muricholic acid (MCA), cholic acid (CA), ursodeoxycholate (UDCA), and deoxycholate (DCA); n: WT Sham = 6, WT VSG = 5, KO Sham = 5, KO VSG = 6. *P < 0.05, **P < 0.01, ***P < 0.0001, t test). C: total hepatic bile acid levels at day 49 postsurgery. Hepatic bile acid levels were not significantly different between the groups; n: WT Sham = 5, WT VSG = 5, KO Sham = 5, KO VSG = 5. D: hepatic bile acid composition analysis at day 49 postsurgery. Levels of THDCA, TDCA, β-MCA, CA, and total unconjugated bile acids were elevated in liver of WT mice after VSG compared with WT Sham group. No significant difference was observed between KO Sham and VSG groups. The following bile acids are indicated: ω-TMCA, α-TMCA, β-TMCA, TCA, TUDCA, THDCA, TCDCA, TDCA, GCA, ω-MCA, α-MCA, β-MCA, CA, UDCA, HDCA, HDCA, DCA; n: WT Sham = 5, WT VSG = 5, KO Sham = 5, KO VSG = 5. *P < 0.05, **P < 0.01, ***P < 0.0001, t test. E: total ileal bile acid levels at day 49 postsurgery. Ileal bile acid levels were higher in KO Sham compared with KO VSG group 49 days postsurgery; n: WT Sham = 5, WT VSG = 5, KO Sham = 5, KO VSG = 5. *P < 0.05, one-way ANOVA. F: ileal bile acid composition analysis at day 49 postsurgery. Levels of α-TMCA, TCA, TUDCA, TCDCA, TDCA, UDCA, CDCA, and conjugated and total bile acids were elevated in the ileum of KO Sham compared with KO VSG mice. Percent unconjugated bile acids relative to total bile acids was higher in WT VSG compared with WT Sham group. The following bile acids are indicated: ω-TMCA, α-TMCA, β-TMCA, TCA, TUDCA, THDCA, TCDCA, TDCA, GCA, ω-MCA, α-MCA, β-MCA, CA, UDCA, HDCA, HDCA, DCA); n: WT Sham = 5, WT VSG = 5, KO Sham = 5, KO VSG = 5. *P < 0.05, **P < 0.01, t test. G: hepatic bile acid synthesis and uptake gene expression at day 49 postsurgery. mRNA levels of genes coding for bile acid production [Cyp7a1 (cytochrome P-450-7a1), Cyp8b1, and Cyp27a1], bile acid uptake [Ntcp (Na+-taurocholate-cotransporting polypeptide), Oatp2 (organic ion transporting polypeptide 2), and Oatp4) were measured by RT-PCR and expressed in relative expression units. These genes were similarly suppressed in both VSG relative to Sham groups; n: WT Sham = 4, WT VSG = 5, KO Sham = 4, KO VSG = 6. *P < 0.05, **P < 0.01, ***P < 0.0001, one-way ANOVA, t test. H: serum deuterium-taurocholic acid (D4-TCA) concentration after duodenal administration. D4-TCA serum levels were assessed before and at 30, 60, and 90 min after injection in WT and KO mice after VSG and Sham surgery. D4-TCA levels were much higher at all time-points in both VSG groups; n: WT Sham = 9, WT VSG = 12, KO Sham = 5, KO VSG = 5. *P < 0.05, ***P < 0.0001, two-way ANOVA.
Fig. 3.
Fig. 3.
Enterohepatic bile acid (BA) circulation in wild-type (WT) and knockout (KO) mice after vertical sleeve gastrectomy (VSG). A: total serum bile acid levels at day 49 postsurgery. Serum bile acid levels were higher in both VSG groups compared with Sham groups 49 days postsurgery; n: WT Sham = 6, WT VSG = 6, KO Sham = 5, KO VSG = 7. *P < 0.05, one-way ANOVA, t test. B: serum bile acid composition analysis at day 49 postsurgery. Most individual bile acids were elevated in serum of WT mice after VSG, whereas both VSG groups had increased serum levels of combined taurine-conjugated bile acids and total bile acids compared with their Sham groups. The following bile acids are indicated: tauromuricholate (TMCA), taurocholate (TCA), tauroursodeoxycholate (TUDCA), taurochenodeoxycholate (TCDCA), taurodeoxycholate (TDCA), taurolithocholate (TLCA), glycocholate (GCA), glycochenodeoxycholate (GCDCA), muricholic acid (MCA), cholic acid (CA), ursodeoxycholate (UDCA), and deoxycholate (DCA); n: WT Sham = 6, WT VSG = 5, KO Sham = 5, KO VSG = 6. *P < 0.05, **P < 0.01, ***P < 0.0001, t test). C: total hepatic bile acid levels at day 49 postsurgery. Hepatic bile acid levels were not significantly different between the groups; n: WT Sham = 5, WT VSG = 5, KO Sham = 5, KO VSG = 5. D: hepatic bile acid composition analysis at day 49 postsurgery. Levels of THDCA, TDCA, β-MCA, CA, and total unconjugated bile acids were elevated in liver of WT mice after VSG compared with WT Sham group. No significant difference was observed between KO Sham and VSG groups. The following bile acids are indicated: ω-TMCA, α-TMCA, β-TMCA, TCA, TUDCA, THDCA, TCDCA, TDCA, GCA, ω-MCA, α-MCA, β-MCA, CA, UDCA, HDCA, HDCA, DCA; n: WT Sham = 5, WT VSG = 5, KO Sham = 5, KO VSG = 5. *P < 0.05, **P < 0.01, ***P < 0.0001, t test. E: total ileal bile acid levels at day 49 postsurgery. Ileal bile acid levels were higher in KO Sham compared with KO VSG group 49 days postsurgery; n: WT Sham = 5, WT VSG = 5, KO Sham = 5, KO VSG = 5. *P < 0.05, one-way ANOVA. F: ileal bile acid composition analysis at day 49 postsurgery. Levels of α-TMCA, TCA, TUDCA, TCDCA, TDCA, UDCA, CDCA, and conjugated and total bile acids were elevated in the ileum of KO Sham compared with KO VSG mice. Percent unconjugated bile acids relative to total bile acids was higher in WT VSG compared with WT Sham group. The following bile acids are indicated: ω-TMCA, α-TMCA, β-TMCA, TCA, TUDCA, THDCA, TCDCA, TDCA, GCA, ω-MCA, α-MCA, β-MCA, CA, UDCA, HDCA, HDCA, DCA); n: WT Sham = 5, WT VSG = 5, KO Sham = 5, KO VSG = 5. *P < 0.05, **P < 0.01, t test. G: hepatic bile acid synthesis and uptake gene expression at day 49 postsurgery. mRNA levels of genes coding for bile acid production [Cyp7a1 (cytochrome P-450-7a1), Cyp8b1, and Cyp27a1], bile acid uptake [Ntcp (Na+-taurocholate-cotransporting polypeptide), Oatp2 (organic ion transporting polypeptide 2), and Oatp4) were measured by RT-PCR and expressed in relative expression units. These genes were similarly suppressed in both VSG relative to Sham groups; n: WT Sham = 4, WT VSG = 5, KO Sham = 4, KO VSG = 6. *P < 0.05, **P < 0.01, ***P < 0.0001, one-way ANOVA, t test. H: serum deuterium-taurocholic acid (D4-TCA) concentration after duodenal administration. D4-TCA serum levels were assessed before and at 30, 60, and 90 min after injection in WT and KO mice after VSG and Sham surgery. D4-TCA levels were much higher at all time-points in both VSG groups; n: WT Sham = 9, WT VSG = 12, KO Sham = 5, KO VSG = 5. *P < 0.05, ***P < 0.0001, two-way ANOVA.
Fig. 4.
Fig. 4.
Fibroblast growth factor 15 (Fgf15) deficiency is associated with accumulation of esterified cholesterol and lipotoxicity in mice post-vertical sleeve gastrectomy (VSG). A: hepatic triglyceride (TG) content 49 days postsurgery. Liver triglyceride levels were much lower in both VSG groups compared with their respective Sham controls; n: wild-type (WT) Sham = 6, WT VSG = 6, knockout (KO) Sham = 5, KO VSG = 7. **P < 0.01, one-way ANOVA. B: liver weight/body weight ratio 49 days postsurgery. Liver weight/body weight ratio was greater in KO VSG mice compared with all other groups; n: WT Sham = 6, WT VSG = 6, KO Sham = 5, KO VSG = 7. *P < 0.05, **P < 0.01, one-way ANOVA. C: hepatic free cholesterol content 49 days postsurgery. Liver free cholesterol levels were elevated in both VSG groups; n: WT Sham = 6, WT VSG = 6, KO Sham = 5, KO VSG = 7. *P < 0.05, one-way ANOVA. D: hepatic esterified cholesterol content 49 days postsurgery. Liver esterified cholesterol levels were elevated in KO VSG group; n: WT Sham = 6, WT VSG = 6, KO Sham = 5, KO VSG = 7. *P < 0.05, one-way ANOVA, t test. E: Hmg-CoA reductase (3-hydroxy-3-methyl-glutaryl-CoA reductase), Abcg5, and Abcg8 gene expression at day 49 postsurgery. mRNA levels of the genes coding for the cholesterol synthesis (Hmg-CoA reductase), cholesterol efflux pump ATP-binding cassette, subfamily G (WHITE), member 5 (sterolin 1, Abcg5), cholesterol efflux pump ATP-binding cassette, subfamily G (WHITE), member 8 (sterolin 2, Abcg8) were measured by RT-PCR and expressed in relative expression units. Cholesterol synthesis rate-limiting gene was not downregulated in KO VSG group. Cholesterol export genes were suppressed in KO VSG group; n: WT Sham = 4, WT VSG = 4, KO Sham = 4, KO VSG = 6. *P < 0.05, **P < 0.01, ****P < 0.0001, one-way ANOVA, t test). F: Cpt1a, CD36, and Scd1 gene expression at day 49 postsurgery. mRNA levels of the genes coding lipid transport carnitine palmitoyltransferase-1A (Cpt1a), lipid synthesis (CD36), and lipid synthesis stearoyl-CoA desaturase (Scd1) were measured by RT-PCR and expressed in relative expression units. These genes were mostly suppressed in WT VSG group (only trend in KO VSG) relative to Sham group; n: WT Sham = 4, WT VSG = 5, KO Sham = 4, KO VSG = 6. *P < 0.05, ***P < 0.0001, one-way ANOVA, t test. G: hepatic fatty acid oxidation gene expression at day 49 postsurgery. mRNA levels of genes coding for fatty acid oxidation were measured by Biomark HD System high-throughput PCR and expressed in relative expression units. Acc1 (acetyl-CoA carboxylase-1), Acc2, and Fasn (fatty acid synthase) genes were significantly overexpressed only in KO VSG mice; n: WT Sham = 4, WT VSG = 5, KO Sham = 4, KO VSG = 6; *P < 0.05, **P < 0.01, ****P < 0.0001, one-way ANOVA, t test; n: WT Sham = 6, WT VSG = 6, KO Sham = 5, KO VSG = 7; *P < 0.05, **P < 0.01, ****P < 0.0001, one-way ANOVA. H: heat map of significantly changed lipid compounds obtained from WT VSG vs. KO VSG mouse livers. Phosphatidylcholine (PC) was decreased in KO VSG comparing to WT VSG, while phosphatidylinositol (PI), diacylglycerol (DAG), phosphatidylglycerol (PG), and sphingomyelin (SM) were increased in KO VSG mice; n: WT VSG = 5, KO VSG = 5. I: volcano plot of 418 identified lipid compounds; 24 lipid compound ions were significantly different between WT VSG and KO VSG groups with fold change >2 and P < 0.05; n: WT VSG = 5, KO VSG = 5. J: principal component analysis (PCA) of mouse liver separates; 418 identified lipid compounds were analyzed in electrospray positive and negative modes from liver tissue of mice collected at 49 days postsurgery; n: WT VSG = 5, KO VSG = 5.
Fig. 4.
Fig. 4.
Fibroblast growth factor 15 (Fgf15) deficiency is associated with accumulation of esterified cholesterol and lipotoxicity in mice post-vertical sleeve gastrectomy (VSG). A: hepatic triglyceride (TG) content 49 days postsurgery. Liver triglyceride levels were much lower in both VSG groups compared with their respective Sham controls; n: wild-type (WT) Sham = 6, WT VSG = 6, knockout (KO) Sham = 5, KO VSG = 7. **P < 0.01, one-way ANOVA. B: liver weight/body weight ratio 49 days postsurgery. Liver weight/body weight ratio was greater in KO VSG mice compared with all other groups; n: WT Sham = 6, WT VSG = 6, KO Sham = 5, KO VSG = 7. *P < 0.05, **P < 0.01, one-way ANOVA. C: hepatic free cholesterol content 49 days postsurgery. Liver free cholesterol levels were elevated in both VSG groups; n: WT Sham = 6, WT VSG = 6, KO Sham = 5, KO VSG = 7. *P < 0.05, one-way ANOVA. D: hepatic esterified cholesterol content 49 days postsurgery. Liver esterified cholesterol levels were elevated in KO VSG group; n: WT Sham = 6, WT VSG = 6, KO Sham = 5, KO VSG = 7. *P < 0.05, one-way ANOVA, t test. E: Hmg-CoA reductase (3-hydroxy-3-methyl-glutaryl-CoA reductase), Abcg5, and Abcg8 gene expression at day 49 postsurgery. mRNA levels of the genes coding for the cholesterol synthesis (Hmg-CoA reductase), cholesterol efflux pump ATP-binding cassette, subfamily G (WHITE), member 5 (sterolin 1, Abcg5), cholesterol efflux pump ATP-binding cassette, subfamily G (WHITE), member 8 (sterolin 2, Abcg8) were measured by RT-PCR and expressed in relative expression units. Cholesterol synthesis rate-limiting gene was not downregulated in KO VSG group. Cholesterol export genes were suppressed in KO VSG group; n: WT Sham = 4, WT VSG = 4, KO Sham = 4, KO VSG = 6. *P < 0.05, **P < 0.01, ****P < 0.0001, one-way ANOVA, t test). F: Cpt1a, CD36, and Scd1 gene expression at day 49 postsurgery. mRNA levels of the genes coding lipid transport carnitine palmitoyltransferase-1A (Cpt1a), lipid synthesis (CD36), and lipid synthesis stearoyl-CoA desaturase (Scd1) were measured by RT-PCR and expressed in relative expression units. These genes were mostly suppressed in WT VSG group (only trend in KO VSG) relative to Sham group; n: WT Sham = 4, WT VSG = 5, KO Sham = 4, KO VSG = 6. *P < 0.05, ***P < 0.0001, one-way ANOVA, t test. G: hepatic fatty acid oxidation gene expression at day 49 postsurgery. mRNA levels of genes coding for fatty acid oxidation were measured by Biomark HD System high-throughput PCR and expressed in relative expression units. Acc1 (acetyl-CoA carboxylase-1), Acc2, and Fasn (fatty acid synthase) genes were significantly overexpressed only in KO VSG mice; n: WT Sham = 4, WT VSG = 5, KO Sham = 4, KO VSG = 6; *P < 0.05, **P < 0.01, ****P < 0.0001, one-way ANOVA, t test; n: WT Sham = 6, WT VSG = 6, KO Sham = 5, KO VSG = 7; *P < 0.05, **P < 0.01, ****P < 0.0001, one-way ANOVA. H: heat map of significantly changed lipid compounds obtained from WT VSG vs. KO VSG mouse livers. Phosphatidylcholine (PC) was decreased in KO VSG comparing to WT VSG, while phosphatidylinositol (PI), diacylglycerol (DAG), phosphatidylglycerol (PG), and sphingomyelin (SM) were increased in KO VSG mice; n: WT VSG = 5, KO VSG = 5. I: volcano plot of 418 identified lipid compounds; 24 lipid compound ions were significantly different between WT VSG and KO VSG groups with fold change >2 and P < 0.05; n: WT VSG = 5, KO VSG = 5. J: principal component analysis (PCA) of mouse liver separates; 418 identified lipid compounds were analyzed in electrospray positive and negative modes from liver tissue of mice collected at 49 days postsurgery; n: WT VSG = 5, KO VSG = 5.
Fig. 5.
Fig. 5.
Fibroblast growth factor 15 (Fgf15) deficiency results in increased hepatic inflammation via an endoplasmic reticulum (ER) stress mechanism post-post-vertical sleeve gastrectomy (VSG). A: hepatic histology 49 days postsurgery. Representative ×20 magnified hematoxylin-eosin sections showed lipid droplet accumulation in livers of Sham-operated groups (black arrow), whereas this was not observed in VSG groups. In knockout (KO) VSG mice, we observed inflammation foci in liver parenchyma (red arrow). B: Hepatic inflammation score 49 days postsurgery. KO VSG mice developed inflammation in liver compared with their control group, which is expressed quantitatively by inflammation score bar graph. No inflammation was observed in KO Sham liver sections; therefore, no inflammation score was plotted for same; n: wild-type (WT) Sham = 6, WT VSG = 6, KO Sham = 5, KO VSG = 7. **P < 0.01, one-way ANOVA. C: serum alanine aminotransferase (ALT) levels 49 days postsurgery. ALT was lower in WT VSG mice compared with WT Sham mice 49 days postsurgery; n: WT Sham = 6, WT VSG = 6, KO Sham = 5, KO VSG = 7. *P < 0.05, t test. D: hepatic inflammation gene expression at day 49 postsurgery. mRNA levels of genes coding for inflammation were measured by Biomark HD System high-throughput PCR and expressed in relative expression units. Interleukin-8 (Il8), interferon-γ (IFNγ), interleukin-17 (Il17), tumor necrosis factor-α (TNFα), and Nlrp3 (NOD-, LRR- and pyrin domain-containing protein-3) were significantly overexpressed only in KO VSG mice; n: WT Sham = 4, WT VSG = 5, KO Sham = 4, KO VSG = 6; *P < 0.05, **P < 0.01, ****P < 0.0001, one-way ANOVA, t test; n: WT Sham = 6, WT VSG = 6, KO Sham = 5, KO VSG = 7; (*P < 0.05, **P < 0.01, ****P < 0.0001, one-way ANOVA. E: hepatic ER stress gene expression at day 49 postsurgery. mRNA levels of genes coding for ER stress were measured by Biomark HD System high-throughput PCR and expressed in relative expression units. Atf6, Perk, Ire1a, Jnk1, and Xbp1 were significantly overexpressed only in KO VSG mice; n: WT Sham = 4, WT VSG = 5, KO Sham = 4, KO VSG = 6; *P < 0.05, **P < 0.01, ****P < 0.0001, one-way ANOVA, t test; n: WT Sham = 6, WT VSG = 6, KO Sham = 5, KO VSG = 7; *P < 0.05, **P < 0.01, ****P < 0.0001, one-way ANOVA. F: hepatic Fgf21 gene expression at day 49 postsurgery. mRNA levels of the gene coding for Fgf21 was measured by RT-PCR and expressed in relative expression units. Fgf21 was suppressed in WT VSG compared with WT Sham group, whereas this was not observed in KO VSG mice; n: WT Sham = 4, WT VSG = 5, KO Sham = 4, KO VSG = 6. **P < 0.01, one-way ANOVA, t test. G: hepatic PPARα (peroxisome proliferator-activated receptor-α) and PGC-1α (PPARγ coactivator 1α) gene expression at day 49 postsurgery. mRNA levels of PPAR.α and PGC-1α genes were measured by Biomark HD System high-throughput PCR and expressed in relative expression units. PPARα was suppressed in WT VSG compared with KO VSG group, whereas PGC-1α was overexpressed in KO VSG mice relative to all other groups; n: WT Sham = 6, WT VSG = 6, KO Sham = 5, KO VSG = 7. *P < 0.05, **P < 0.01, ****P < 0.0001, one-way ANOVA. H: serum Fgf21 levels at day 49 postsurgery. Serum Fgf21 levels were decreased in WT VSG mice, whereas they were drastically increased in KO VSG mice compared with their respective Sham controls; n: WT Sham = 6, WT VSG = 6, KO Sham = 5, KO VSG = 7. *P < 0.05, one-way ANOVA, t test.
Fig. 6.
Fig. 6.
Fibroblast growth factor 15 (Fgf15) deficiency induces cholesterol and lipid accumulation. Graphic representation of the effect of vertical sleeve gastrectomy (VSG) in Fgf15-deficient mice. CHOP, CCAAT enhancer-binding protein homologous protein; Cyp, cytochrome P-450; ER, endoplasmic reticulum; NTCP, Na+-taurocholate-cotransporting polypeptide; OATP, organic anion transporter polypeptide.

Similar articles

Cited by

References

    1. Al-Khaifi A, Rudling M, Angelin B. An FXR agonist reduces bile acid synthesis independently of increases in FGF19 in healthy volunteers. Gastroenterology 155: 1012–1016, 2018. doi:10.1053/j.gastro.2018.06.038. - DOI - PubMed
    1. Angrisani L, Santonicola A, Iovino P, Vitiello A, Zundel N, Buchwald H, Scopinaro N. Bariatric surgery and endoluminal procedures: IFSO worldwide survey 2014. Obes Surg 27: 2279–2289, 2017. [Erratum Obes Surg 27: 2290–2292, 2017]. doi:10.1007/s11695-017-2666-x. - DOI - PMC - PubMed
    1. Asrih M, Montessuit C, Philippe J, Jornayvaz FR. Free fatty acids impair FGF21 action in HepG2 cells. Cell Physiol Biochem 37: 1767–1778, 2015. doi:10.1159/000438540. - DOI - PubMed
    1. Camporez JP, Kanda S, Petersen MC, Jornayvaz FR, Samuel VT, Bhanot S, Petersen KF, Jurczak MJ, Shulman GI. ApoA5 knockdown improves whole-body insulin sensitivity in high-fat-fed mice by reducing ectopic lipid content. J Lipid Res 56: 526–536, 2015. doi:10.1194/jlr.M054080. - DOI - PMC - PubMed
    1. Cariou B, van Harmelen K, Duran-Sandoval D, van Dijk TH, Grefhorst A, Abdelkarim M, Caron S, Torpier G, Fruchart JC, Gonzalez FJ, Kuipers F, Staels B. The farnesoid X receptor modulates adiposity and peripheral insulin sensitivity in mice. J Biol Chem 281: 11039–11049, 2006. doi:10.1074/jbc.M510258200. - DOI - PubMed

LinkOut - more resources