. 2021 Sep;17(9):2184-2199.
doi: 10.1080/15548627.2020.1820778. Epub 2020 Sep 24.

Selective autophagy regulates heat stress memory in Arabidopsis by NBR1-mediated targeting of HSP90.1 and ROF1

Affiliations

Selective autophagy regulates heat stress memory in Arabidopsis by NBR1-mediated targeting of HSP90.1 and ROF1

Venkatesh P Thirumalaikumar et al. Autophagy. 2021 Sep.

Abstract

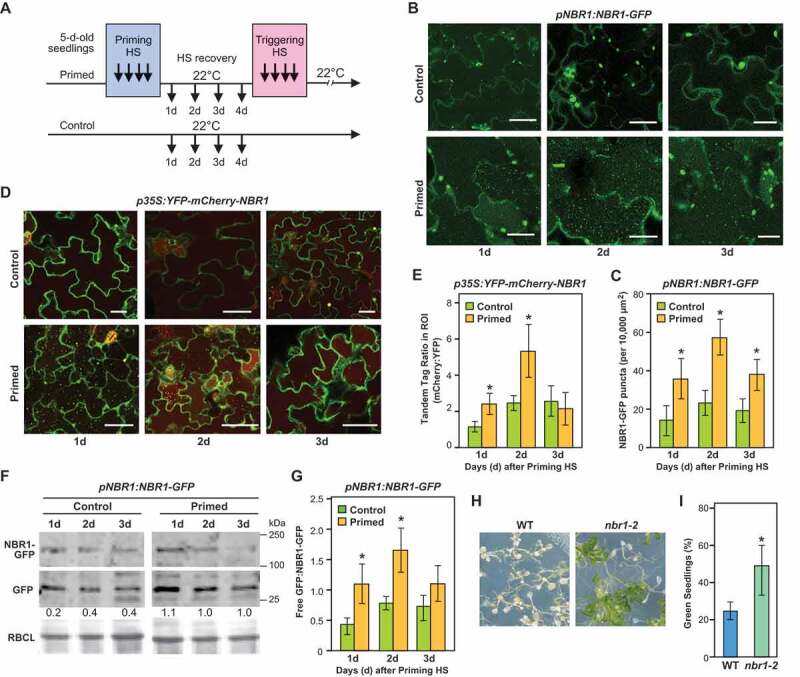
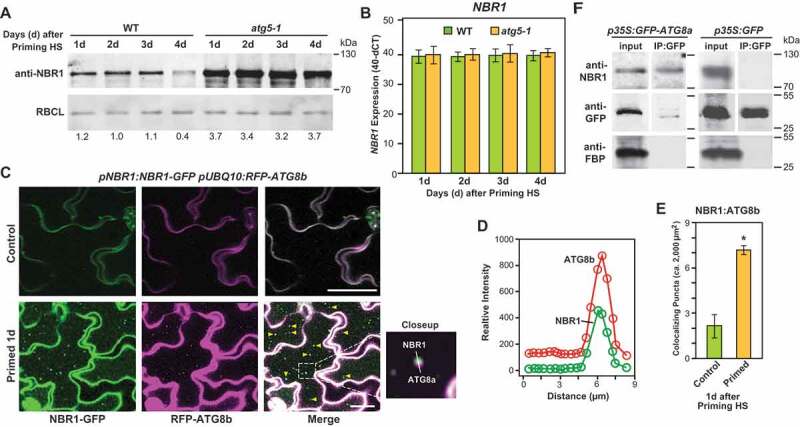
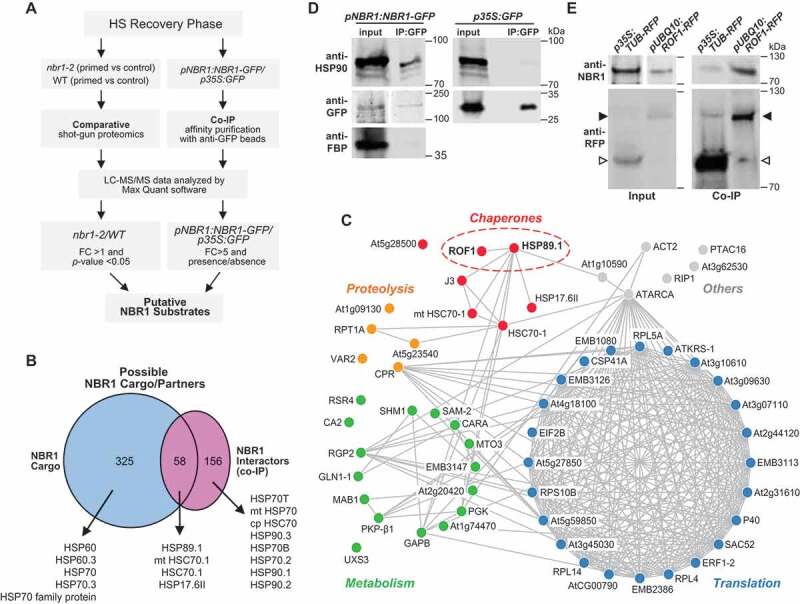
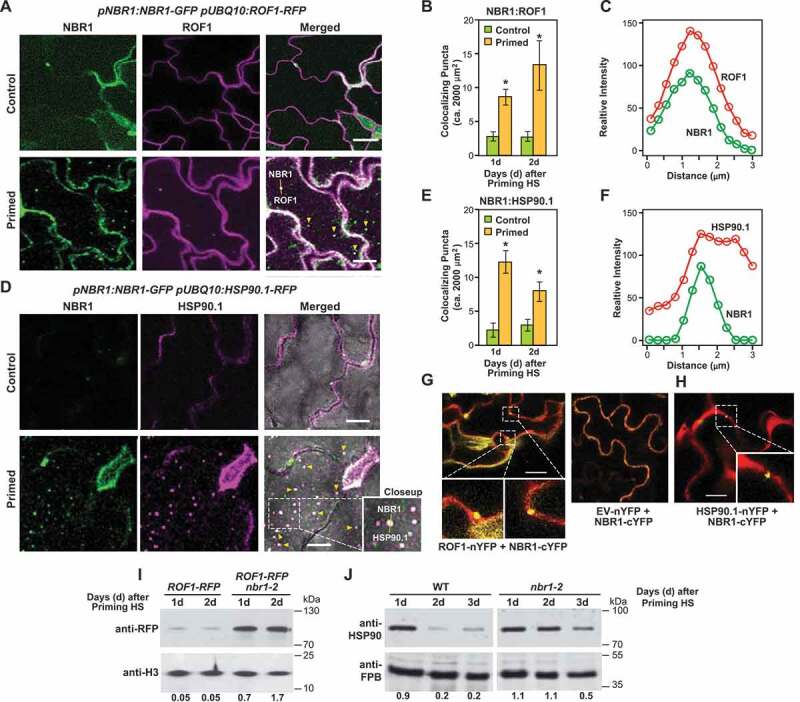
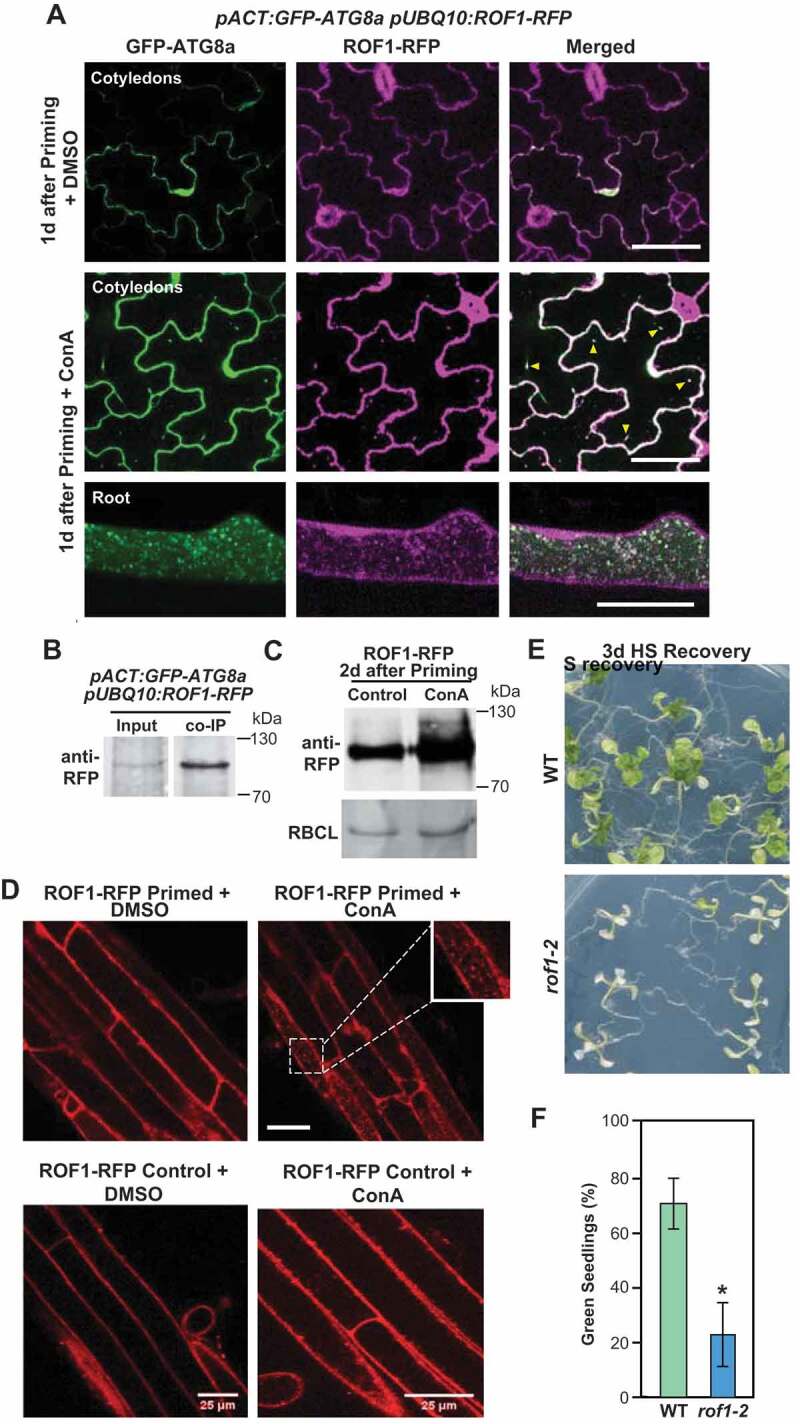
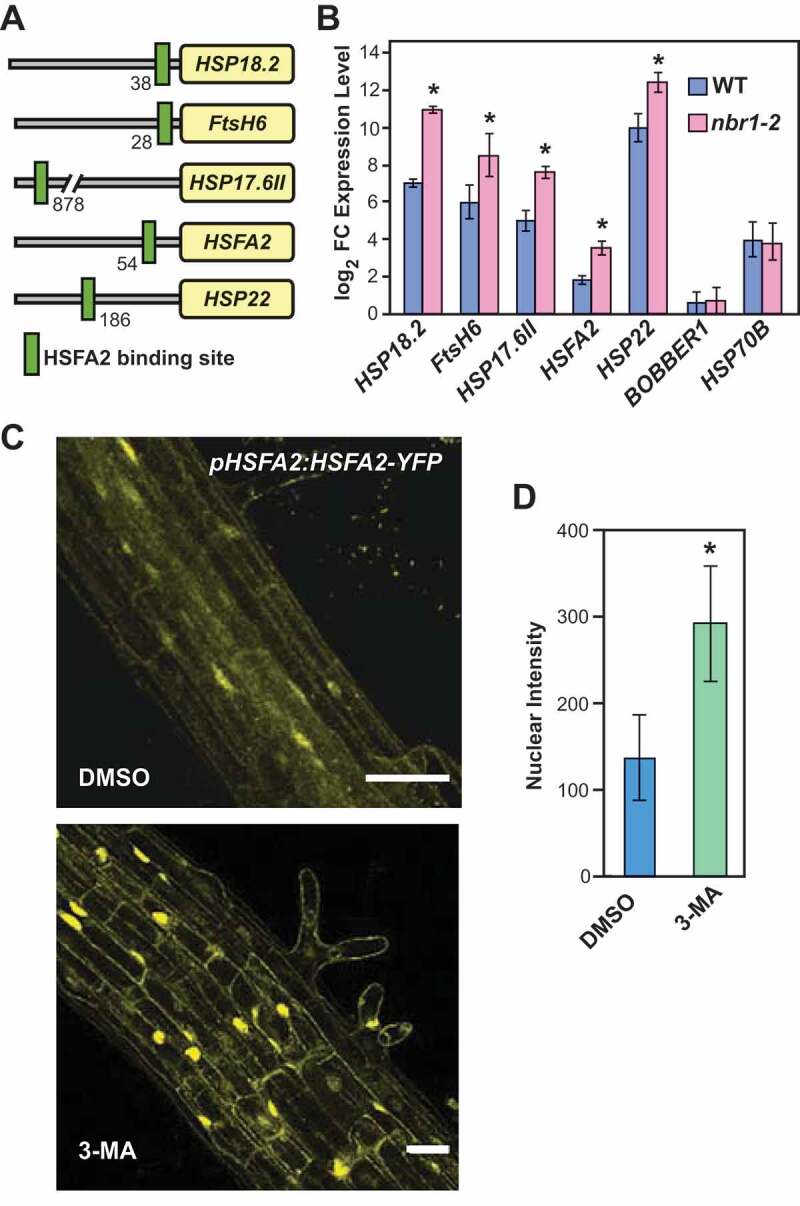
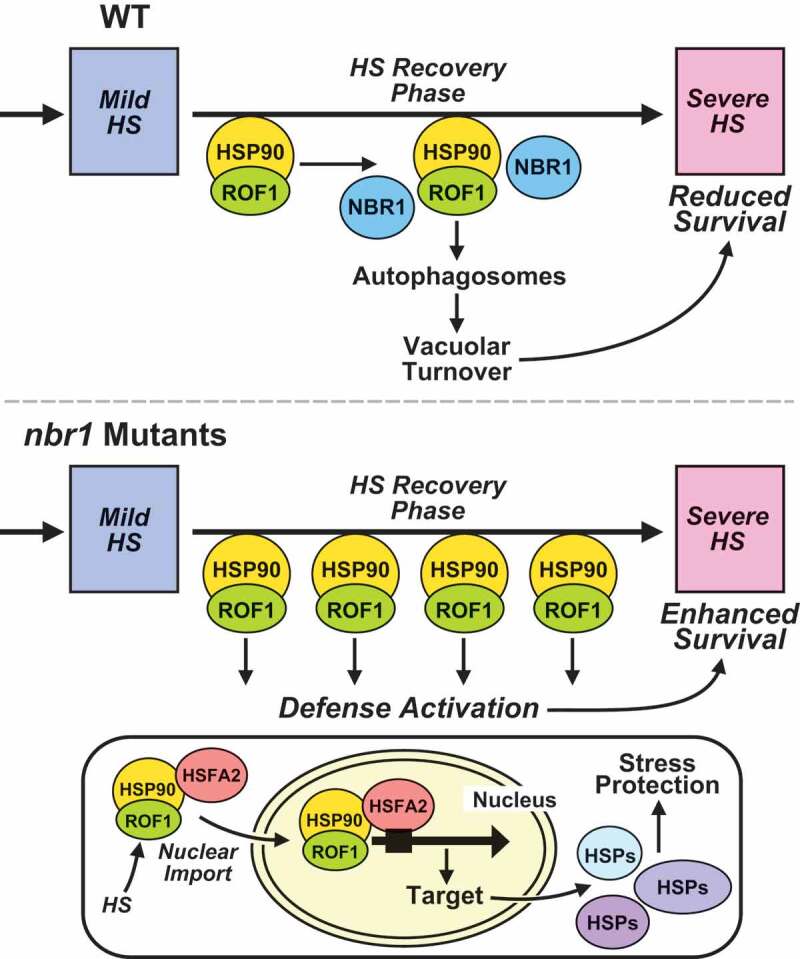
In nature, plants are constantly exposed to many transient, but recurring, stresses. Thus, to complete their life cycles, plants require a dynamic balance between capacities to recover following cessation of stress and maintenance of stress memory. Recently, we uncovered a new functional role for macroautophagy/autophagy in regulating recovery from heat stress (HS) and resetting cellular memory of HS in Arabidopsis thaliana. Here, we demonstrated that NBR1 (next to BRCA1 gene 1) plays a crucial role as a receptor for selective autophagy during recovery from HS. Immunoblot analysis and confocal microscopy revealed that levels of the NBR1 protein, NBR1-labeled puncta, and NBR1 activity are all higher during the HS recovery phase than before. Co-immunoprecipitation analysis of proteins interacting with NBR1 and comparative proteomic analysis of an nbr1-null mutant and wild-type plants identified 58 proteins as potential novel targets of NBR1. Cellular, biochemical and functional genetic studies confirmed that NBR1 interacts with HSP90.1 (heat shock protein 90.1) and ROF1 (rotamase FKBP 1), a member of the FKBP family, and mediates their degradation by autophagy, which represses the response to HS by attenuating the expression of HSP genes regulated by the HSFA2 transcription factor. Accordingly, loss-of-function mutation of NBR1 resulted in a stronger HS memory phenotype. Together, our results provide new insights into the mechanistic principles by which autophagy regulates plant response to recurrent HS.Abbreviations: AIM: Atg8-interacting motif; ATG: autophagy-related; BiFC: bimolecular fluorescence complementation; ConA: concanamycinA; CoIP: co-immunoprecipitation; DMSO: dimethyl sulfoxide; FKBP: FK506-binding protein; FBPASE: fructose 1,6-bisphosphatase; GFP: green fluorescent protein; HS: heat stress; HSF: heat shock factor; HSFA2: heat shock factor A2; HSP: heat shock protein; HSP90: heat shock protein 90; LC-MS/MS: Liquid chromatography-tandem mass spectrometry; 3-MA: 3-methyladenine; NBR1: next-to-BRCA1; PQC: protein quality control; RFP: red fluorescent protein; ROF1: rotamase FKBP1; TF: transcription factor; TUB: tubulin; UBA: ubiquitin-associated; YFP: yellow fluorescent protein.

Keywords: Arabidopsis thaliana; HSFA2; HSP90.1; NBR1; ROF1; heat stress; selective autophagy; stress memory; stress recovery.


Conflict of interest statement

The authors declare no competing financial interests.

Figures

Figure 1.
Figure 1.
NBR1 accumulates in vacuoles during recovery from heat stress and suppresses HS memory in Arabidopsis. (A) Schematic representation of heat stress (HS) regimes applied to probe HS memory. Five-day-old seedlings were subjected to a mild HS of 1.5 h at 37°C, followed by 1.5 h recovery at 22°C and then 45 min at 44°C (hereafter, priming HS). The seedlings were then returned to normal growth conditions for 3 or 4 d, in the HS recovery phase, following which they were again subjected to a severe HS at 44°C for 90 min (triggering HS). Non-heat-treated samples were used as controls. (B) Accumulation of NBR1-GFP puncta during the HS recovery phase. pNBR1:NBR1-GFP seedlings were exposed to the priming HS, then normal growth conditions at 22°C. NBR1-GFP fluorescence signals were visualized in cotyledons by fluorescence confocal microscopy 1, 2 and 3 d after cessation of the priming HS, during the recovery phase. Unprimed plants were used as controls. Plants were treated in darkness with 1 μM ConA, an inhibitor of vacuolar H+-ATPase activity and proteolytic degradation, 4 h before microscopy observation. Scale bars: 25 µm. (C) Numbers of NBR1-GFP green puncta per frame (10,000 µm2 of leaf epidermis section). Data are means ± SD (n = 6). (D) Five-day-old transgenic Arabidopsis seedlings expressing 35S:YFP-mCherry-NBR1 were subjected to the priming HS and returned to normal conditions (22°C). NBR1 vacuolar import visualized by higher fluorescence of mCherry is more stable in vacuoles than YFP in primed plants than in untreated control plants during the HS recovery phase after the priming treatment. Scale bars: 50 µm. Data are means ± SD (n = 6). (E) Quantification of NBR1 vacuolar import according to YFP:mCherry signal ratios. (F) Results of immunoblot analysis of autophagic fluxes in primed and unprimed (control) pNBR1:NBR1-GFP seedlings at indicated time points in the recovery phase. NBR1-GFP fusion protein and free GFP, detected using anti-GFP antibodies, are indicated. Relative intensities (free GFP:loading control) are shown as numerical values. Ponceau-stained RBCL was used as a loading control (bottom panel). (G) Vertical bar graphs show free-GFP:NBR1-GFP ratios of samples obtained during the HS recovery phase and in control conditions, representative scans of the immunoblots are presented above. Bars represent means (± SD) of three biological replicates. Asterisks in panels C, E, and G indicate significant (p ≤ 0.05) differences between samples of plants in control and primed conditions according to Student’s t-test. Samples were electrophoresed on the same gel. Full-size images are presented in Figure S7. (H) HS memory phenotypes of nbr1-2 and wild type (WT) seedlings. Briefly, five-day-old nbr1-2 and Col-0 WT seedlings were subjected to HS regimes, and their HS memory phenotypes were determined 14 d after triggering HS. Representative images are shown. (I) Percentages of green seedlings (as indicators of seedling survival rates) are shown in bar graphs in the right panel. Data are means ± SD (n = 4). Asterisks indicate significant (p ≤ 0.05) differences between WT and nbr1-2 plants, again according to Student’s t-test
Figure 2.
Figure 2.
NBR1 associates with autophagy during the HS memory. (A) Results of immunodetection of NBR1 during the HS recovery phase in atg5-1 and Col-0 wild-type (WT) seedlings using anti-NBR1 antibodies (Agrisera AS142805). RBCL served as the loading control (bottom panels). Relative intensities (NBR1:loading control) are shown as numerical values. Samples were electrophoresed on the same gel. (B) Expression levels (determined by qRT‐PCR) of NBR1 in WT and atg5-1 mutant seedlings at indicated time points (1, 2, 3 and 4 d) in the HS recovery phase. Values are differences between an arbitrary value of 40 and dCt, calculated as described [11]. Data are means ± SD (n = 4, where n represents independently performed experiments). (C) Colocalization of NBR1-GFP with RFP-ATG8b autophagosomes using pNBR1:NBR1-GFP and pUBQ10:RFP-ATG8b transgenic lines. Microscopy images were taken after the priming treatment during the HS recovery phase (1 d). Scale bars: 25 µm. (D) Double intensity plots of colocalizing NBR1-GFP puncta and RFP-ATG8b-labeled autophagosomes. The green and red lines represent relative intensities of NBR1-GFP and RFP-ATG8b signals, respectively. (E) Numbers of colocalizing NBR1-GFP puncta and RFP-labeled autophagosomes, per 2,000 µm2 of leaf epidermis section. Data are means ± SD (n = 3). Asterisks indicate significant (p ≤ 0.05) differences between samples of plants subjected to control and primed conditions according to Student’s t-test. (F) Qualitative results of the CoIP experiment GFP-ATG8a seedlings were subjected to priming heat stress treatment and samples were harvested 2 d into the HS recovery phase. Total proteins were extracted and immunoprecipitated with anti-GFP antibody beads. Immunoprecipitates (CoIP) obtained with anti-GFP beads and total protein extracts were immunoblotted with appropriate antisera, as indicated in the figure. Full-size images are presented in Figure S7
Figure 3.
Figure 3.
Identification of NBR1 substrate proteins during the HS recovery phase. (A) Schematic representation of the proteomic workflow with two complementary approaches to identify NBR1 substrate proteins during the HS recovery phase. (B) Venn diagram summarizing the proteins overlapping between NBR1 cargos and NBR1 interactor datasets during the HS recovery phase. Notably, there is an overlapping set of 58 proteins present in both datasets. All heat shock proteins that were associated with NBR1 are indicated by arrowheads. (C) Results of functional network analysis, visualized using Cytoscape (https://cytoscape.org/). Nodes represent putative NBR1 substrate proteins. Blue, red, green, and yellow represent translation, chaperones, metabolic enzymes, and proteolysis, respectively. (D) HSP90 co-immunoprecipitates with NBR1. pNBR1:NBR1-GFP seedlings were subjected to priming HS treatment and samples were harvested 2 d into the HS recovery phase. Total proteins were extracted and immunoprecipitated with anti-GFP antibody beads. Immunoprecipitates (IP) and total protein extracts (input) were immunoblotted with appropriate antibodies as described in the Figure. (E) ROF1 co-immunoprecipitates with NBR1. pUBQ10:ROF1-RFP and 35S:TUB-RFP (a negative control) seedlings were subjected to priming HS treatment and samples were harvested 2 d into the HS recovery phase. Total proteins were extracted and immuno-precipitated with anti-RFP antibody beads (Chromotek). Immunoprecipitates (IP) and total protein extracts (input) were immunoblotted with appropriate antisera as described in the Figure. Full-size images are presented in Figure S7
Figure 4.
Figure 4.
NBR1 targets ROF1 and HSP90 during recovery from HS. (A) NBR1-GFP and ROF1-RFP colocalized in pNBR1:NBR1-GFP/pUBQ10:ROF1-RFP transgenic lines after heat stress priming HS (2 d). Representative microscopy images 2 d after priming. Scale bars: 25 µm. (B) Numbers of colocalizing NBR1 and ROF1 puncta per frame (2,000 µm2 of leaf epidermis section), assessed by counting the white puncta (green + magenta). Data are means ± SD (n = 3). Asterisks indicate significant (p ≤ 0.05) differences between samples of plants in control and primed conditions according to Student’s t-test. Scale bars: 10 µm. (C) Intensity plots for colocalizing NBR1-GFP (green) and ROF1-RFP (red) puncta 2 d after thermopriming. (D) NBR1-GFP and HSP90.1-RFP co-localized in pNBR1:NBR1-GFP/pUBQ10:HSP90.1-RFP transgenic lines. Microscopy images were captured after the priming treatment during the HS recovery phase (2 d). Representative microscopy images after priming are shown. Scale bars: 25 µm. (E) Numbers of colocalizing NBR1 and HSP90.1 puncta, assessed by counting white puncta (green + magenta) per frame (2,000 µm2 of leaf epidermis section). Data are means ± SD (n = 3). Asterisks indicate significant (p ≤ 0.05) differences between samples of plants in control and primed conditions according to Student’s t-test. (F) Intensity plots for colocalizing NBR1-GFP (green) and HSP90.1-RFP (red) puncta 2 d after HS priming. (G) Results of BiFC with agro-infiltrated Nicotiana benthamiana leaves showing interaction in the epidermal layer between NBR1 and ROF1. cYFP and nYFP refer to C-terminal YFP fragment and N-terminal YFP fragment, respectively. Red indicates a cytosolic marker, and white boxes indicate the interaction signal. GUS-YFP was used as a negative control. Scale bars: 50 µm. (H) Results of BiFC with agro-infiltrated N. benthamiana leaves showing interaction between NBR1 and HSP90.1 in the epidermal layer. GUS-nYFP was used as a negative control. Scale bars: 20 µm. (I) Results of immunodetection of ROF1-RFP during the HS recovery phase in pUBQ10:ROF1-RFP and pUBQ10:ROF1-RFP/nbr1-2 seedlings using an anti-RFP antibody (Chromotek, 6G6; 1:1,000). Antibodies against histone H3 (αH3, detected using Abcam, ab1791; 1:5,000) was used to confirm near equal protein loading. Relative intensities (ROF1-RFP/loading control, and HSP90/loading control) are shown as numerical values. Samples were electrophoresed on the same gel. Full-size images are presented in Figure S7. (J) Results of immunodetection of HSP90.1 during the HS recovery phase in wild type (left panel) and nbr1-2 (right panel) seedlings using anti-HSP90.1 antibody (Agrisera, AS08346; 1:3,000). FBP was detected as a loading control with antibodies provided by Agrisera (AS04043; 1:5,000). Relative intensities (HSP90.1/loading control) are shown as numerical values. Samples were electrophoresed on the same gel. Full-size images are presented in Figure S7
Figure 5.
Figure 5.
Autophagy is involved in the degradation of ROF1 during HS memory. (A) GFP-ATG8a and ROF1-RFP colocalized after HS priming (1 d) in pACT:GFP-ATG8a/pUBQ10:ROF1-RFP transgenic plants (cotyledons, upper panel; roots, lower panel). Representative microscopy images are shown. Scale bars: 50 µm. (B) ROF1 co-immunoprecipitates with ATG8. pACT:GFP-ATG8a/pUBQ10:ROF1-RFP seedlings were subjected to priming HS and samples were harvested 2 d into the HS recovery phase. Total proteins were extracted and immunoprecipitated with anti-GFP antibody beads. Immunoprecipitates (IP) and total protein extracts were immunoblotted with an anti-RFP antibody (Chromotek, 6G6). (C) Higher accumulation of ROF1-RFP during the HS recovery phase (2 d after priming) upon treatment with ConA compared with a DMSO control. ROF1-RFP was detected in the seedlings of pUBQ10:ROF1-RFP/Col-0 by immunoblotting using an anti-RFP antibody (Chromotek, 6G6; 1:1,000). RBCL detected by Ponceau-staining was used as the loading control (bottom panel). Relative intensities (RFP:loading control) are shown as numerical values. Full-size images are presented in Figure S7. (D) Presence of ROF1-RFP in the central vacuole during the HS recovery phase. Accumulation of ROF1-RFP in pUBQ10:ROF1-RFP seedlings 2 d after priming HS treatment or control (unprimed) was assessed in roots (differentiation zone) by fluorescence confocal microscopy following DMSO control and ConA treatment. Scale bars: 25 µm. (E) HS memory phenotypes of rof1-2 and Col-0 wild type (WT) seedlings. Briefly, 5-d-old rof1-2 and Col-0 WT seedlings were subjected to HS regimes to explore HS memory as shown in Figure 1A. Phenotypes were determined 12 d after triggering HS. Representative images are shown. (F) Percentages of green seedlings (indicating seedling survival rates) are shown in bar graphs in the right panel. Data are means ± SD (n = 4 sets of 25 seedlings). Asterisks indicate significant (p ≤ 0.05) differences between Col-0 and rof1-2 plants according to Student’s t-test
Figure 6.
Figure 6.
NBR1 deficiency results in enhanced HSFA2 transcriptional activity. (A) Schematic presentation of the heat shock element (HSE) position in promoters of HSFA2 target genes. (B) Results of qRT-PCR expression analysis of HSFA2 and its target genes in WT and the nbr1-2 mutant. The Y-axis indicates the expression ratio (log2 fold-changes) of genes in primed (2 d into the recovery phase) compared to untreated controls. Note: the expression of HSFA2 target genes is higher in the nbr1-2 mutants than in WT. (C) Inhibition of autophagosome formation (by 3-MA treatment) induces nuclear accumulation of HSFA2. Roots (differentiation zone) of pHSFA2:HSFA2-YFP seedlings either treated with 5 mM 3-MA dissolved in DMSO or DMSO alone (as control) were visualized for the nuclear localization of HSFA2-YFP by fluorescence confocal microscopy at 2 d into HS recovery Scale bars: 50 µm. (D) The quantification of HSFA2-YFP nuclear intensities was analyzed using IMARIS (https://imaris.oxinst.com/Bitplane)
Figure 7.
Figure 7.
Model for NBR1-mediated regulation of HS memory in Arabidopsis thaliana. Proposed model for the role of NBR1-mediated selective autophagy in recovery from HS. Upper panel: Priming HS induces increases in abundance of ROF1 and HSP90.1 proteins (essential components of the HS response machinery). During recovery from HS, NBR1 markedly accumulates, interacts with ROF1 and HSP90.1, and mediates their selective degradation by autophagy. Hence, HS-responsive processes controlled by HSP90.1-ROF1 are impaired, including expression of HSFA2-target genes during the HS recovery phase and subsequently responses to the next severe HS (manifested by lower survival rates). Lower panel: Situation in nbr1-KO (nbr1-2) mutants: Lack of NBR1 results in sustained high levels of ROF1 and HSP90.1 during the HS recovery phase, and thus enhanced HSFA2 activity (manifested by higher expression of the HSFA2 target genes) during HS recovery. Taken together, lack of NBR1 results in enhanced HS memory capacity and better protection from severe post-memory heat stress

References

    1. McClung CR, Davis SJ.. Ambient thermometers in plants: from physiological outputs towards mechanisms of thermal sensing. Curr Biol. 2010;20:1086–1092. - PubMed
    1. Mittler R, Finka A, Goloubinoff P.. How do plants feel the heat? Trends Biochem Sci. 2012;37:118–125. - PubMed
    1. Bokszczanin KL. Perspectives on deciphering mechanisms underlying plant heat stress response and thermotolerance. Front Plant Sci. 2013;4:315. - PMC - PubMed
    1. Niu Y, Xiang Y. An overview of biomembrane functions in plant responses to high-temperature stress. Front Plant Sci. 2018;9:915. - PMC - PubMed
    1. Chen B, Retzlaff M, Roos T, et al. Cellular strategies of protein quality control. Cold Spring Harbor Perspect Biol. 2011;3:a004374. - PMC - PubMed

Publication types

MeSH terms