. 2020 Sep 23;21(1):40.
doi: 10.1186/s12868-020-00587-z.

Autoreceptor control of serotonin dynamics

Affiliations

Autoreceptor control of serotonin dynamics

Janet Best et al. BMC Neurosci. .

Abstract

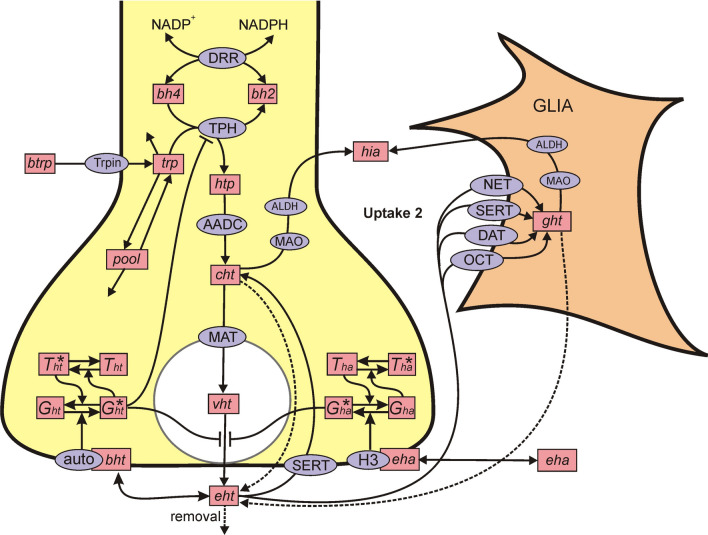
Background: Serotonin is a neurotransmitter that has been linked to a wide variety of behaviors including feeding and body-weight regulation, social hierarchies, aggression and suicidality, obsessive compulsive disorder, alcoholism, anxiety, and affective disorders. Full understanding involves genomics, neurochemistry, electrophysiology, and behavior. The scientific issues are daunting but important for human health because of the use of selective serotonin reuptake inhibitors and other pharmacological agents to treat disorders. This paper presents a new deterministic model of serotonin metabolism and a new systems population model that takes into account the large variation in enzyme and transporter expression levels, tryptophan input, and autoreceptor function.

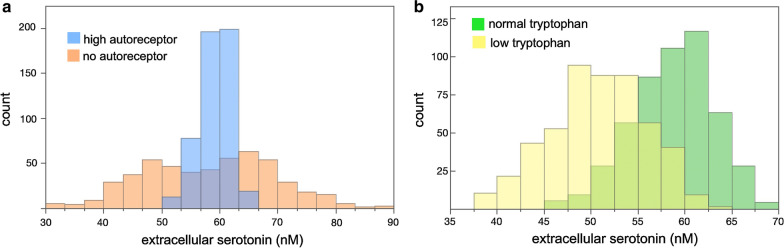
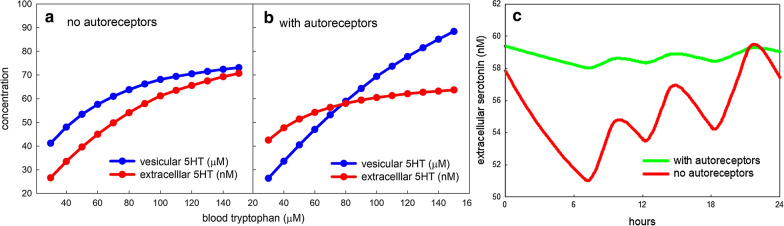
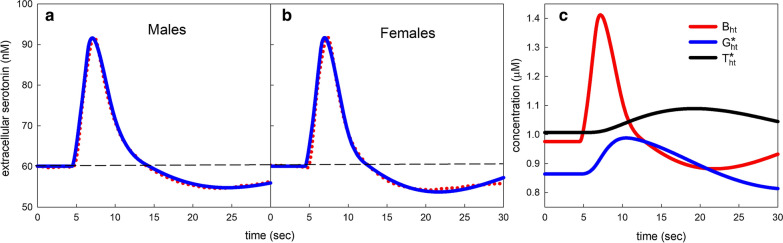
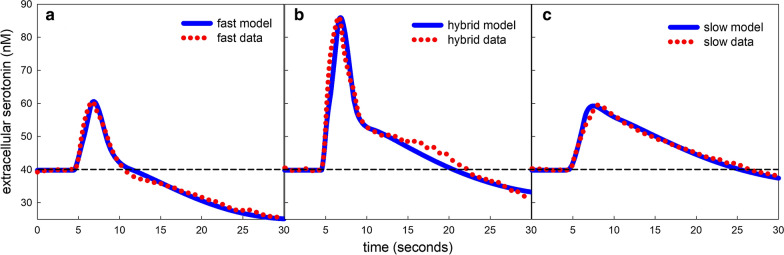
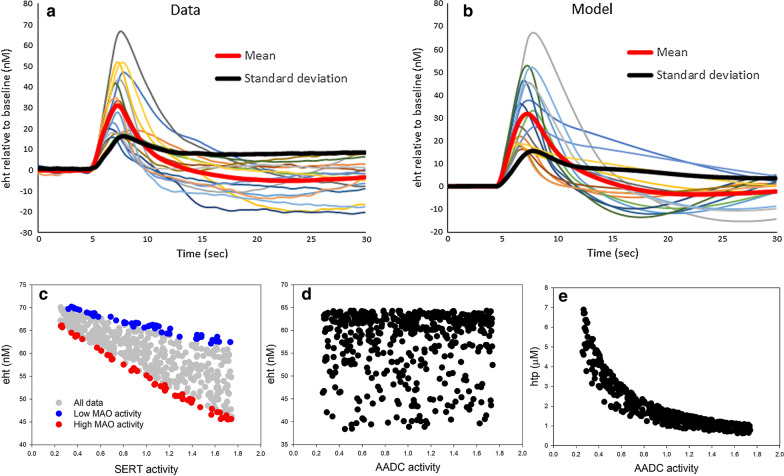
Results: We discuss the steady state of the model and the steady state distribution of extracellular serotonin under different hypotheses on the autoreceptors and we show the effect of tryptophan input on the steady state and the effect of meals. We use the deterministic model to interpret experimental data on the responses in the hippocampus of male and female mice, and to illustrate the short-time dynamics of the autoreceptors. We show there are likely two reuptake mechanisms for serotonin and that the autoreceptors have long-lasting influence and compare our results to measurements of serotonin dynamics in the substantia nigra pars reticulata. We also show how histamine affects serotonin dynamics. We examine experimental data that show very variable response curves in populations of mice and ask how much variation in parameters in the model is necessary to produce the observed variation in the data. Finally, we show how the systems population model can potentially be used to investigate specific biological and clinical questions.

Conclusions: We have shown that our new models can be used to investigate the effects of tryptophan input and meals and the behavior of experimental response curves in different brain nuclei. The systems population model incorporates individual variation and can be used to investigate clinical questions and the variation in drug efficacy. The codes for both the deterministic model and the systems population model are available from the authors and can be used by other researchers to investigate the serotonergic system.

Keywords: Autoreceptor; Mathematical model; Serotonin.


Conflict of interest statement

The authors declare that they have no competing interests.

Figures

Fig. 1
Fig. 1
Schematic diagram of the model. The figure shows the reactions in the model. The rectangular boxes indicate substrates and blue ellipses contain the acronyms of enzymes or transporters. Full names of the substrates are given in Table 1. Names of enzymes and transporters are as follows: Trpin, neutral amino acid transporter; DRR, dihydrobiopterin reductase; TPH, tryptophan hydroxylase; AADC, aromatic amino acid decarboxylase; MAT, vesicular monoamine transporter; SERT, 5-HT reuptake transporter; auto, 5-HT autoreceptors; MAO, monoamine oxidase; ALDH, aldehyde dehydrogenase; NET, norepinepherine transporter; DAT, dopamine transporter; OCT, organic cation transporter. Removal means uptake by capillaries or diffusion out of the system. The figure was created by H. F. Nijhout for this study
Fig. 2
Fig. 2
Autoreceptors effect the distribution of eht values in the systems population model. In our systems population model we varied the strength of fire(t) and the Vmax values of Trypin, TPH, AADC, MAT, MAO, Uptake 2, and SERT by 25%. a Shows the distribution of eht if there is no autoreceptor effect (pink bars) or if the autoreceptor effect is twice as strong as normal (blue bars). The green bars in b show the distribution of eht if the autoreceptor effect is “normal” (12.5 for the slope of inhib and 2.5 for the slope of inhibsyn). The green bars are similar to distributions measured in the Hashemi Lab (data not shown). The yellow bars show the distribution of eht if blood tryptophan is lowered from its normal value of 96μM to 50μM. The distribution of eht moves substantially lower
Fig. 3
Fig. 3
The effect of tryptophan input. a Shows the steady state values of vesicular serotonin, vht (blue curve), and extracellular serotonin, eht (red curve), over a range of values of blood tryptophan (96μM being normal) if the autoreceptors are turned off. b Shows the analogous curves if the autoreceptor effect is normal. The vht curve varies much more and the eht curve varies much less (for explanation, see the text). c Shows the effect of three daily meals on the extracellular concentration of eht with no autoreceptor effect (red curve) and normal autoreceptors (green curve). The autoreceptors greatly dampen the fluctuations of eht due to meals
Fig. 4
Fig. 4
Male and female responses and autoreceptor dynamics. The red dots in a, b show the experimental averages of (n = 23) male and (n = 23) female responses of extracellular serotonin, eht. The blue curves show the model simulations. Parameters for the simulations are given in Table 4 and discussed below. The dashed horizontal line is the average baseline concentration of eht in the CA2 region of the hippocampus. The male and female average responses are similar. c Shows the dynamics of the three variables, Bht,Ght,Tht of the serotonin 5HT1B autoreceptor dynamics. “See the Discussion in the text”. The experimental data is replotted from [62]
Fig. 5
Fig. 5
Fast, hybrid, and slow responses in the SNr. a, c Show simulations of fast and slow responses with experimental data taken from [7]. b Shows a simulation and previously unpublished data for a hybrid response. Red dots indicate experimental data and blue curves are model simulations. All responses were in the SNr. The dashed horizontal line is the average baseline concentration of eht in the SNr. Parameters for the simulations are shown in Table 5 and the significance of the parameters is discussed in the text
Fig. 6
Fig. 6
Investigations using the systems population model. a Shows the time courses of eht in the hippocampus of 17 male mice after 2 s of stimulation at t=5 s (Hashemi Lab). The thick red and black curves are the time courses of the mean and standard deviation, respectively. The response curve are diverse and have different heights, peaks and shapes. b Shows 17 randomly selected response curves in a systems population model of 1000 individuals with 40% independent variation in many parameters in the model (see text in “Variability in response to stimulation” section for details). The red and black curves are the time courses of the mean and the standard deviation of the 1000 model individuals, respectively. c Shows a systems population model of 500 individuals where the expression values of SERT and MAO were varied from 25 to 175% of normal and all other constants were fixed. The blue dots are individuals with low MAO activity and the red dots are individuals with high MAO activity. SSRIs have a greater effect on individuals with high MAO activity. d, e The results from a systems population model (500 individuals) where blood tryptophan and the expression level of AADC were varied from 25 to 175% of normal and all other constants were fixed. d Shows that eht is uncorrelated to AADC activity. e Shows that as AADC activity goes down htp concentration goes up so the flux through AADC remains nearly constant. This may explain why supplementation by vitamin B6 (a co-factor for AADC) is an ineffective treatment for depression

Similar articles

Cited by

References

    1. Best JA, Nijhout HF, Reed MC. Serotonin synthesis, release and reuptake in terminals: a mathematical model. Theor Biol Med Model. 2010;7:34. doi: 10.1186/1742-4682-7-34. - DOI - PMC - PubMed
    1. Best JA, Nijhout HF, Reed MC. Models of dopaminergic and serotonergic signaling. Pharmacopsychiatry. 2010;43(Supp. 1):561–566. - PubMed
    1. Best J, Oakley G, Reed M, Nijhout HF. Mathematical Models: Interactions between serotonin and dopamine in Parkinson’s disease. In: Rana AQ, editor. Etiology and Pathophysiology of Parkinson’s Disease. London: Tech; 2011.
    1. Best J, Reed M, Nijhout HF. Bursts and the efficacy of selective serotonin reuptake inhibitors. Pharmacopsychiatry (to appear); 2011. - PubMed
    1. Reed M, Nijhout HF, Best J. Mathematical insights into the effects of levodopa. Front Integrative Neurosci. 2012;6:1–24. doi: 10.3389/fnint.2012.00021. - DOI - PMC - PubMed

Publication types

LinkOut - more resources