. 2020 Sep 23;21(1):656.
doi: 10.1186/s12864-020-07072-1.

B chromosomes of multiple species have intense evolutionary dynamics and accumulated genes related to important biological processes

Affiliations

B chromosomes of multiple species have intense evolutionary dynamics and accumulated genes related to important biological processes

Syed F Ahmad et al. BMC Genomics. .

Abstract

Background: One of the biggest challenges in chromosome biology is to understand the occurrence and complex genetics of the extra, non-essential karyotype elements, commonly known as supernumerary or B chromosomes (Bs). The non-Mendelian inheritance and non-pairing abilities of B chromosomes make them an interesting model for genomics studies, thus bringing to bear different questions about their genetic composition, evolutionary survival, maintenance and functional role inside the cell. This study uncovers these phenomena in multiple species that we considered as representative organisms of both vertebrate and invertebrate models for B chromosome analysis.

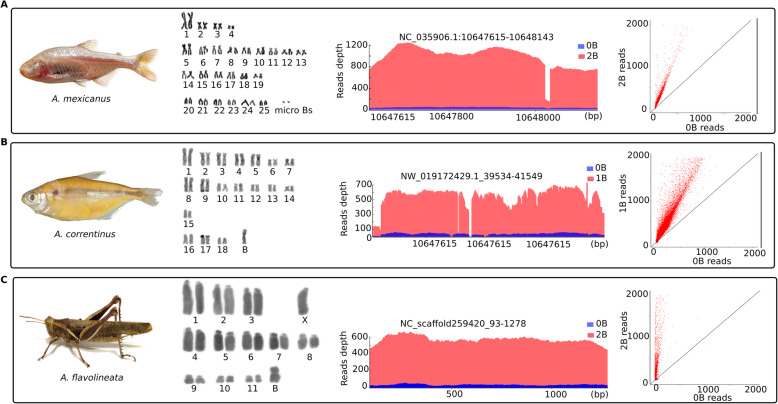
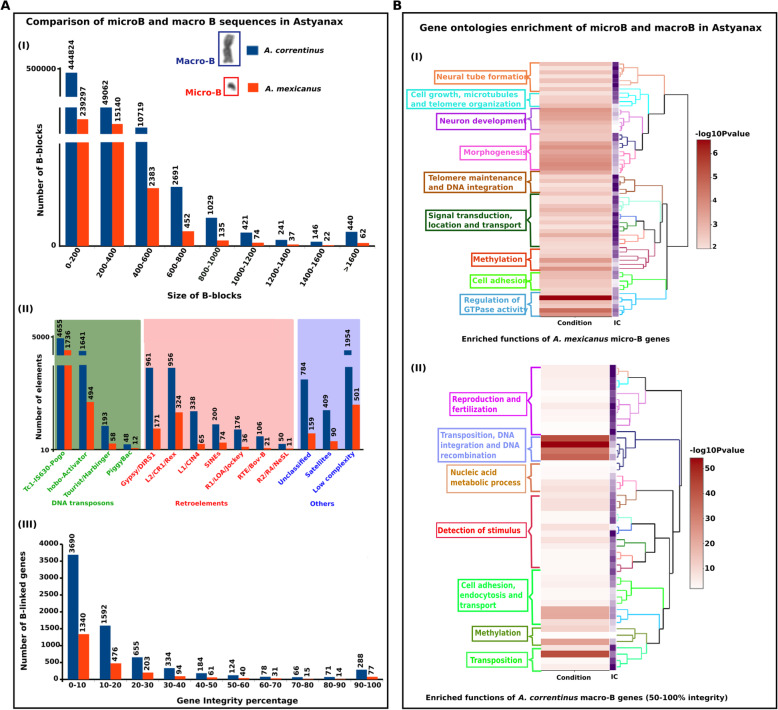
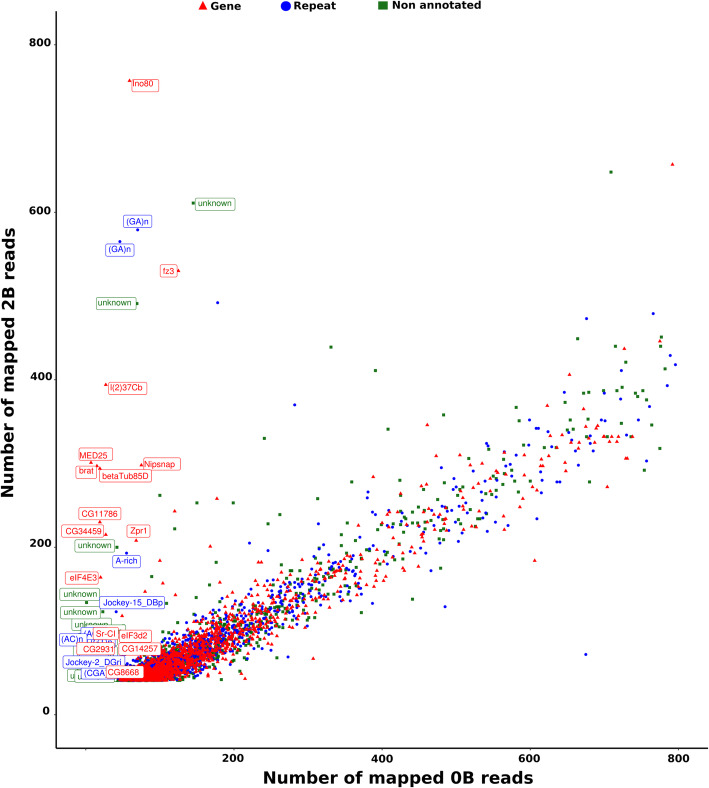
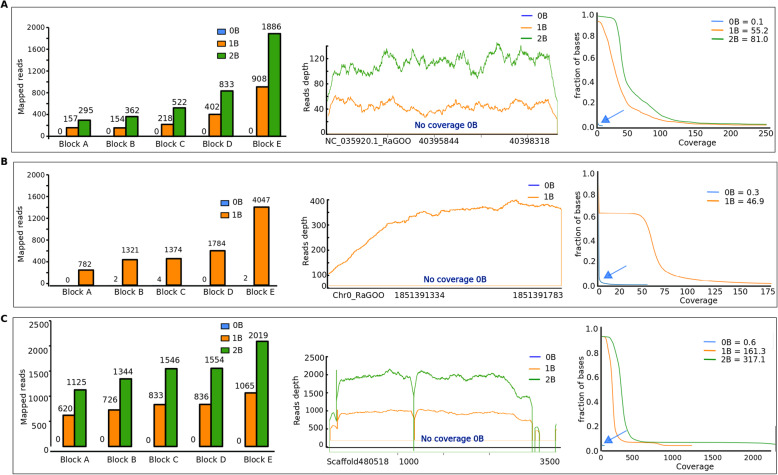
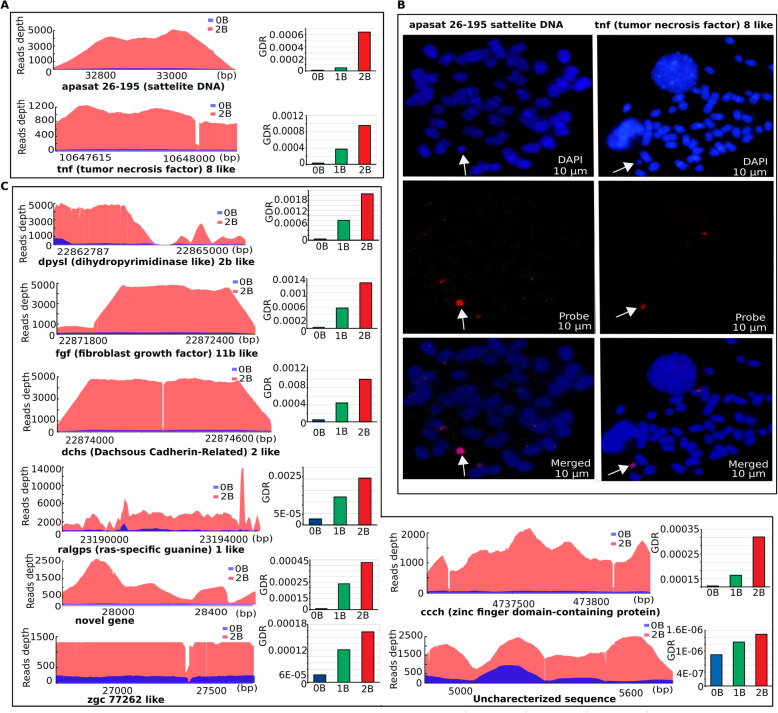
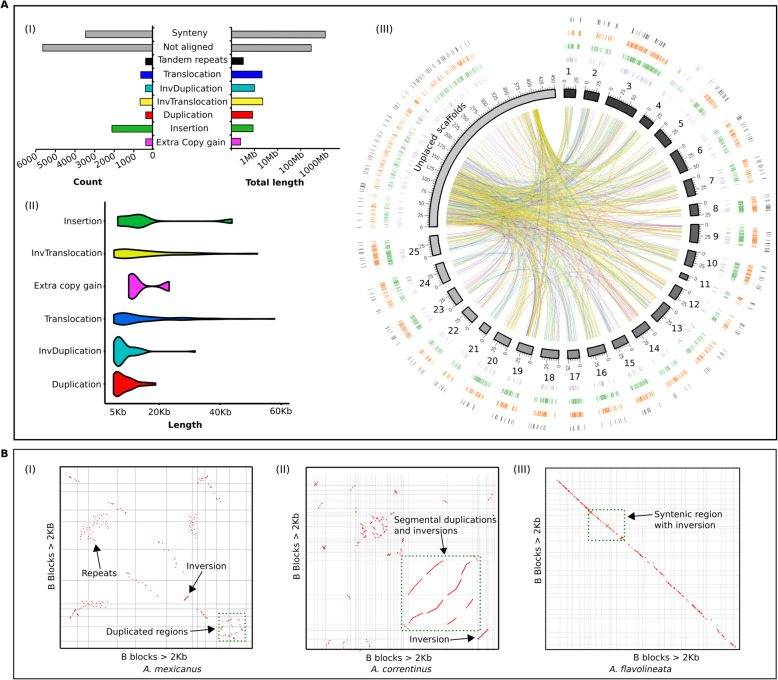
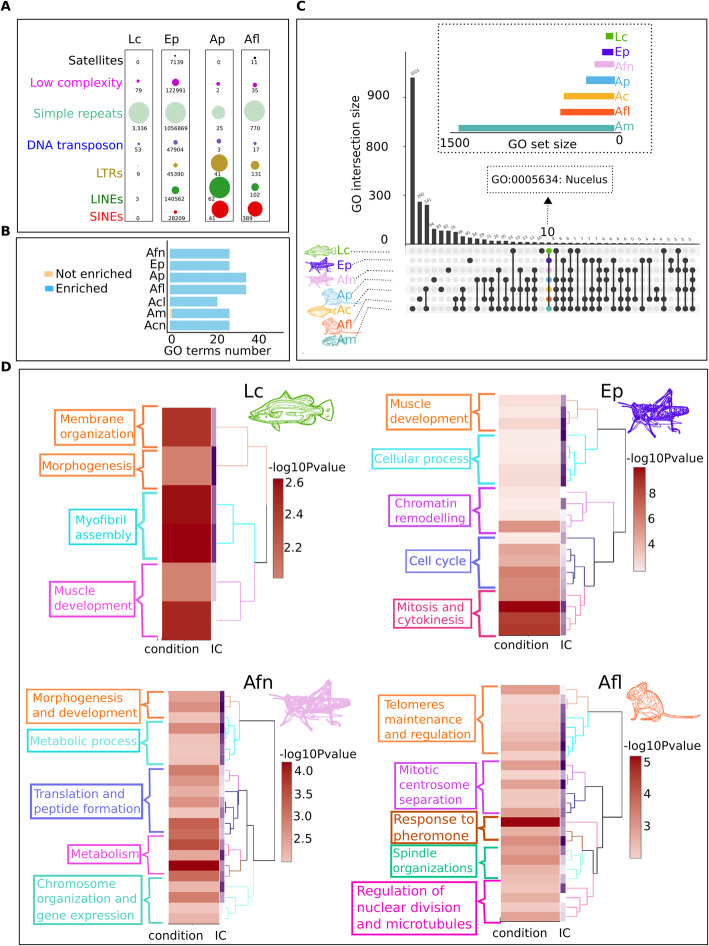
Results: We sequenced the genomes of three animal species including two fishes Astyanax mexicanus and Astyanax correntinus, and a grasshopper Abracris flavolineata, each with and without Bs, and identified their B-localized genes and repeat contents. We detected unique sequences occurring exclusively on Bs and discovered various evolutionary patterns of genomic rearrangements associated to Bs. In situ hybridization and quantitative polymerase chain reactions further validated our genomic approach confirming detection of sequences on Bs. The functional annotation of B sequences showed that the B chromosome comprises regions of gene fragments, novel genes, and intact genes, which encode a diverse set of functions related to important biological processes such as metabolism, morphogenesis, reproduction, transposition, recombination, cell cycle and chromosomes functions which might be important for their evolutionary success.

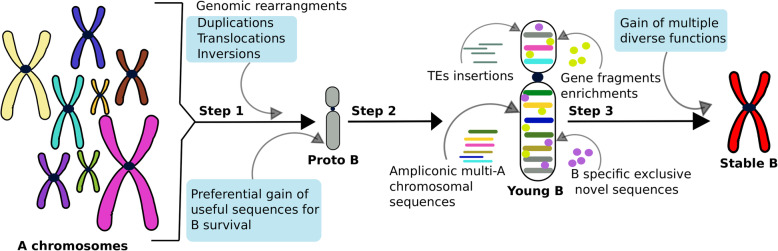
Conclusions: This study reveals the genomic structure, composition and function of Bs, which provide new insights for theories of B chromosome evolution. The selfish behavior of Bs seems to be favored by gained genes/sequences.

Keywords: Evolution; Extra chromosome; Genome; Next generation sequencing; Supernumerary chromosome.


Conflict of interest statement

The authors declare that they have no competing interests.

Figures

Fig. 1
Fig. 1
Sequenced species with B chromosomes and their karyotypes and genomic data. a A. mexicanus, b A. correntinus and c A. flavolineata. The plots are given for each corresponding species to show the comparison between B- (0B) and B+ (1B and 2B) coverage. The significant higher coverage of B+ (red peaks) as compared to B- (blue peaks) indicates the amplified genomic region on the B chromosome and extremely underrepresented sequence of this region on the A chromosomes. The X-axis and Y-axis represent read depth and genomic position of the B-block. The blocks are named according to their position in the respective genome assembly. The scatterplots provide the comparison of read abundance for the extracted blocks (upto 2000 reads) between the B- and B+ genomes. Each red dot in these plots is a single block, with X-axis and Y-axis representing the number of mapped reads for B- and B+ genomic libraries. Notice that the blocks above the diagonal lines inclining towards the Y-axis, providing evidence to the extracted B-blocks with higher reads coverage of B+ harbor extra copies of these sequences on B chromosomes
Fig. 2
Fig. 2
Characterization of genomic regions detected on the microB of A. mexicanus and macroB of A. correntinus. a (I) A comparison between B blocks number with respective blocks size range. (II) Repeat annotations of B blocks showing the abundance of diverse classes of DNA transposons on the B chromosomes. (III) Results of gene integrity analysis showing the number of genes (Y axis) in each integrity percentage group (X axis). The bar charts are scaled with breaks to normalize difference in data. b Heatmap plots and clustering visualization of GO enrichment of gene contents on microB (I) of A. mexicanus and macroB (II) of A. correntinus. The enriched functions are colored according to the dendogram of GO clusters based on the semantic similarity distance and ward.D2 criteria. The higher the -log10 P-value, the more enriched the functions. Notice the enrichment of functions associated with DNA integration, DNA recombination, transposition, cell growth, microtubules organization and telomere maintenance that might have provided transmission advantage and formation of a protoB
Fig. 3
Fig. 3
Identification of protein-coding genes located in B chromosomes of A. flavolineata using the number of mapped reads that map to the CDSs found in the transcriptome of the 0B (X axis) and 2B (Y axis). Each dot represents a coding sequence. The B-linked CDS (having log2 greater than 1.5) are highlighted with annotation labels. The plot is limited upto 800 mapped reads. The scatter plots showing B linked CDS for Astyanax are given as Supplementary Fig. S5 and S6
Fig. 4
Fig. 4
Comparative plots of the exclusive sequences detected on the Bs of (a) A. mexicanus (b) A. correntinus and (c) A. flavolineata. The bar charts (left) of five representative blocks compare the relative abundance of mapped reads for 0B (blue), 1B (orange) and 2B (green) genomes. The coverage plots (middle) as an example block for each species depicts the reads depth confirm the exclusive representation on 1B and 2B genomes. The mean coverage plots (left) of all exclusive blocks show the fraction of the genome with respective coverage. Notice the mapped reads, reads depth and mean coverage of 0B genomes in each species is negligible, thus confirming the absence of these sequences on A chromosomes and specificity to B chromosomes
Fig. 5
Fig. 5
The invasion of amplicon sequences on the micro B of A. mexicanus experimentally confirmed using qPCR and FISH. a Coverage plots of apa-sat 26–129 satellite and tnf-8 like gene along with the respective GDR qPCR results comparison between B- and B+ genomes. The higher coverage and GDR in B+ genome indicates the duplicated copies of these sequences on the B chromosome. b FISH mapping further validated these sequences and showed specific marks (red) in the micro B (white arrows). The metaphasic chromosomes are counterstained with DAPI (blue). c Coverage plots of representative B blocks on micro B with corresponding GDR of qPCR. The BLASTn alignments of these representative blocks to Ensemble annotation databases, resulted in several overlapping genes, such as tnf-8 (function: cell death), dpysl2b (function: microtubules binding activity), fgf11b (function: development, morphogenesis, mitogenic and cell survival activities), Zinc finger BED domain daysleeper like (function: chromatin remodelling), zgc:77262 (function: mRNA splicing) ralgps1 (function: cytoskeleton organization) and dchs (function: cell adhesion)
Fig. 6
Fig. 6
Comparative analyses of TE composition between A and B chromosomes. a Comparison of repeat landscapes of TEs provide insights on their evolutionary history in both A genome and the micro B and macro B of A. mexicanus and A. correntinus. The X-axis shows the percent of TEs in the genome while Y-axis represents the Kimura distances that ranged from value 0, representing recent TE copies, to 50 for the old TE insertions. Black arrows indicate the recent wave of transpositions in the genome of Astyanax genus (black arrows point to transposition waves). The higher abundance of LTRs (green) and other retroelements (blue) in the B chromosome landscapes can also be observed. Green arrows point towards the difference between abundance of A and B chromosome LTRs. b. Donut charts show the comparison of repeat composition between the As and B. The outer and inner rings depict A and B chromosomes respectively. Again, the higher percentage of LTRs and retroelements confirm their relative abundance on the B as compared to A chromosomes. Noticeably, the simple repeats percentage was higher on the Bs. c. FISH of representative elements on metaphase chromosomes of A. mexicanus and A. correntinus with B chromosomes analyzed for the organization of Tc Mariner, Gypsy and Rex elements. A dispersed pattern among diverse chromosomes, including Bs, was observed. Magnified view of B chromosomes is shown with the presence of markings of corresponding elements. The abundant signals of these TEs are indicative of their copious nature in Astyanax genome and parallel with the landscapes analyses
Fig. 7
Fig. 7
Genomic differences between the B- and B+ genomes of cavefish and B chromosome associated patterns of evolution. a (I) The bar graphs show the total number of different rearrangements and their total length in Mb in the B+ genome of A. mexicanus. (II) The violin plot depicts the length distribution of each rearranged block in the B+ genome. The distribution of rearrangements with at least 5Kb length is plotted. Refer to Supplementary Fig. S13 for distribution of smaller size rearrangements. (III) Circos plot of B+ genome visualize the different types of genomic rearrangements. Chromosomes (black to grey) are plotted from 1 to 25 with unplaced scaffolds merged as pseudo-scaffolds. The outer rings correspond to tandem repeats (black), deletions (orange), insertions (green), extra copy gains (purple). The inside links show the rearrangements as duplication (red lines), translocation (blue lines), inverted duplication (light blue) and inverted translocation (yellow). b The self syntenic dotplots of B chromosomes in A. mexicanus (I), A. correntinus, (II) and A. flavolineata (III) are annotated with different evolutionary events indicated with arrows and green dotted boxes. The dotplot graphics are visualized as filtered “legacy version” whereas the raw images are given as Supplementary Figs. S15, S16, S17
Fig. 8
Fig. 8
Gene ontology enrichments and comparison of B chromosome functions across all seven species analyzed including the micro dissected sequences (Supplementary dataset 7). a Repeat contents comparison of analyzed micro dissected B chromosomes from diverse species. The bubble charts have been merged for all Bs showing the type of content in different colors. Each bubble is a repeat type while each bar indicates a species. The differences between repeats abundance among species suggest that amount of these elements in Bs is subject to their abundance in A genome dependent of species. For example, the Bs of mouse species (B4, B5 and B5) have acquired a higher amount of retrotransposons SINEs, LINEs and LTRs as depicted by yellow, green and red bubbles and lack abundance of satellite DNA. While on other hand, grasshopper Bs (B3) gained a considerable amount of satellite DNA apart from the domination of simple repeats and other elements. b Bar chart show the number of enriched and not enriched functions on the Bs of each species after the Fisher exact test. c Upset plot represent the comparison of GO among the Bs of all organisms analyzed in this study. A total of 10 GO are shared across all studied species (Table S4). An arrow points to an important GO term “nucleus” that is common among all Bs. The Y-axis corresponds to GO intersection size while X-axis represents the unique and shared GO terms. d Enrichment clustering heatmap plots are given for the micro dissected Bs as well as high confident genes (log2 ratio > 2) detected on the B of A. flavolineata. The abbreviation Lc, Ep, Afn, Ap, Afl, Ac, Am refers to L. calcarifer, E. plorans, A. flavolineata, A. peninsulae, A. flavicollis, A. correntinus and A. mexicanus respectively
Fig. 9
Fig. 9
A schematic view of B chromosome evolution. During the first step, a proto-B is derived from multi-A sequences as a result of genomic rearrangements. The proto-B gains the sequences from A genome for its survival and successful transmission. In the second step, the proto-B accumulates further sequences with a series of TE insertions, ampliconic sequences, gene like fragments and the formation of unique sequences that are specific to the B. Finally, a mature B evolves, providing extra genomic material which may contains genes for diverse functions

Comment in

References

    1. Longley AE. Supernumerary chromosomes in Zea mays. J Agric Res. 1927;35:769–784.
    1. Ahmad S, Martins C. The modern view of B chromosomes under the impact of high scale omics analyses. Cells. 2019;8:156. doi: 10.3390/cells8020156. - DOI - PMC - PubMed
    1. Wilson EB. Studies on chromosomes. V. the chromosomes of metapodius. A contribution to the hypothesis of the genetic continuity of chromosomes. J Exp Zool. 1909;6:147–205. doi: 10.1002/jez.1400060202. - DOI
    1. Camacho JPM. B chromosomes. In: Gregory TR, editor. The evolution of the genome. 2005. pp. 223–286.
    1. D’Ambrosio U, Alonso-Lifante MP, Barros K, Kovařík A, Mas de Xaxars G, Garcia S. B-chrom: A database on B-chromosomes of plants, animals and fungi. New Phytol. 2017;216:635–642. doi: 10.1111/nph.14723. - DOI - PubMed

LinkOut - more resources