

Modelling and predicting the spatio-temporal spread of cOVID-19 in Italy
- PMID: 32967639
- PMCID: PMC7509829
- DOI: 10.1186/s12879-020-05415-7
Modelling and predicting the spatio-temporal spread of cOVID-19 in Italy
Abstract
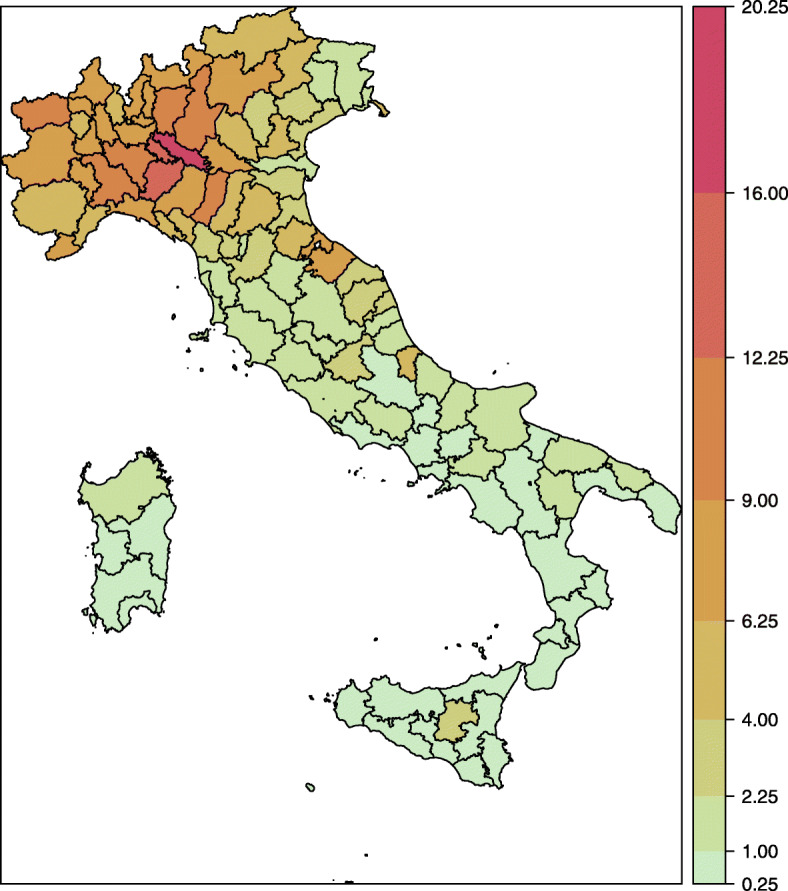
Background: The Severe Acute Respiratory Syndrome Coronavirus 2 (SARS-CoV-2) was first detected in China at the end of 2019 and it has since spread in few months all over the World. Italy was one of the first Western countries who faced the health emergency and is one of the countries most severely affected by the pandemic. The diffusion of Coronavirus disease 2019 (COVID-19) in Italy has followed a peculiar spatial pattern, however the attention of the scientific community has so far focussed almost exclusively on the prediction of the evolution of the disease over time.
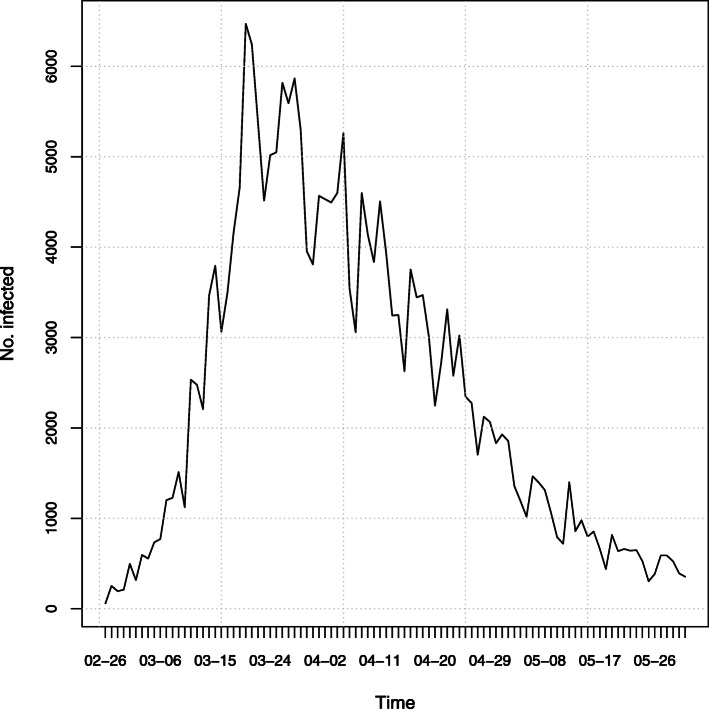
Methods: Official freely available data about the number of infected at the finest possible level of spatial areal aggregation (Italian provinces) are used to model the spatio-temporal distribution of COVID-19 infections at local level. An endemic-epidemic time-series mixed-effects generalized linear model for areal disease counts has been implemented to understand and predict spatio-temporal diffusion of the phenomenon.
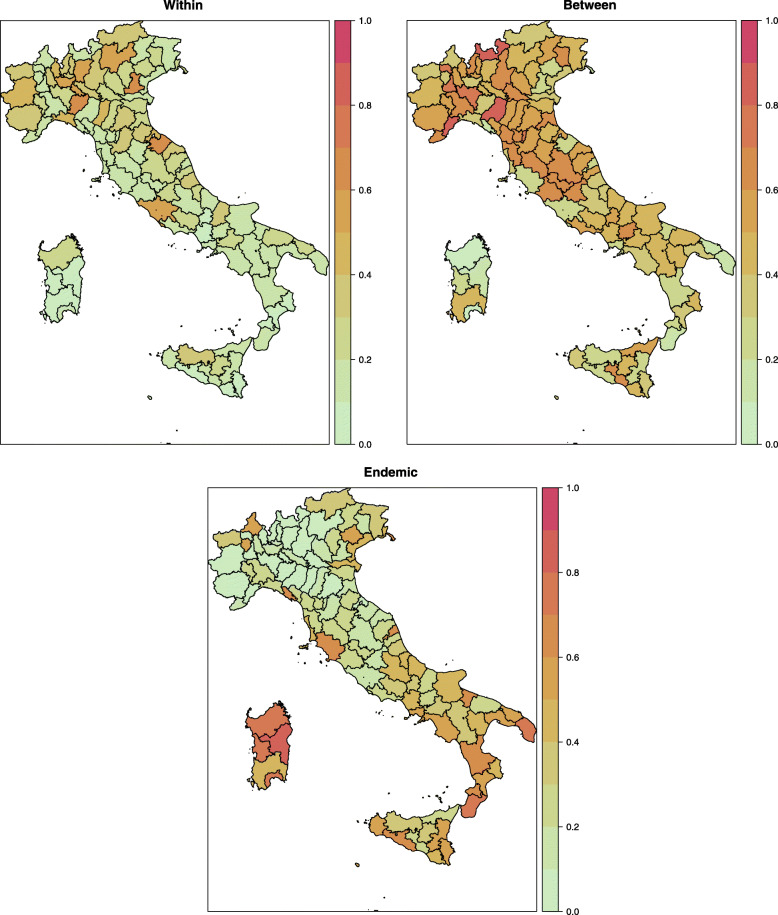
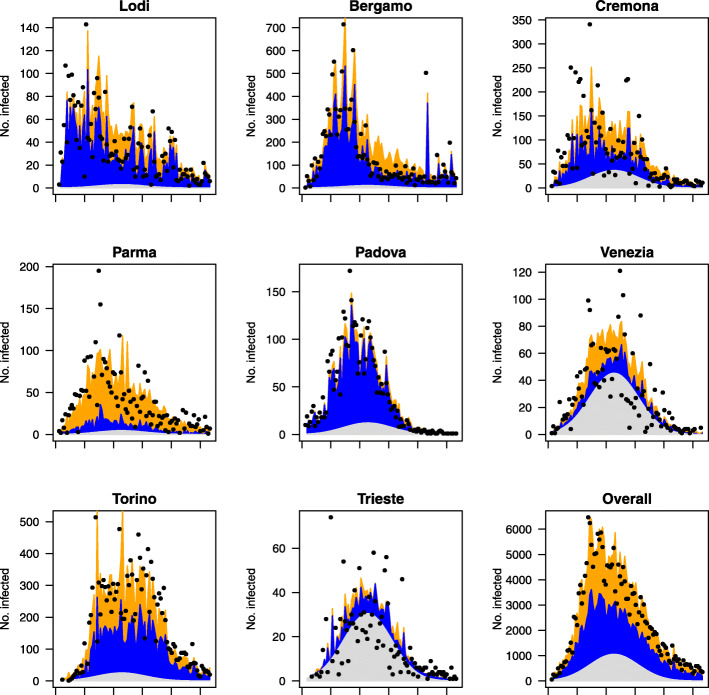
Results: Three subcomponents characterize the fitted model. The first describes the transmission of the illness within provinces; the second accounts for the transmission between nearby provinces; the third is related to the evolution of the disease over time. At the local level, the provinces first concerned by containment measures are those that are not affected by the effects of spatial neighbours. On the other hand, the component accounting for the spatial interaction with surrounding areas is prevalent for provinces that are strongly involved by contagions. Moreover, the proposed model provides good forecasts for the number of infections at local level while controlling for delayed reporting.
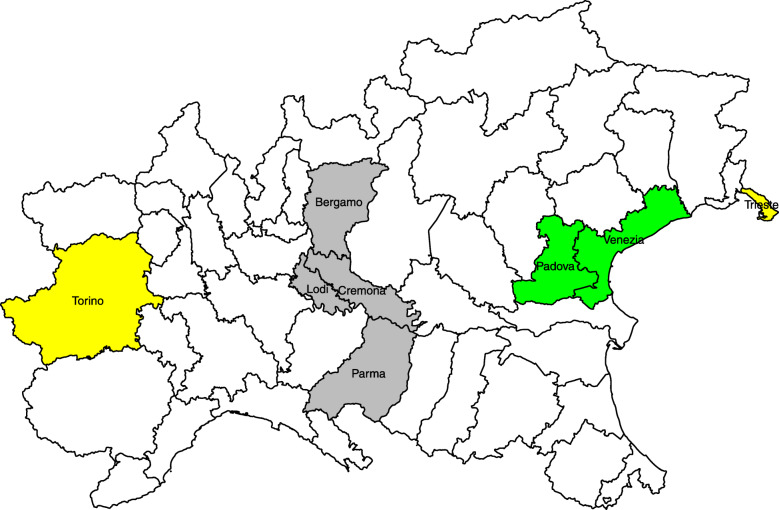
Conclusions: A strong evidence is found that strict control measures implemented in some provinces efficiently break contagions and limit the spread to nearby areas. While containment policies may potentially be more effective if planned considering the peculiarities of local territories, the effective and homogeneous enforcement of control measures at national level is needed to prevent the disease control being delayed or missed as a whole. This may also apply at international level where, as it is for the European Union or the United States, the internal border checks among states have largely been abolished.
Keywords: COVID-19; Italy; Spatio-temporal model.
Conflict of interest statement
The authors declare that they have no competing interests.
Figures
References
-
- Presidenza del Consiglio dei Ministri – Dipartimento della Protezione Civile:COVID-19. GitHub. 2020. https://github.com/pcm-dpc/COVID-19.
MeSH terms
LinkOut - more resources
Full Text Sources
Miscellaneous
