. 2020 Sep 23;6(39):eabc5447.
doi: 10.1126/sciadv.abc5447. Print 2020 Sep.

Notch signaling protects CD4 T cells from STING-mediated apoptosis during acute systemic inflammation

Affiliations

Notch signaling protects CD4 T cells from STING-mediated apoptosis during acute systemic inflammation

Junke Long et al. Sci Adv. .

Abstract

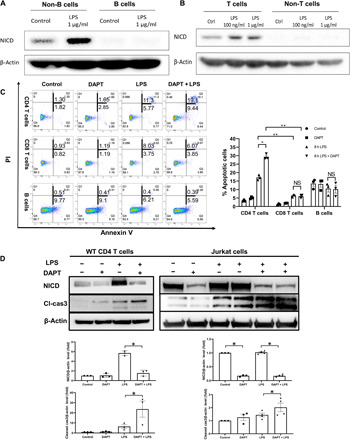
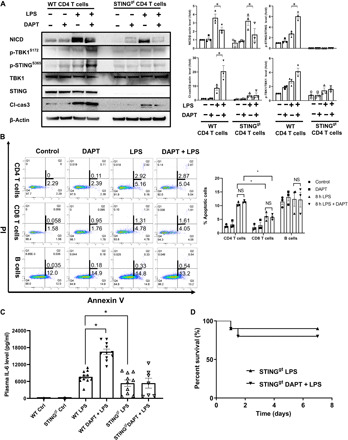
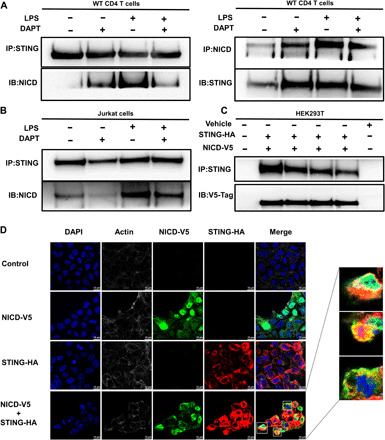
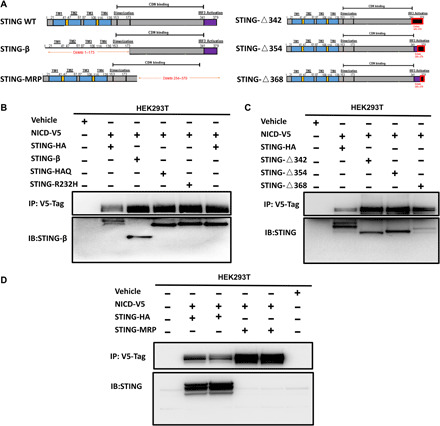
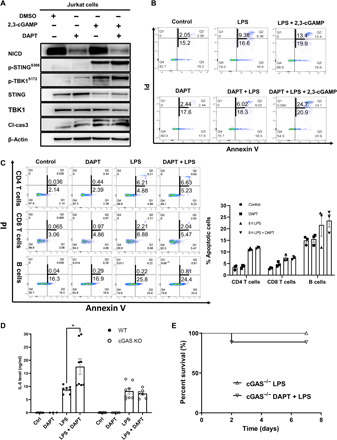
Dysregulation of T cell apoptosis contributes to the pathogenesis of acute systemic inflammation-induced immunosuppression, as seen in sepsis and trauma. However, the regulatory mechanisms of T cell apoptosis are unclear. Activation of stimulator of interferon genes (STING) has been shown to induce T cell apoptosis. Notch was previously identified as the top negative regulator of STING in macrophages through a kinase inhibitor library screening. However, how Notch signaling regulates STING activation in T cells is unknown. Here, using a γ-secretase inhibitor to block Notch signaling, we found that Notch protected CD4 T cells from STING-mediated apoptosis during endotoxemia. Mechanistically, Notch intracellular domain (NICD) interacted with STING at the cyclic dinucleotide (CDN) binding domain and competed with CDN to inhibit STING activation. In conclusion, our data reveal a previously unidentified role of Notch in negative regulation of STING-mediated apoptosis in CD4 T cells.


Figures

Fig. 1
Fig. 1. Inhibition of Notch enhances mortality, inflammation, and apoptosis during endotoxemia.
(A to C) WT mice were administrated LPS [5 mg/kg, intraperitoneally (ip)] with or without DAPT before treatment (100 mg/kg, 3 hours before LPS injection). (A) Representative Western blots and quantification for NICD, HES1, and cleaved caspase-3 (Cl-cas3) in splenocyte from WT mice at indicated time points after LPS ± DAPT treatment. GAPDH, glyceraldehyde-3-phosphate dehydrogenase. (B) Representative images of TMR red staining in spleen from WT mice at 8 hours after LPS ± DAPT treatment. Arrows indicate representative TUNEL-positive nuclei (red). Percentage of TMR+ nuclei number/total nuclei number was quantified. n = 4 per group. Scale bars, 50 μm. (C and D) Plasma levels of IL-1α and HMGB1 were detected by ELISA. Data are from two or three separate experiments. Symbols represent individual mouse. Data are mean ± SEM; statistical difference was tested using one-way ANOVA with Tukey’s correction; *P < 0.05 and **P < 0.01. (E) Seven-day survival. WT mice were administrated LPS (10 mg/kg, ip) with or without DAPT before treatment (100 mg/kg, 3 hours before LPS injection). n = 30 in LPS group; n = 28 in LPS + DAPT group. Data are from three separate experiments. Statistical difference was tested using the log-rank test; *P < 0.05.
Fig. 2
Fig. 2. Notch signaling protects splenic CD4 T cells from apoptosis during endotoxemia.
(A and B) Splenocytes were isolated from WT mice and treated with LPS ex vivo for 8 hours. (A) Representative Western blot for NICD expression in splenic B cells (CD19+ cells) versus non-B cells (CD19 cells) stimulated with LPS (1 μg/ml). (B) Representative Western blots of NICD expression in splenic T cells (CD3+) and non-T cells (CD3) challenged with LPS (1 μg/ml or 100 ng/ml). (C) WT mice were administrated LPS (5 mg/kg, ip) with or without DAPT before treatment (100 mg/kg, 3 hours before LPS injection). Spleens were collected at 8 hours after LPS ± DAPT treatment. Percentage of early (annexin V+/PI) and late (annexin V+/PI+) apoptotic cells was measured by flow cytometry. Data are from three separate experiments. Symbols represent individual mouse. Data are mean ± SEM. *P < 0.05 and **P < 0.01. NS, not significant. (D) Representative Western blots of NICD and cleaved caspase-3 expression in splenic CD4 T cells from WT and Jurkat cells at 8 hours after LPS (5 mg/kg or 1 μg/ml) ± DAPT (100 mg/kg or 10 μM, 3 hours before LPS injection) treatment. Data are from three separate experiments. Symbols represent individual mouse. Data are mean ± SEM. Statistical difference was tested using one-way ANOVA with Tukey’s correction; *P < 0.05.
Fig. 3
Fig. 3. Notch activation protects CD4 T from STING-mediated apoptosis during endotoxemia.
(A to C) WT and Stinggt mice were administrated LPS (5 mg/kg, ip) with or without DAPT before treatment (100 mg/kg, 3 hours before LPS injection). Spleens were collected at 8 hours after LPS ± DAPT treatment. (A) Representative Western blots of NICD, p-TBK1S172, p-STINGs365, TBK1, STING, and cleaved caspase-3 level in splenic CD4 T cells from indicated mice. Data are from three separate experiments. Symbols represent individual mouse. Data are mean ± SEM. *P < 0.05. (B) Percentage of early (annexin V+/PI) and late (annexin V+/PI+) apoptotic cells was measured by flow cytometry in splenic CD4 T cells, CD8 T cells, and B cells from Stinggt mice after indicated treatments. (C) Plasma IL-6 level was determined by ELISA. Data are from two separate experiments. Symbols represent individual mouse. Data are mean ± SEM. Statistical difference was tested using one-way ANOVA with Tukey’s correction; *P < 0.05. (D) Seven-day survival. WT (Fig. 1E) and Stinggt mice were administrated LPS (10 mg/kg, ip) ± DAPT before treatment (100 mg/kg, 3 hours before LPS injection). n = 12 in Stinggt-LPS group; n = 12 in Stinggt-LPS + DAPT group. Data are from two separate experiments. Statistical difference was tested using the log-rank test.
Fig. 4
Fig. 4. NICD interacts with STING in the cytoplasm of CD4 T cells.
(A) WT mice were administrated LPS (5 mg/kg, ip) ± DAPT before treatment (100 mg/kg, 3 hours before LPS injection). Spleens were collected at 8 hours after LPS ± DAPT treatment. Splenic CD4 T cells were isolated, lysed, and immunoprecipitated with the rabbit anti-STING or rabbit anti-NICD antibody. The level of NICD (left) or STING (right) in immunoprecipitants was analyzed by Western blotting. (B) Jurkat cells were treated with LPS (1 μg/ml) ± DAPT (10 μM, 3 hours before LPS challenge). Cells were lysed and immunoprecipitated with the rabbit anti-STING antibody, and the level of NICD in immunoprecipitants was analyzed by Western blotting. (C and D) NICD-V5 plasmid (1000 ng) was cotransfected with STING-HA (1000 ng) plasmid into HEK293T cells for 48 hours. (C) Cells were lysed and immunoprecipitated with the rabbit anti-STING antibody. The level of transfected NICD-V5 in immunoprecipitants was analyzed by Western blotting. (D) Immunofluorescence staining for V5 tag (green), HA (red), actin (white), and nuclei (blue). The right panel indicates representative colocalization of V5 and HA (yellow). Data are from two separate experiments.
Fig. 5
Fig. 5. NICD interacts with STING at the CBD.
(A) Structure of STING-WT, STING-β, STING-MRP, STING-△342, STING-△354, and STING-△368. (B) NICD-V5 plasmid (1000 ng) was cotransfected with STING-HA (WT) (1000 ng) plasmid, STING-β plasmid (1000 ng), STING-HAQ plasmid (1000 ng), or STING-R232H plasmid (1000 ng) into HEK293T cells. After 48 hours, coimmunoprecipitation was carried out with rabbit anti-V5 Tag antibody. Immunoprecipitates were analyzed by Western blotting with rabbit anti-STING antibody. (C) NICD-V5 plasmid (1000 ng) plus STING-△342 (1000 ng) or NICD-V5 plasmid (1000 ng) plus STING-△354 (1000 ng) plasmids or NICD-V5 plasmid (1000 ng) plus STING-△368 (1000 ng) plasmids were cotransfected into HEK293T cells. Cells were harvested and lysed after 48 hours. Immunoprecipitation was carried out with rabbit anti-V5 antibody. Immunoprecipitates were probed with rabbit anti-STING antibody. (D) NICD-V5 plasmid (1000 ng) was cotransfected with STING-HA (1000 ng) plasmid or STING-MRP plasmid (1000 ng) into HEK293T cells. After 48 hours, cells were harvested and lysed. Coimmunoprecipitation was carried out with rabbit anti-V5 antibody. Immunoprecipitates were analyzed by Western blotting with rabbit anti-STING middle region antibody. Results in each panel are representative of three independent experiments.
Fig. 6
Fig. 6. NICD competes with cGAMP for the CDN-binding site at STING.
(A) Representative Western blots of NICD, p-STINGs366, STING, p-TBK1s172, TBK1, and cleaved caspase-3 in 2,3-cGAMP–treated (2.5 mg/ml) Jurkat cells ± DAPT before treatment (10 μM, 3 hours before 2,3-cGAMP treatment). (B) Splenic CD4 T cells were isolated from cGAS−/− mice; cells were treated with LPS (100 ng/ml) ± 2,3-cGAMP (2.5 mg/ml) or DAPT (10 μM, 3 hours before LPS ± 2,3-cGAMP challenge). Percentage of early (annexin V+/PI) and late (annexin V+/PI+) apoptotic cells was measured by flow cytometry at 8 hours after indicated treatments. (C and D) cGAS−/− mice were administrated LPS (5 mg/kg, ip) ± DAPT before treatment (100 mg/kg, 3 hours before LPS injection). Spleens were collected at 8 hours after LPS ± DAPT treatment. Percentage of early and late apoptotic cells was measured by flow cytometry in splenic CD4 T cells, CD8 T cells, and B cells from cGAS−/− mice after indicated treatments. (D) Plasma IL-6 level was determined by ELISA in WT versus cGAS−/− mice at 8 hours after indicated treatments. Data are from two separate experiments. Symbols represent individual mouse. Data are mean ± SEM. Statistical difference was tested using one-way ANOVA with Tukey’s correction; *P < 0.05. (E) Seven-day survival. WT (Fig. 1E) and cGAS−/− mice were administrated LPS (10 mg/kg, ip) with or without DAPT before treatment (100 mg/kg, 3 hours before LPS injection). n = 12 in cGAS−/− LPS group; n = 12 in cGAS−/− LPS + DAPT group. Data are from two separate experiments. Statistical difference was tested using the log-rank test.

Similar articles

Cited by

References

    1. Delano M. J., Ward P. A., Sepsis-induced immune dysfunction: Can immune therapies reduce mortality? J. Clin. Invest. 126, 23–31 (2016). - PMC - PubMed
    1. Hotchkiss R. S., Nicholson D. W., Apoptosis and caspases regulate death and inflammation in sepsis. Nat. Rev. Immunol. 6, 813–822 (2006). - PubMed
    1. Boomer J. S., To K., Chang K. C., Takasu O., Osborne D. F., Walton A. H., Bricker T. L., Jarman S. D. II, Kreisel D., Krupnick A. S., Srivastava A., Swanson P. E., Green J. M., Hotchkiss R. S., Immunosuppression in patients who die of sepsis and multiple organ failure. JAMA 306, 2594–2605 (2011). - PMC - PubMed
    1. Cabrera-Perez J., Condotta S. A., Badovinac V. P., Griffith T. S., Impact of sepsis on CD4 T cell immunity. J. Leukoc. Biol. 96, 767–777 (2014). - PMC - PubMed
    1. Appel B., Givan L. A., Eisen J. S., Delta-Notch signaling and lateral inhibition in zebrafish spinal cord development. BMC Dev. Biol. 1, 13 (2001). - PMC - PubMed

Substances