Meta-Analysis
. 2020 Sep 23:370:m3324.
doi: 10.1136/bmj.m3324.

Central fatness and risk of all cause mortality: systematic review and dose-response meta-analysis of 72 prospective cohort studies

Affiliations
Meta-Analysis

Central fatness and risk of all cause mortality: systematic review and dose-response meta-analysis of 72 prospective cohort studies

Ahmad Jayedi et al. BMJ. .

Abstract

Objective: To quantify the association of indices of central obesity, including waist circumference, hip circumference, thigh circumference, waist-to-hip ratio, waist-to-height ratio, waist-to-thigh ratio, body adiposity index, and A body shape index, with the risk of all cause mortality in the general population, and to clarify the shape of the dose-response relations.

Design: Systematic review and meta-analysis.

Data sources: PubMed and Scopus from inception to July 2019, and the reference lists of all related articles and reviews.

Eligibility criteria for selecting studies: Prospective cohort studies reporting the risk estimates of all cause mortality across at least three categories of indices of central fatness. Studies that reported continuous estimation of the associations were also included.

Data synthesis: A random effects dose-response meta-analysis was conducted to assess linear trend estimations. A one stage linear mixed effects meta-analysis was used for estimating dose-response curves.

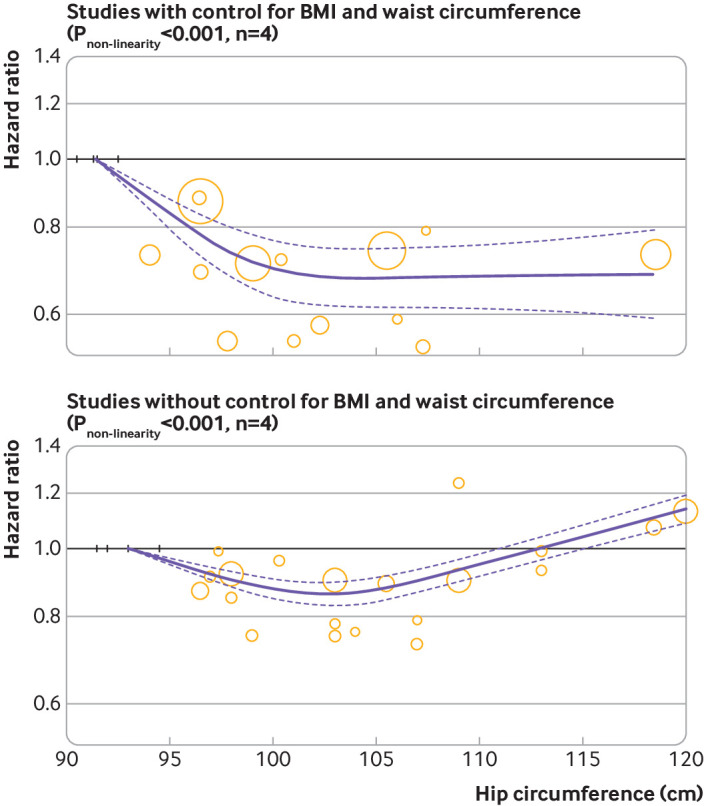
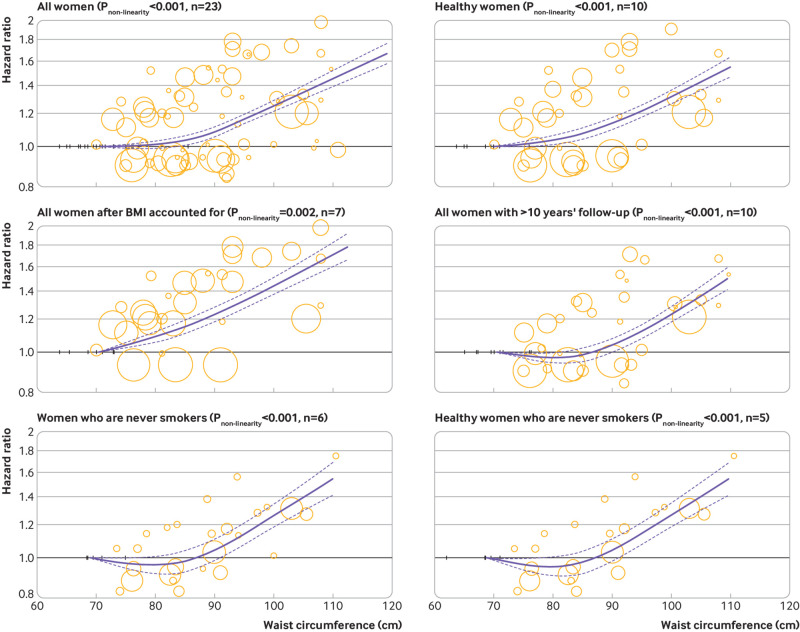
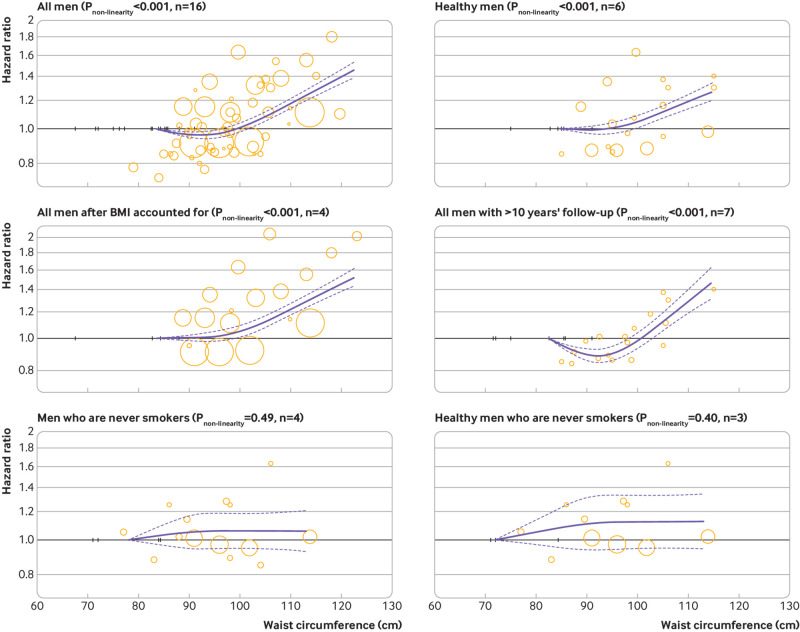
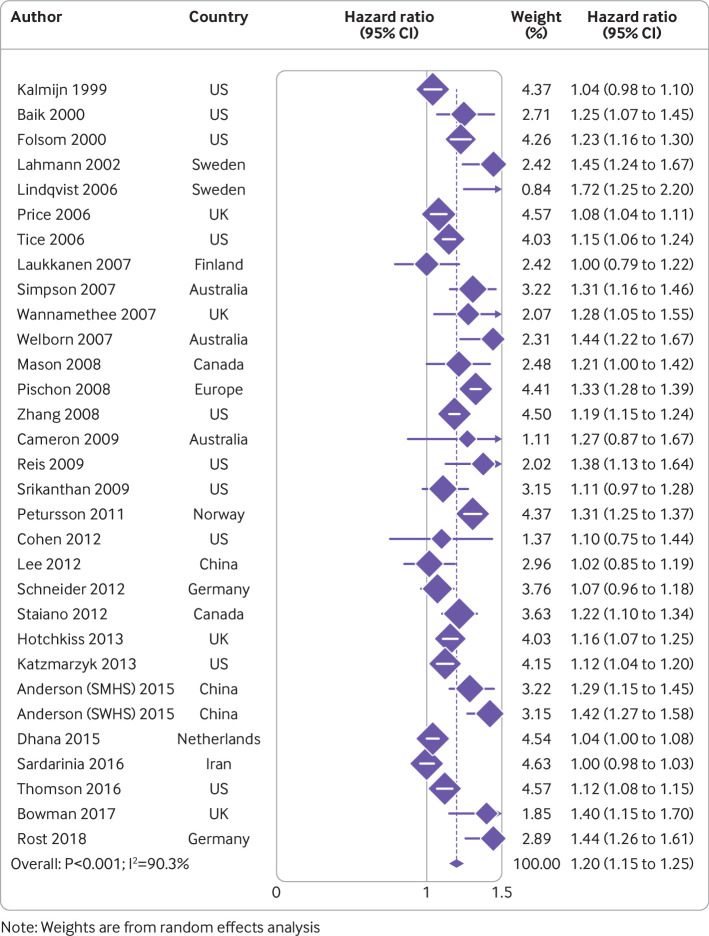
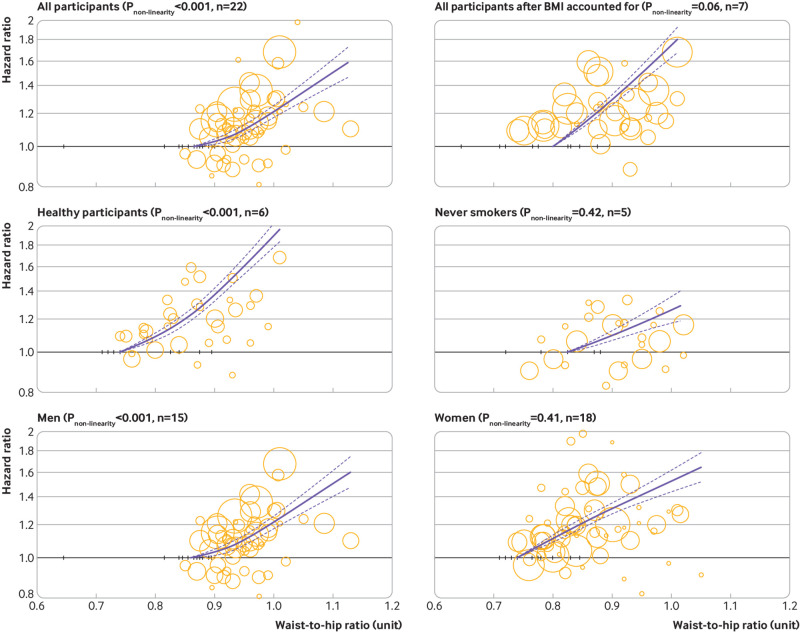
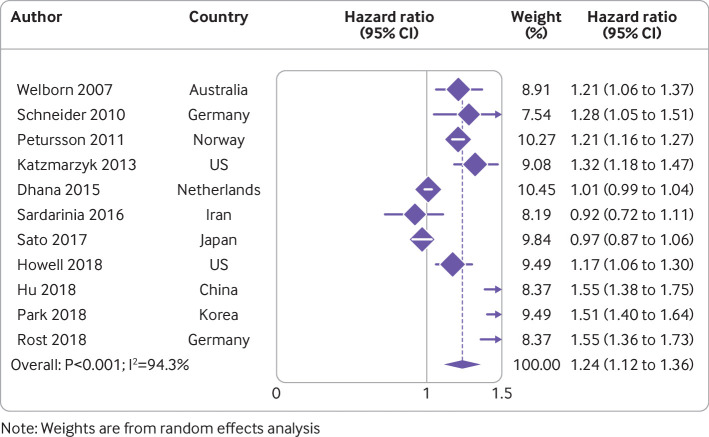
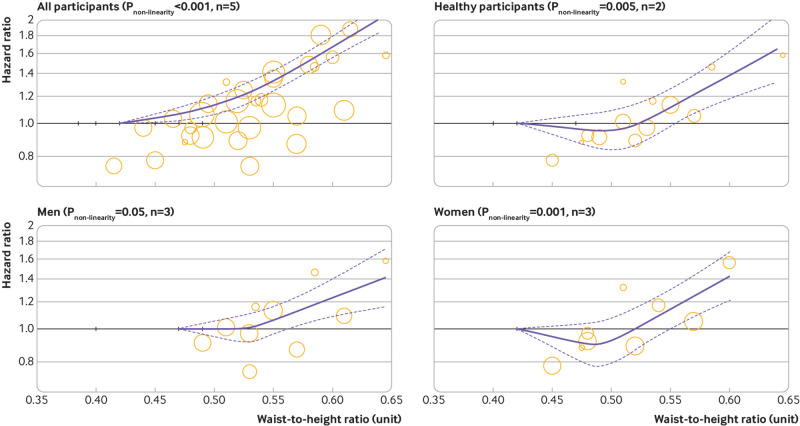
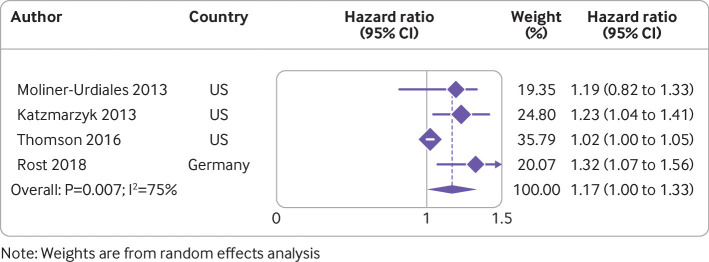
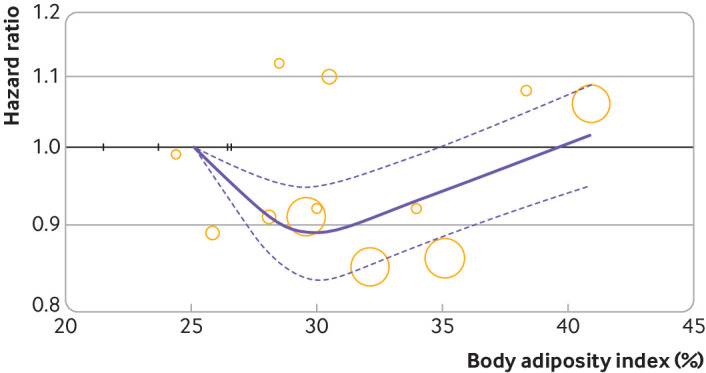
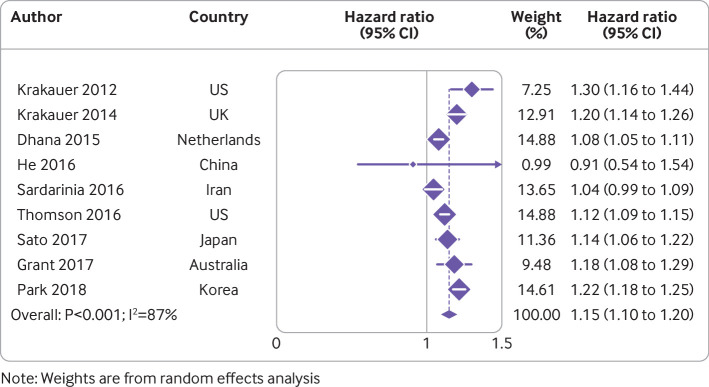
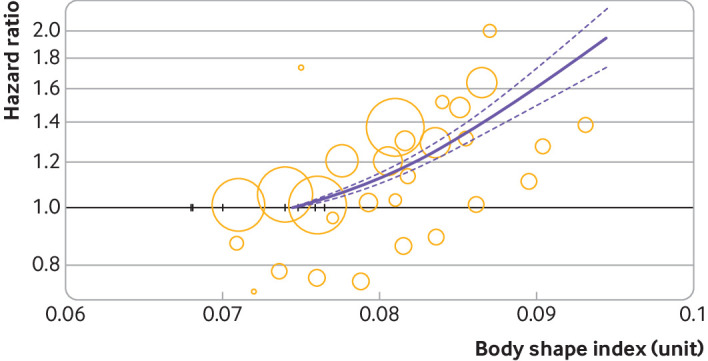
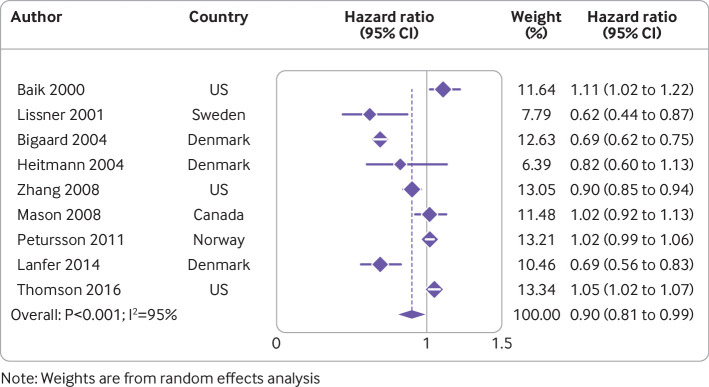
Results: Of 98 745 studies screened, 1950 full texts were fully reviewed for eligibility. The final analyses consisted of 72 prospective cohort studies with 2 528 297 participants. The summary hazard ratios were as follows: waist circumference (10 cm, 3.94 inch increase): 1.11 (95% confidence interval 1.08 to 1.13, I2=88%, n=50); hip circumference (10 cm, 3.94 inch increase): 0.90 (0.81 to 0.99, I2=95%, n=9); thigh circumference (5 cm, 1.97 inch increase): 0.82 (0.75 to 0.89, I2=54%, n=3); waist-to-hip ratio (0.1 unit increase): 1.20 (1.15 to 1.25, I2=90%, n=31); waist-to-height ratio (0.1 unit increase): 1.24 (1.12 to 1.36, I2=94%, n=11); waist-to-thigh ratio (0.1 unit increase): 1.21 (1.03 to 1.39, I2=97%, n=2); body adiposity index (10% increase): 1.17 (1.00 to 1.33, I2=75%, n=4); and A body shape index (0.005 unit increase): 1.15 (1.10 to 1.20, I2=87%, n=9). Positive associations persisted after accounting for body mass index. A nearly J shaped association was found between waist circumference and waist-to-height ratio and the risk of all cause mortality in men and women. A positive monotonic association was observed for waist-to-hip ratio and A body shape index. The association was U shaped for body adiposity index.

Conclusions: Indices of central fatness including waist circumference, waist-to-hip ratio, waist-to-height ratio, waist-to-thigh ratio, body adiposity index, and A body shape index, independent of overall adiposity, were positively and significantly associated with a higher all cause mortality risk. Larger hip circumference and thigh circumference were associated with a lower risk. The results suggest that measures of central adiposity could be used with body mass index as a supplementary approach to determine the risk of premature death.


Conflict of interest statement

Competing interests: All authors have completed the ICMJE uniform disclosure form at www.icmje.org/coi_disclosure.pdf and declare: no support from any organisation for the submitted work; no financial relationships with any organisations that might have an interest in the submitted work in the previous three years; no other relationships or activities that could appear to have influenced the submitted work; TAK reports grants from Canadian Institutes of Health Research, grants from International Life Sciences Institute, grants from National Honey Board, personal fees from Calorie Control Council, outside the submitted work.

Figures

Fig 1
Fig 1
Summary hazard ratio of all cause mortality for a 10 cm increment in waist circumference
Fig 2
Fig 2
Dose-response association of waist circumference with risk of all cause mortality in women. Solid line represents non-linear dose response and dotted lines represent 95% confidence interval. Circles represent hazard ratio point estimates for adiposity categories from each study with circle size proportional to inverse of standard error. Small vertical black lines represent baseline adiposity category for each separate study
Fig 3
Fig 3
Dose-response association of waist circumference with risk of all cause mortality in men. Solid line represents non-linear dose response and dotted lines represent 95% confidence interval. Circles represent hazard ratio point estimates for adiposity categories from each study with circle size proportional to inverse of standard error. Small vertical black lines represent baseline adiposity category for each separate study
Fig 4
Fig 4
Summary hazard ratio of all cause mortality for 0.1 unit increment in waist-to-hip ratio. SMHS=Shanghai men’s health study; SWHS=Shanghai women’s health study
Fig 5
Fig 5
Dose-response association of waist-to-hip ratio with risk of all cause mortality. Solid line represents non-linear dose response and dotted lines represent 95% confidence interval. Circles represent hazard ratio point estimates for adiposity categories from each study with circle size proportional to inverse of standard error. Small vertical black lines represent baseline adiposity category for each separate study
Fig 6
Fig 6
Summary hazard ratio of all cause mortality for 0.1 unit increment in waist-to-height ratio
Fig 7
Fig 7
Dose-response association of waist-to-height ratio with risk of all-cause mortality. Solid line represents non-linear dose response and dotted lines represent 95% confidence interval. Circles represent hazard ratio point estimates for adiposity categories from each study with circle size proportional to inverse of standard error. Small vertical black lines represent baseline adiposity category for each separate study
Fig 8
Fig 8
Summary hazard ratio of all cause mortality for 10% increment in body adiposity index
Fig 9
Fig 9
Dose-response association of body adiposity index with the risk of all cause mortality (Pnon-linearity<0.001, n=4). Solid line represents the non-linear dose response and dotted lines represent 95% confidence interval. Circles represent the hazard ratio point estimates for adiposity categories from each study with circle size proportional to inverse of standard error. Small vertical black lines represent baseline adiposity category for each separate study
Fig 10
Fig 10
Summary hazard ratio of all cause mortality for 0.005 unit increment in A body shape index
Fig 11
Fig 11
Dose-response association of A body shape index with risk of all cause mortality (Pnon-linearity<0.001, n=6). Solid line represents non-linear dose response and dotted lines represent 95% confidence interval. Circles represent the hazard ratio point estimates for adiposity categories from each study with circle size proportional to inverse of standard error. Small vertical black lines represent baseline adiposity category for each separate study
Fig 12
Fig 12
Summary hazard ratio of all cause mortality for 10 cm increment in hip circumference
Fig 13
Fig 13
Dose-response association of hip circumference with risk of all cause mortality. Solid line represents non-linear dose response and dotted lines represent 95% confidence interval. Circles represent hazard ratio point estimates for adiposity categories from each study with circle size proportional to inverse of standard error. Small vertical black lines represent baseline adiposity category for each separate study

Comment in

References

    1. Aune D, Sen A, Prasad M, et al. BMI and all cause mortality: systematic review and non-linear dose-response meta-analysis of 230 cohort studies with 3.74 million deaths among 30.3 million participants. BMJ 2016;353:i2156. 10.1136/bmj.i2156 - DOI - PMC - PubMed
    1. Di Angelantonio E, Bhupathiraju ShN, Wormser D, et al. Global BMI Mortality Collaboration Body-mass index and all-cause mortality: individual-participant-data meta-analysis of 239 prospective studies in four continents. Lancet 2016;388:776-86. 10.1016/S0140-6736(16)30175-1 - DOI - PMC - PubMed
    1. Kok P, Seidell JC, Meinders AE. [The value and limitations of the body mass index (BMI) in the assessment of the health risks of overweight and obesity]. Ned Tijdschr Geneeskd 2004;148:2379-82. - PubMed
    1. Després J-P. Body fat distribution and risk of cardiovascular disease: an update. Circulation 2012;126:1301-13. 10.1161/CIRCULATIONAHA.111.067264 - DOI - PubMed
    1. Ashwell M, Gunn P, Gibson S. Waist-to-height ratio is a better screening tool than waist circumference and BMI for adult cardiometabolic risk factors: systematic review and meta-analysis. Obes Rev 2012;13:275-86. 10.1111/j.1467-789X.2011.00952.x - DOI - PubMed

LinkOut - more resources