. 2020 Dec;10(12):1968-1987.
doi: 10.1158/2159-8290.CD-20-0461. Epub 2020 Sep 23.

H3.3 G34W Promotes Growth and Impedes Differentiation of Osteoblast-Like Mesenchymal Progenitors in Giant Cell Tumor of Bone

Affiliations

H3.3 G34W Promotes Growth and Impedes Differentiation of Osteoblast-Like Mesenchymal Progenitors in Giant Cell Tumor of Bone

Sima Khazaei et al. Cancer Discov. 2020 Dec.

Abstract

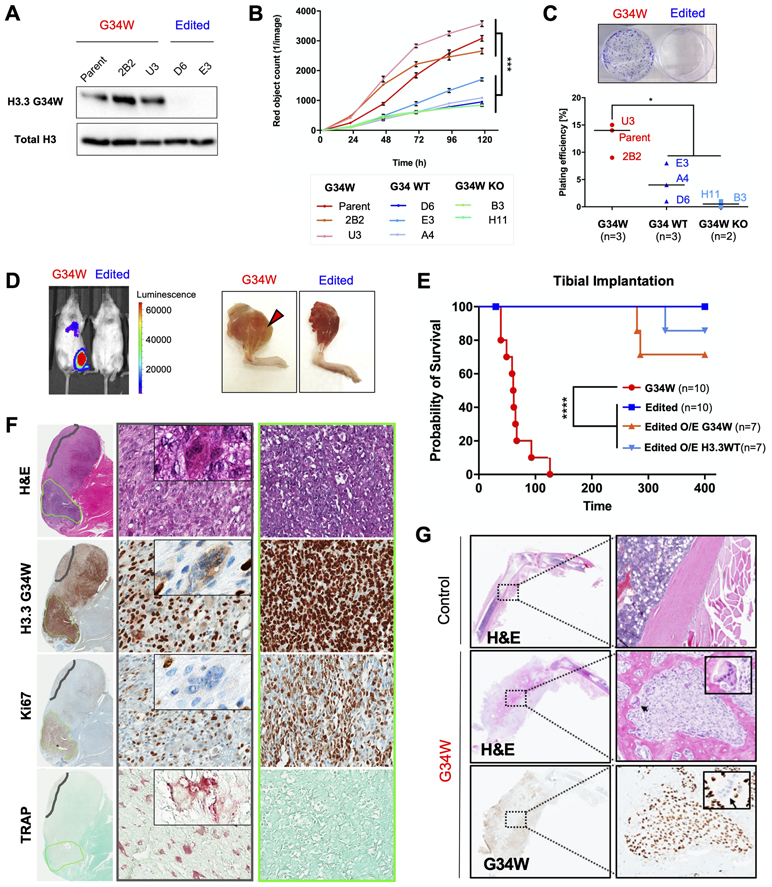
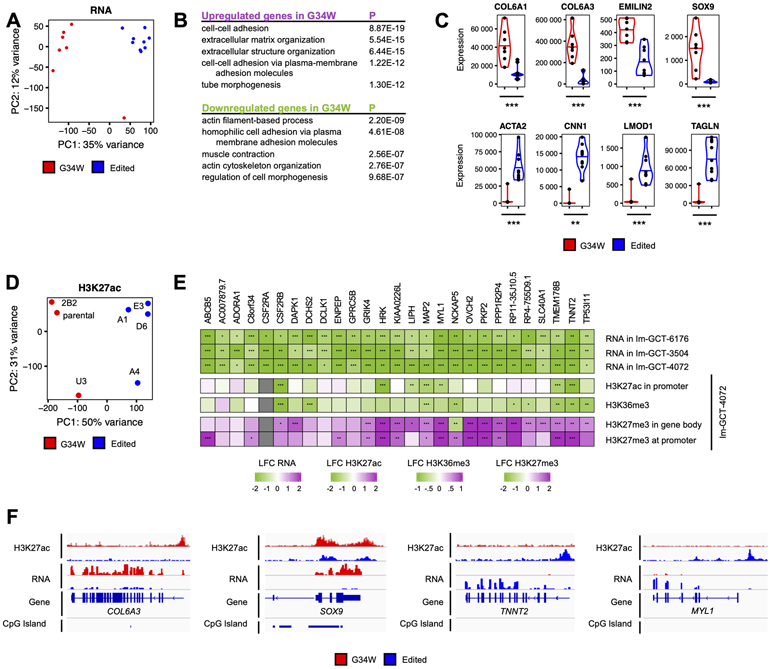
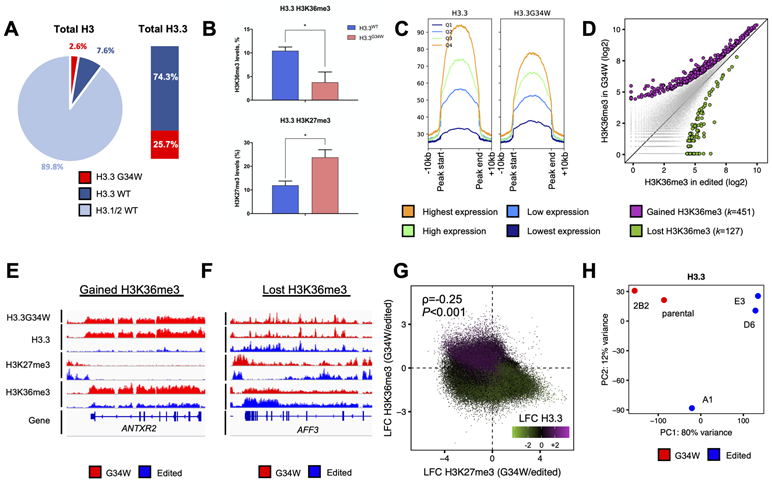
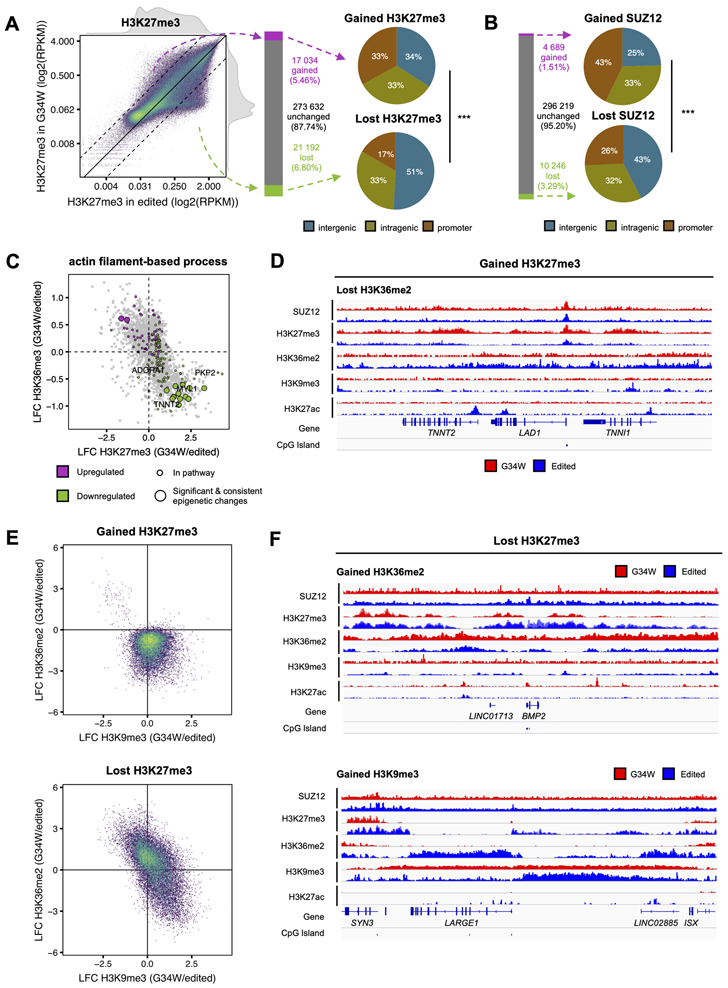
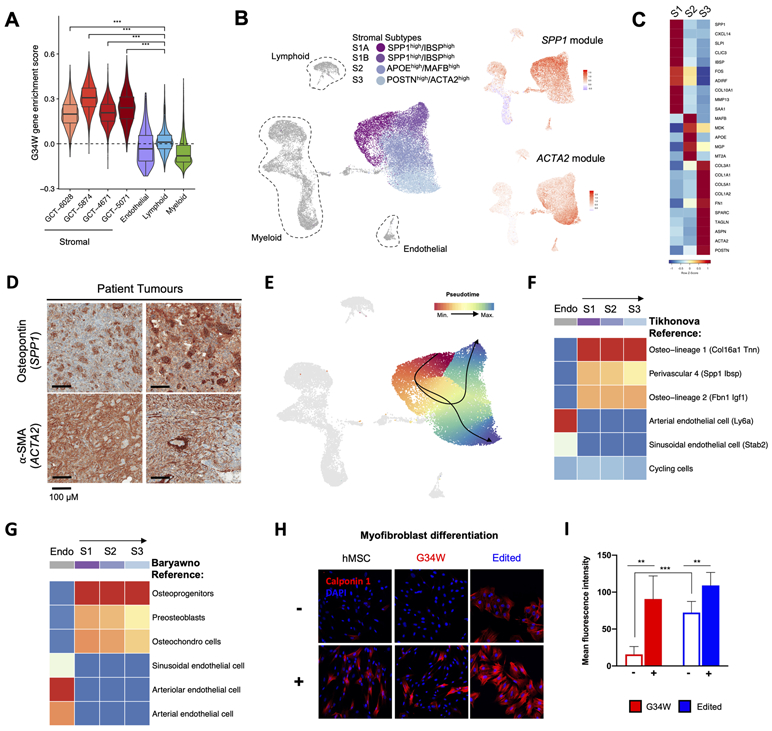
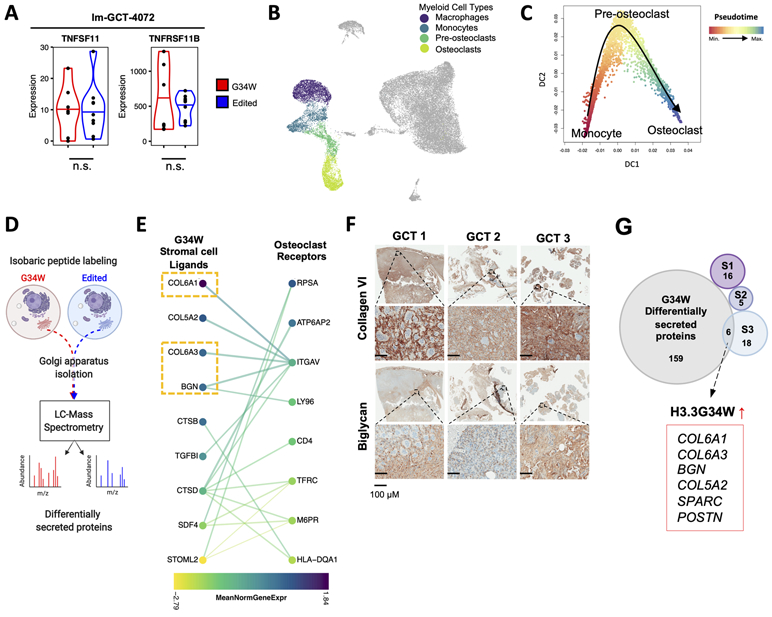
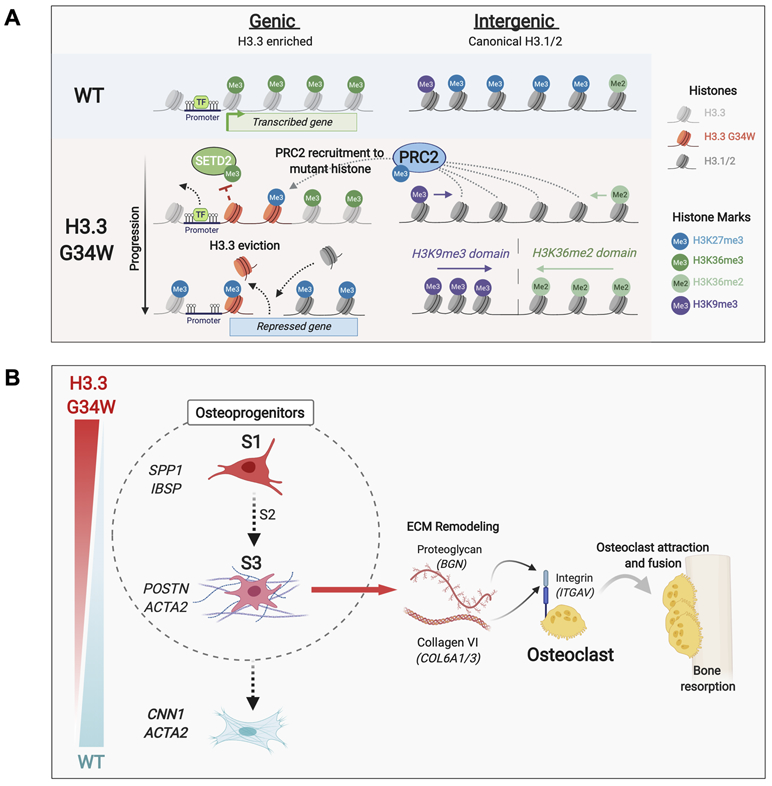
Glycine 34-to-tryptophan (G34W) substitutions in H3.3 arise in approximately 90% of giant cell tumor of bone (GCT). Here, we show H3.3 G34W is necessary for tumor formation. By profiling the epigenome, transcriptome, and secreted proteome of patient samples and tumor-derived cells CRISPR-Cas9-edited for H3.3 G34W, we show that H3.3K36me3 loss on mutant H3.3 alters the deposition of the repressive H3K27me3 mark from intergenic to genic regions, beyond areas of H3.3 deposition. This promotes redistribution of other chromatin marks and aberrant transcription, altering cell fate in mesenchymal progenitors and hindering differentiation. Single-cell transcriptomics reveals that H3.3 G34W stromal cells recapitulate a neoplastic trajectory from a SPP1+ osteoblast-like progenitor population toward an ACTA2+ myofibroblast-like population, which secretes extracellular matrix ligands predicted to recruit and activate osteoclasts. Our findings suggest that H3.3 G34W leads to GCT by sustaining a transformed state in osteoblast-like progenitors, which promotes neoplastic growth, pathologic recruitment of giant osteoclasts, and bone destruction. SIGNIFICANCE: This study shows that H3.3 G34W drives GCT tumorigenesis through aberrant epigenetic remodeling, altering differentiation trajectories in mesenchymal progenitors. H3.3 G34W promotes in neoplastic stromal cells an osteoblast-like progenitor state that enables undue interactions with the tumor microenvironment, driving GCT pathogenesis. These epigenetic changes may be amenable to therapeutic targeting in GCT.See related commentary by Licht, p. 1794.This article is highlighted in the In This Issue feature, p. 1775.


Conflict of interest statement

Conflict of Interest Disclosure Statement: The authors declare no potential conflicts of interest.

Figures

Figure 1.
Figure 1.. G34W is necessary for tumourigenesis and promotes aggressive osteolytic bone lesions in an orthotopic xenograft model.
(A) G34W immunoblotting of Im-GCT-4072 G34W (Parent: n=1; Clone: n=2) and edited (Repair to WT: n=2) lines. (B) G34W lines (Parent: n=1; Clone: n=2) of Im-GCT-4072 proliferate faster than edited lines (Repair to WT: n=3; G34W-KO: n=2), as measured using the IncuCyte live-cell analysis system for 5 consecutive days. Data are presented as mean red object count ± SD from five technical replicates per line. Statistical significance assessed using Student’s t-test based on averaged observations from biological replicates (independent CRISPR clones, labeled). (C) Representative images of G34W (left) and edited (right) cell colonies in culture plates (top panel). G34W lines (Parent: n=1; Clone: n=2) of Im-GCT-4072 exhibit increased colony formation relative to edited lines (Repair to WT: n=3; G34W KO: n=2), as measured by manual counting of colonies stained with crystal violet after 3 weeks (bottom panel). Two technical replicates were counted per line, and data are presented as an average of biological replicates (independent CRISPR clones, labeled). Statistical significance assessed using Student’s t-test. (D) Left: Representative bioluminescence Xenogen IVIS 200 imaging of mice implanted in the tibia with Im-GCT-4072 G34W and edited luciferase-tagged lines. Right: Representative images of mice tibias implanted with G34W and edited cells after skin removal at the time of sacrifice. (E) Kaplan-Meier survival curve for orthotopic tibial implantation of Im-GCT-4072 G34W (Parent: n=1, Clone: n=2; n=10 mice), edited lines (Repair to WT: n=2, n=10 mice), edited O/E G34W (n=7 mice), edited O/E H3.3WT (n=7 mice) in NRG mice illustrates the dependence of tumour formation on the presence of G34W mutation. (F) H&E, and H3.3G34W, TRAP (tartrate-resistant acid phosphatase) and Ki67 IHC for a representative tibial xenograft tumour derived from implantation of Im-GCT-4072 G34W parental cells. 20X (70μm) magnified area illustrates a histological compartment (middle panel) with differentiated stromal cells and abundant TRAP+ osteoclasts (an example of giant multinucleated osteoclast is featured in the inset). Right panel illustrates a histological compartment with undifferentiated stromal cells, high Ki67 staining, and absence of TRAP+ osteoclasts. (G) Representative H&E and G34W IHC of decalcified legs derived from tibial implantation of Im-GCT-6176 G34W parental cells, illustrating the osteolytic effect of G34W stromal cells relative to a control contralateral leg. Inset features reactive G34W-negative osteoclasts observed at the interface between G34W-positive neoplastic stromal cells and normal bone.
Figure 2.
Figure 2.. G34W promotes ECM remodeling and impairs muscle contraction pathways.
(A) PCA reveals distinct transcriptomic profiles between Im-GCT-4072 G34W (red; n=7) and edited lines (blue; n=9). Read counts were counted over Ensembl genes, normalized using the median-of-ratios procedure and transformed using the variance-stabilizing transformation. The effect of the genotype is captured in PC1 (35% of the variance). (B) Pathway enrichment analysis of statistically significantly up- (purple) and downregulated (green) genes in G34W compared to edited lines from Im-GCT-4072. Pathway enrichment analysis was performed using g:Profiler. Top 5 statistically significantly enriched terms (GO:BP, term size<1000, P<0.05) are shown. The complete table can be found in Table S3. (C) Violin plots depicting expression levels of extracellular matrix genes COL6A1, COL6A3, EMILIN2 and SOX9 as well as muscle contraction ACTA2, CNN1, LMOD1 and TAGLN in G34W (red) and edited (blue) lines from Im-GCT-4072. *: P<0.05, **: P<0.01, ***: P<0.001, n.s.: non-significant. Gene expression levels reported in median-of-ratios normalized read counts. Significance was assessed using DESeq2. The complete table can be found in Table S2. (D) PCA reveals distinct H3K27ac profiles between G34W (red; n=3) and edited lines (blue; n=4) from Im-GCT-4072. Read counts were counted over 10kb genomic bins and normalized to RPKM. The effect of the genotype is captured in PC1 (50% of the variance). The labels correspond to clones. Refer to Table S1 for more details on clones. (E) Heatmap illustrating transcriptional and epigenetic changes (H3K27ac, H3K36me3, H3K27me3) at consistently transcriptionally deregulated genes across the three isogenic cell models. Differential gene expression and histone mark enrichment are reported in log2 fold-change (LFC) in G34W lines over edited lines of the respective isogenic cell models. Significance was assessed using DESeq2. *: P<0.05, **: P<0.01, ***: P<0.001. The complete table can be found in Table S2. (F) Genomic tracks highlighting changes in H3K27ac and gene expression at COL6A3, SOX9, TNNT2 and MYL1 loci between G34W (red) and edited (blue) lines from Im-GCT-4072. Signals overlaid by replicates, reported in RPKM, and group auto-scaled by genomic assay.
Figure 3.
Figure 3.. G34W is deposited into euchromatin and is associated with redistribution of H3.3 in GCT.
(A) Left: Pie chart illustrating relative abundance of G34W, and wild-type H3.3 and H3.1/2 histones by histone mass spectrometry in the Im-GCT-4072 parental line. Right: stacked barplot illustrating relative abundance of G34W and wildtype H3.3. (B) Histone mass spectrometry reveals in cis changes in H3.3K36me3 (top) and H3.3K27me3 (bottom) on G34W (pink) compared to WT (light blue) H3.3 peptides in G34W-mutant GCT cell lines (n=4). *: P<0.05; **: P<0.01, ***: P<0.001, n.s.: non-significant. Significance was assessed using Student’s t-test. (C) H3.3 (left) and G34W (right) abundances in the ±10kb window around H3.3 peaks. H3.3 peaks are stratified into four quartiles of H3.3 abundance in the parental line Im-GCT-4072. (D) Scatterplot illustrating changes in H3K36me3 at H3.3 peaks between G34W (y-axis; n=2) and edited (x-axis; n=3) lines from Im-GCT-4072. Statistically significant gains and losses in G34W lines are highlighted in purple and green, respectively. Significance was assessed using DiffBind and read counts reported in log2 scale. (E-F) Representative tracks at the ANTRX2 locus highlighting gain of H3K36me3 (E) and at the AFF3 locus highlighting loss of H3K36me3 (F) in wild-type- and mutant H3.3-enriched regions in G34W (red; n=2) and edited (blue; n=3) lines from Im-GCT-4072. Signals overlaid by replicates, reported in RPKM, and group auto-scaled by genomic assay. (G) Scatterplot illustrating changes in H3K36me3 (y-axis), H3K27me3 (x-axis) and H3.3 (color) genome-wide between G34W (n=2) and edited lines (n=3) from Im-GCT-4072. Loci that lose H3K36me3 and gain H3K27me3 concurrently lose H3.3. Reads counted over 10kb bins, averaged per condition, normalized to RPKM and changes were reported as the log2 fold change (LFC) between G34W and edited lines. ρ is the Spearman rank correlation coefficient and significance was calculated from Spearman's ρ statistic. (H) PCA illustrating genome-wide deposition patterns of H3.3 between G34W (red; n=2) and edited lines (blue; n=3) from Im-GCT-4072. PCA was performed on H3.3 abundance at consensus H3.3 peaks. The effect of the genotype is captured in PC1 (80% of the variance). The labels correspond to clones. Refer to Table S1 for more details on clones.
Figure 4.
Figure 4.. H3K27me3 is redistributed from intergenic to genic regions during the chromatin remodeling process in G34W GCT cells.
(A) Left: Scatterplot depicting changes in H3K27me3 in G34W (y-axis; n=2) and edited (x-axis; n=3) lines from Im-GCT-4072. Color: point density. Solid line: no change in abundance. Dotted lines: two-fold change in abundance. Reads counted over 10kb bins, averaged per condition, normalized to RPKM and reported in log2 scale. Middle: Bar plot quantifying the number of 10kb bins with gained (purple), unchanged (grey) and lost (green) H3K27me3 in G34W relative to edited lines. Bins with above-median average H3K27me3 in either condition and with an absolute log2 fold-change (LFC) of H3K27me3 exceeding 1 (2-fold change) were called as gains and losses. Right: Pie charts illustrating proportion of 10kb bins gaining or losing H3K27me3 that overlap promoters, gene bodies and intergenic regions. ***: P<0.001. Significance was assessed using χ2 test. (B) Left: Bar plot quantifying the number of 10kb bins with gained (purple), unchanged (grey) and lost (green) SUZ12 in G34W relative to edited lines. Bins with above-median average H3K27me3 in either condition and with an absolute log2 fold-change (LFC) of H3K27me3 exceeding 0.58 (1.5-fold change) were called as gains and losses. Right: Pie charts illustrating proportion of 10kb bins gaining or losing SUZ12 that overlap promoters, gene bodies and intergenic regions. (C) Scatterplot illustrating epigenetic changes at significantly deregulated genes in actin filament-based process pathway in G34W lines compared to edited lines from Im-GCT-4072. X-axis: log2 fold-change (LFC) of H3K27me3. Y-axis: LFC of H3K36me3. Grey: significant differentially expressed genes; purple/green: up- and downregulated genes in pathway; big circle: significant changes in genic H3K36me3 and H3K27me3. Replicates: H3K27me3 (G34W n=2; edited n=3), H3K36me3 (G34W n=2; edited n=3), RNA (G34W n=7; edited n=9). (D) Representative track at the TNNT2, LAD1, and TNNI1 locus illustrating changes in SUZ12, H3K27me3, H3K36me2, H3K9me3, and H3K27ac between G34W (red) and edited lines (blue) from Im-GCT-4072. Signals overlaid by replicates, reported in RPKM, and group auto-scaled by genomic assay. (E) Top: Scatterplot illustrating that gain of H3K27me3 in G34W lines is associated with a loss of H3K36me2. Color: point density. X-axis: log2 fold-change (LFC) of H3K9me3 between G34W (n=2) and edited (n=2) lines from Im-GCT-4072. Y-axis: LFC of H3K36me2 between G34W (n=2) and edited (n=3) lines. Bottom: Scatterplot illustrating that loss of H3K27me3 is associated with a gain of either H3K36me2 or H3K9me3. (F) Representative tracks at the BMP2 (top) and ISX/LARGE1 (bottom) loci illustrating changes in SUZ12, H3K27me3, H3K36me2, H3K9me3, and H3K27ac between G34W (red) and edited lines (blue) from Im-GCT-4072. Signals overlaid by replicates, reported in RPKM, and group auto-scaled by genomic assay.
Figure 5.
Figure 5.. GCT stromal cells resemble specific osteoprogenitors and a distinct ACTA2+ subset have features of contractile cells.
(A) Boxplot displaying higher G34W enrichment scores for single cells in stromal clusters from each patient. The G34W enrichment score is derived from the average expression of differentially expressed genes (LFC>2) between isogenic G34W and edited Im-GCT-4072 lines. ***: P<0.0005, significance was assessed using a Wilcoxon rank sum test. (B) Left: UMAP plot of Harmony integrated cells from scRNA-seq on n=4 primary GCTs, revealing the 4 stromal subtypes S1A, S1B, S2, and S3. Right: Average expression of genes highly correlated with S1-specific SPP1 gene (SPP1 module), or with S3-specific ACTA2 gene (ACTA2 module), shown on UMAP plot of Harmony integrated cell clusters. Refer to Table S1 for details. (C) Row-scaled heatmap showing average expression of differentially expressed genes that characterize each stromal subtype. (D) Representative IHC for osteopontin (SPP1) and alpha-SMA (ACTA2) in two GCT patient tumours. (E) Lineage inference by Slingshot showing neoplastic trajectories from S1A to S1B, and S1A to S3. Cells are coloured by pseudotime, with red cells occurring earlier than blue cells in the trajectory. (F) SingleR classification of each stromal cell subtype (S1, S2, S3) and endothelial control based on Tikhonova et al. reference cell types (28). Stromal cell subtypes most strongly resemble the Osteo-lineage 1 reference cell cluster (labelled as O1 (Col16a1 Tnn) in Tikhonova et al.). (G) SingleR classification of each stromal cell subtype (S1, S2, S3) and endothelial control based on Baryawno et al. reference cell types (27). Stromal cell subtypes most strongly resemble the osteoprogenitors reference cell cluster (labelled as OLC-2 subtype 8_3 in Baryawno et al.). (H) Representative immunofluorescence images for the myofibroblast muscle marker calponin 1 in hMSCs and isogenic Im-GCT-4072 cells maintained in non-induced (−) or myofibroblast differentiation media (+) for 2 weeks. (I) Bar-plot quantifying the mean fluorescence intensity of calponin 1 staining in G34W (n=2 lines; three different fields each) and edited lines (n=2; four different fields each) maintained in non-induced (−) or myofibroblast differentiation media (+).
Figure 6.
Figure 6.. G34W GCT stromal cells secrete factors that promote ECM remodeling and association with myeloid cells.
(A) Violin plots depicting expression levels of TNFSF11 (RANKL) and TNFRSF11B (OPG) in G34W (red) and edited (blue) lines from Im-GCT-4072. *: P<0.05, ***: P<0.001, n.s.: non-significant. Gene expression levels reported in median-of-ratios normalized read counts Significance assessed using DESeq2. (B) UMAP plot highlighting the myeloid compartment of GCT. (C) Diffusion map showing a trajectory from monocytes (red) to terminally-differentiated osteoclasts (blue) through a pre-osteoclast intermediate along Slingshot-inferred pseudotime. (D) Schematic of Golgi apparatus isolation and mass spectrometry workflow to identify differentially secreted proteins between isogenic G34W (red) and edited (blue) cells. (E) CCInx-predicted (31) ligand-receptor interactions between GCT stromal cells (left) and osteoclast cells (right). Colors represent the mean normalized gene expression in each cell type. Only interactions between proteins differentially secreted in G34W cell lines by MS (P<0.05) and expressed by stromal cells are shown on the left and only genes differentially expressed (P<0.05) in osteoclasts (vs. non-myeloid cells) are shown on the right. P values were adjusted for multiple testing using FDR. (F) Representative IHC for collagen type VI and biglycan in three patient GCTs. (G) Venn diagram showing overlap of genes with significantly enriched expression in each stromal cell subtype, S1-S3 (Seurat Wilcox test, P<0.05, FDR corrected) and genes with significantly increased protein secretion in G34W cell lines by MS (P<0.05, FDR corrected). The 6 intersecting genes are highlighted.
Figure 7.
Figure 7.. Schematic illustrating G34W-mediated epigenetic remodeling and ECM remodeling by subpopulations of GCT stromal cells.
(A) Schematic illustrating G34W-mediated epigenetic remodeling of neoplastic GCT cells. (B) Schematic illustrating G34W-dependent differentiation trajectory in stromal cells and interactions with osteoclasts in the bone TME.

Comment in

References

    1. Board WC of TE. Soft Tissue and Bone Tumours WHO classification of tumours. 2020; 5th edition, 3.
    1. Behjati S, Tarpey PS, Presneau N, Scheipl S, Pillay N, Van Loo P, et al. Distinct H3F3A and H3F3B driver mutations define chondroblastoma and giant cell tumor of bone. Nat Genet. 2013;45:1479–82. - PMC - PubMed
    1. Fontebasso AM, Papillon-Cavanagh S, Schwartzentruber J, Nikbakht H, Gerges N, Fiset P-O, et al. Recurrent somatic mutations in ACVR1 in pediatric midline high-grade astrocytoma. Nat Genet. 2014;46:462–6. - PMC - PubMed
    1. Schwartzentruber J, Korshunov A, Liu X-Y, Jones DTW, Pfaff E, Jacob K, et al. Driver mutations in histone H3.3 and chromatin remodelling genes in paediatric glioblastoma Nature. Nature Publishing Group; 2012;482:226–31. - PubMed
    1. Presneau N, Baumhoer D, Behjati S, Pillay N, Tarpey P, Campbell PJ, et al. Diagnostic value of H3F3A mutations in giant cell tumour of bone compared to osteoclast-rich mimics. J Pathol Clin Res. 2015;1:113–23. - PMC - PubMed

Publication types

MeSH terms