

Effects of Neuronic Shutter Observed in the EEG Alpha Rhythm
- PMID: 32967890
- PMCID: PMC7548434
- DOI: 10.1523/ENEURO.0171-20.2020
Effects of Neuronic Shutter Observed in the EEG Alpha Rhythm
Abstract
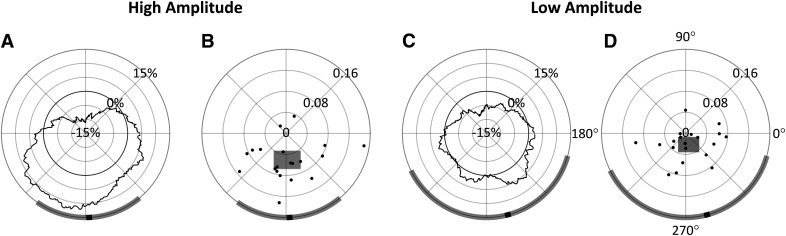
The posterior alpha (α) rhythm, seen in human electroencephalogram (EEG), is posited to originate from cycling inhibitory/excitatory states of visual relay cells in the thalamus. These cycling states are thought to lead to oscillating visual sensitivity levels termed the "neuronic shutter effect." If true, perceptual performance should be predictable by observed α phase (of cycling inhibitory/excitatory states) relative to the timeline of afferentiation onto the visual cortex. Here, we tested this hypothesis by presenting contrast changes at near perceptual threshold intensity through closed eyelids to 20 participants (balanced for gender) during times of spontaneous α oscillations. To more accurately and rigorously test the shutter hypothesis than ever before, α rhythm phase and amplitude were calculated relative to each individual's retina-to-primary visual cortex (V1) conduction delay, estimated from the individual's C1 visual-evoked potential (VEP) latency. Our results show that stimulus observation rates (ORs) are greater at a trough than a peak of the posterior α rhythm when phase is measured at the individual's conduction delay relative to stimulus onset. Specifically, the optimal phase for stimulus observation was found to be 272.41°, where ORs are 20.96% greater than the opposing phase of 92.41°. The perception-phase relationship is modulated by α rhythm amplitude and is not observed at lower amplitude oscillations. Collectively, these results provide support to the "neuronic shutter" hypothesis and demonstrate a phase and timing relationship consistent with the theory that cycling excitability in the thalamic relay cells underly posterior α oscillations.
Keywords: EEG; alpha rhythm; neuronic shutter; visual conduction delay; visual-evoked potential.
Copyright © 2020 Alexander et al.
Figures


Similar articles
-
α Phase-Amplitude Tradeoffs Predict Visual Perception.eNeuro. 2022 Feb 22;9(1):ENEURO.0244-21.2022. doi: 10.1523/ENEURO.0244-21.2022. Print 2022 Jan-Feb. eNeuro. 2022. PMID: 35105658 Free PMC article.
-
Pre-stimulus alpha-band phase gates early visual cortex responses.Neuroimage. 2022 Jun;253:119060. doi: 10.1016/j.neuroimage.2022.119060. Epub 2022 Mar 11. Neuroimage. 2022. PMID: 35283286
-
The Visual Evoked Potential is independent of surface alpha rhythm phase.Neuroimage. 2009 Apr 1;45(2):463-9. doi: 10.1016/j.neuroimage.2008.12.031. Epub 2008 Dec 30. Neuroimage. 2009. PMID: 19159692
-
The many characters of visual alpha oscillations.Eur J Neurosci. 2018 Oct;48(7):2498-2508. doi: 10.1111/ejn.13747. Epub 2017 Nov 6. Eur J Neurosci. 2018. PMID: 29044823 Review.
-
Cause or consequence? Alpha oscillations in visuospatial attention.Trends Neurosci. 2021 Sep;44(9):705-713. doi: 10.1016/j.tins.2021.05.004. Epub 2021 Jun 21. Trends Neurosci. 2021. PMID: 34167840 Review.
Cited by
-
Individualized Closed-Loop Acoustic Stimulation Suggests an Alpha Phase Dependence of Sound Evoked and Induced Brain Activity Measured with EEG Recordings.eNeuro. 2024 Jun 14;11(6):ENEURO.0511-23.2024. doi: 10.1523/ENEURO.0511-23.2024. Print 2024 Jun. eNeuro. 2024. PMID: 38834300 Free PMC article.
-
Individual alpha frequency appears unrelated to the latency of early visual responses.Front Neurosci. 2023 Apr 11;17:1118910. doi: 10.3389/fnins.2023.1118910. eCollection 2023. Front Neurosci. 2023. PMID: 37113149 Free PMC article.
-
Prestimulus Alpha Phase Modulates Visual Temporal Integration.eNeuro. 2024 Sep 12;11(9):ENEURO.0471-23.2024. doi: 10.1523/ENEURO.0471-23.2024. Print 2024 Sep. eNeuro. 2024. PMID: 39134415 Free PMC article.
-
A randomized controlled trial of alpha phase-locked auditory stimulation to treat symptoms of sleep onset insomnia.Sci Rep. 2024 Jun 6;14(1):13039. doi: 10.1038/s41598-024-63385-1. Sci Rep. 2024. PMID: 38844793 Free PMC article. Clinical Trial.
-
α Phase-Amplitude Tradeoffs Predict Visual Perception.eNeuro. 2022 Feb 22;9(1):ENEURO.0244-21.2022. doi: 10.1523/ENEURO.0244-21.2022. Print 2022 Jan-Feb. eNeuro. 2022. PMID: 35105658 Free PMC article.
References
-
- American Electroencephalographic Society (1994) Guideline thirteen: guidelines for standard electrode position nomenclature. American Electroencephalographic Society. J Clin Neurophysiol 11:111–113. - PubMed
MeSH terms
Grants and funding
LinkOut - more resources
Full Text Sources