. 2020 Sep 23;147(18):dev189373.
doi: 10.1242/dev.189373.

Functional evidence that Activin/Nodal signaling is required for establishing the dorsal-ventral axis in the annelid Capitella teleta

Affiliations

Functional evidence that Activin/Nodal signaling is required for establishing the dorsal-ventral axis in the annelid Capitella teleta

Alexis R Lanza et al. Development. .

Abstract

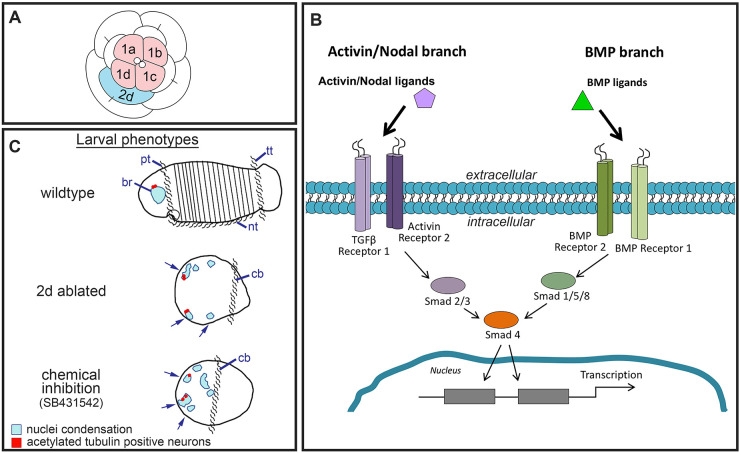
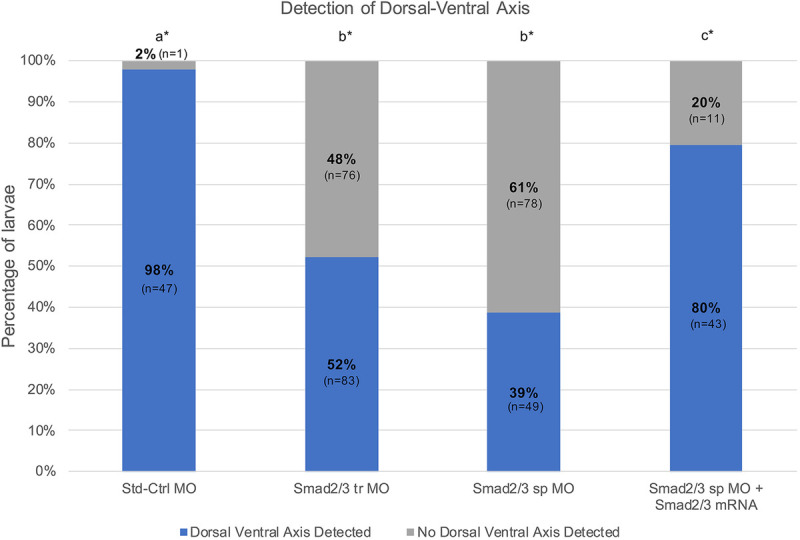
The TGF-β superfamily comprises two distinct branches: the Activin/Nodal and BMP pathways. During development, signaling by this superfamily regulates a variety of embryological processes, and it has a conserved role in patterning the dorsal-ventral body axis. Recent studies show that BMP signaling establishes the dorsal-ventral axis in some mollusks. However, previous pharmacological inhibition studies in the annelid Capitella teleta, a sister clade to the mollusks, suggests that the dorsal-ventral axis is patterned via Activin/Nodal signaling. Here, we determine the role of both the Activin/Nodal and BMP pathways as they function in Capitella axis patterning. Antisense morpholino oligonucleotides were targeted to Ct-Smad2/3 and Ct-Smad1/5/8, transcription factors specific to the Activin/Nodal and BMP pathways, respectively. Following microinjection of zygotes, resulting morphant larvae were scored for axial anomalies. We demonstrate that the Activin/Nodal pathway of the TGF-β superfamily, but not the BMP pathway, is the primary dorsal-ventral patterning signal in Capitella These results demonstrate variation in the molecular control of axis patterning across spiralians, despite sharing a conserved cleavage program. We suggest that these findings represent an example of developmental system drift.

Keywords: Annelid; Axes formation; BMP; Morpholino; Spiralian; TGF-β.


Conflict of interest statement

Competing interestsThe authors declare no competing or financial interests.

Figures

Fig. 1.
Fig. 1.
Schematics of spiralian embryo, TGF-β superfamily cassette and larval Capitella phenotypes. (A) Capitella organizer cell 2d is shown in blue, first quartet cells are in pink. (B) General schematic depicting both branches of the TGF-β superfamily pathway and the key signaling components. Arrows indicate condensation of nuclei. (C) Phenotypes seen in stage 6 Capitella larvae following perturbations. br, brain; cb, ciliary band; nt, neurotroch; pt, prototroch; tt, telotroch.
Fig. 2.
Fig. 2.
Transcript counts of TGF-β superfamily signaling components in early cleavage stage embryos. Heatmap shows the log10 values of relative transcript levels. Blue and red indicate low and high levels of transcript abundance, respectively. Each row represents the expression of a single gene. Each column represents an embryonic stage. Components listed in purple are associated with Activin/Nodal signaling, green with BMP signaling and orange with both branches. Components are grouped into functional categories: ligands, receptors, Smads and inhibitors. Asterisks indicate genes with differential expression.
Fig. 3.
Fig. 3.
Spatial localization of TGF-β pathway components. (A-F′) Merged confocal stack images of embryos with organizer cell 2d present. Images with the same lettering correspond to a single embryo. Nuclei are labeled via anti-histone antibody (blue, A-F). Spatial localization of Ct-BMP Receptor 2 (BMPR2), Ct-Smad1/5/8, Ct-activin/inhibin/myostatin-like5 (Act5), Ct- activin/inhibin/myostatin-like4 (Act4), Ct-TSG and Ct-NogginA are visualized by FISH (magenta, A′-F′). Expression is localized in and around the nucleus, as is occasionally seen in C. teleta early stage embryos (Boyle and Seaver, 2008; Boyle et al., 2014; Lanza and Seaver, 2018). 2d and first quartet cells are labeled. All genes are differentially expressed, except Act5.
Fig. 4.
Fig. 4.
Knockdown of Smad2/3 and Smad1/5/8 using splice-blocking morpholinos. (A) Smad2/3 splice-blocking (sp) MO blocks splicing between intron 1 and exon 2 (top schematic). Middle schematic depicts expected size of wild-type (WT) transcripts. Bottom schematic depicts expected size of morphant transcripts. (B) Smad1/5/8 sp1 MO blocks splicing between exon 3 and intron 3 (top schematic). Middle schematic depicts expected size of WT transcripts. Bottom schematic depicts expected size of morphant transcripts. (C) Smad1/5/8 sp2 MO blocks splicing between intron 4 and exon 5 (top schematic). Middle schematic depicts expected size of WT transcripts. Bottom schematic depicts expected size of morphant transcripts. Red asterisks indicate position of premature stop codons resulting from MO splicing activity. Both WT and morphant transcripts were amplified from larvae injected as zygotes with Smad2/3 sp MO (A), Smad1/5/8 sp1 MO (B) and Smad1/5/8 sp2 (C). Standard-control (Std-Ctrl) morphants yielded only WT-sized bands (A-C). Amplification of a 1000 bp actin fragment served as a cDNA quality control (A,B). Ladder band sizes are specified per gel image. ORF, open reading frame; UTR, untranslated region.
Fig. 5.
Fig. 5.
Axial properties of wild-type C. teleta larvae. (A-B″) Confocal projections of stage 6 larvae, oriented with anterior to the left. Columns show labeling of nuclei with Hoechst (A,B), cilia and neurons with anti-acetylated tubulin (A′,B′) and actin filaments with phalloidin (A″,B″). Larvae in A-A″ are in lateral view, B-B″ are in ventral view. Open arrowhead, scac+; asterisks, position of the mouth; white arrows, circumferential and longitudinal muscle fibers. br, brain; cn, circumoral nerve; ey, eye; fg, foregut; lat, lateral; m, circular tufts of cilia localized to the mouth; nt, neurotroch; pt, prototroch; tt, telotroch; vent, ventral; vnc, ventral nerve cord.
Fig. 6.
Fig. 6.
MO knockdown of Smad2/3 results in loss of dorsal-ventral axis. (A-E″) Images across a row correspond to a single stage 6 larva. Larvae are laterally oriented with anterior to the left. Each panel depicts a confocal projection. Columns show labeling of nuclei with Hoechst (A-E), cilia and neurons with anti-acetylated tubulin (A′-E′) and actin filaments with phalloidin (A″-E″). (A-A″) Images of a larva resulting from zygotic injections with Std-Ctrl MO, and exhibit a wild-type-like phenotype. (B-B″,C-C″) Phenotypic series showing abnormal larvae resulting from zygotic injections of a Smad2/3 tr MO. (D-D″,E-E″) Phenotypic series showing abnormal larvae resulting from zygotic injections of a Smad2/3 sp MO. Open arrowheads, scac+ ; asterisks, position of the mouth; white arrows, circumferential and longitudinal muscle fibers; yellow arrows, clusters of nuclei. br, brain; cb, ciliary band; ct, ciliary tufts; ey, eye; fg, foregut; lat, lateral; nt, neurotroch; pt, prototroch; tt, telotroch; vnc, ventral nerve cord.
Fig. 7.
Fig. 7.
Reduction of dorsal-ventral axis in Smad2/3 knockdowns and rescue with Smad2/3 mRNA. Percentage of animals with a detectable dorsal-ventral axis (blue) in relation to the percentage of animals lacking a detectable dorsal-ventral axis (gray). There is significance between treatment conditions if the letters with asterisks differ. Overlapping letters do not differ at P=0.05 using post-hoc Bonferroni-corrected z-test of two proportions.
Fig. 8.
Fig. 8.
Smad2/3 mRNA is translated into protein by the 16-cell stage. (A-F) Z-stacks of merged confocal fluorescent images of 16-cell stage embryos. (A-C) A single uninjected control embryo. (D-F) A single embryo resulting from zygotic injection with 3′ 6×His-tagged mRNA. (A,D) DNA is labeled in cyan by Hoechst staining. (B,E) Embryos labeled with the anti-6×His monoclonal antibody detect recombinant protein containing the 6×His epitope tag (white in E). (C,F) Merged image of D and E showing spatial relationship between nuclear labeling and Smad2/3.
Fig. 9.
Fig. 9.
Exogenous Smad2/3 mRNA rescues Smad2/3 splice-blocking morpholino phenotypes. (A-E″) Images across a row correspond to a single stage 6 larva. Larvae are laterally oriented with anterior to the left. Each panel depicts a confocal projection. Each column depicts labeling for nuclei with Hoechst (A-E), cilia and neurons with anti-acetylated tubulin (A′-E′) or actin filaments with phalloidin (A″-E″). (A-A″) Images of larva with wild-type-like phenotype resulting from uninjected control embryos. (B-B″) Larva resulting from zygotic injections of wild-type Smad2/3 mRNA. (C-E″) Larva resulting from zygotic injections of both Smad2/3 sp MO and wild-type Smad2/3 mRNA. Phenotypically, larvae are wild-type-like (C-C″), moderately abnormal (D-D″) or severely abnormal (E-E″). Open arrowheads, scac+; asterisks, position of the mouth; white arrows, muscle fibers; yellow arrows, clusters of nuclei. br, brain; cb, ciliary band; ey, eye; fg, foregut; lat, lateral; nt, neurotroch; pt, prototroch; tt, telotroch; vnc, ventral nerve cord.
Fig. 10.
Fig. 10.
MO knockdown of Smad1/5/8 results in abnormal larval morphology. (A- E″) Images across a row are of a single stage 6 larva. Larvae are laterally oriented, anterior to the left and posterior to the right. Each panel depicts a merged confocal stack. Each column depicts labeling for nuclei with Hoechst (A-E), cilia and neurons with anti-acetylated tubulin (A′-E′) or actin filaments with phalloidin (A″-E″). (A-A″) Larva resulting from zygotic injections with the Std-Ctrl MO. Smad1/5/8 sp1 morphants exhibit wild-type-like (B-B″) or abnormal larval phenotypes (C-C″). Smad1/5/8 sp2 morphants exhibit wild-type-like (D-D″) or abnormal larval phenotypes (E-E″). Open arrowheads, scac+; asterisks, position of the mouth; white arrows, muscle fibers. br, brain; cb, ciliary band; ey, eye; fg, foregut; lat, lateral; nt, neurotroch; ps, presumptive segments; pt, prototroch; tt, telotroch; vnc, ventral nerve cord.
Fig. 11.
Fig. 11.
Detection of dorsal-ventral axis in Smad1/5/8 knockdowns. Percentage of animals in which dorsal-ventral axis is detectable (blue) in relation to the percentage of animals in which a dorsal-ventral axis is not detectable (gray). There is significance between treatment conditions if the letters with asterisks differ. Overlapping letters do not differ at P=0.05 using post-hoc Bonferroni-corrected z-test of two proportions.
Fig. 12.
Fig. 12.
Hypothesized model for organizing activity. Schematic depicting 16-cell stage embryo during organizing activity by micromere 2d. Identity of each cell quadrant is specified via the color key. Model suggests BMP signaling is downregulated (red arrow) in quadrants A, B and C but not in D (green arrow), whereas Activin/Nodal signaling is active in all four quadrants (green arrows).

Similar articles

Cited by

References

    1. Ackermann C., Dorresteijn A. and Fischer A. (2005). Clonal domains in postlarval Platynereis dumerilii (Annelida: Polychaeta). J. Morphol. 266, 258-280. 10.1002/jmor.10375 - DOI - PubMed
    1. Amiel A. R., Henry J. Q. and Seaver E. C. (2013). An organizing activity is required for head patterning and cell fate specification in the polychaete annelid Capitella teleta: new insights into cell-cell signaling in Lophotrochozoa. Dev. Biol. 379, 107-122. 10.1016/j.ydbio.2013.04.011 - DOI - PubMed
    1. Baker S. C., Bauer S. R., Beyer R. P., Brenton J. D., Bromley B., Burrill J., Causton H., Conley M. P., Elespuru R., Fero M. et al. (2005). The external RNA controls consortium: a progress report. Nat. Methods 2, 731-734. 10.1038/nmeth1005-731 - DOI - PubMed
    1. Blitz I. L. (2003). Twisted gastrulation loss-of-function analyses support its role as a BMP inhibitor during early Xenopus embryogenesis. Development 130, 4975-4988. 10.1242/dev.00709 - DOI - PubMed
    1. Boyle M. J. and Seaver E. C. (2008). Developmental expression of foxA and gata genes during gut formation in the polychaete annelid. Capitella sp. I. Evol. Dev. 10, 89-105. 10.1111/j.1525-142X.2007.00216.x - DOI - PubMed

Publication types

MeSH terms