. 2020 Nov 27;295(48):16380-16392.
doi: 10.1074/jbc.RA120.015106. Epub 2020 Sep 23.

Structural and molecular basis for the substrate positioning mechanism of a new PL7 subfamily alginate lyase from the arctic

Affiliations

Structural and molecular basis for the substrate positioning mechanism of a new PL7 subfamily alginate lyase from the arctic

Fei Xu et al. J Biol Chem. .

Abstract

Alginate lyases play important roles in alginate degradation in the ocean. Although a large number of alginate lyases have been characterized, little is yet known about those in extremely cold polar environments, which may have unique mechanisms for environmental adaptation and for alginate degradation. Here, we report the characterization of a novel PL7 alginate lyase AlyC3 from Psychromonas sp. C-3 isolated from the Arctic brown alga Laminaria, including its phylogenetic classification, catalytic properties, and structure. We propose the establishment of a new PM-specific subfamily of PL7 (subfamily 6) represented by AlyC3 based on phylogenetic analysis and enzymatic properties. Structural and biochemical analyses showed that AlyC3 is a dimer, representing the first dimeric endo-alginate lyase structure. AlyC3 is activated by NaCl and adopts a novel salt-activated mechanism; that is, salinity adjusts the enzymatic activity by affecting its aggregation states. We further solved the structure of an inactive mutant H127A/Y244A in complex with a dimannuronate molecule and proposed the catalytic process of AlyC3 based on structural and biochemical analyses. We show that Arg82 and Tyr190 at the two ends of the catalytic canyon help the positioning of the repeated units of the substrate and that His127, Tyr244, Arg78, and Gln125 mediate the catalytic reaction. Our study uncovers, for the first time, the amino acid residues for alginate positioning in an alginate lyase and demonstrates that such residues involved in alginate positioning are conserved in other alginate lyases. This study provides a better understanding of the mechanisms of alginate degradation by alginate lyases.

Keywords: Arctic; PL7 family; algae; alginate lyase; enzyme degradation; enzyme mechanism; metabolism; subfamily; substrate positioning.


Conflict of interest statement

Conflict of interest—The authors declare that they have no conflicts of interest with the contents of this article.

Figures

Figure 1.
Figure 1.
Phylogenetic analysis of AlyC3 and other PL7 lyases from different subfamilies. The unrooted phylogenetic tree was constructed by using the maximum likelihood with a Jones–Taylor–Thornton matrix–based model using the catalytic domains. Bootstrap analysis of 1000 replicates was conducted. Clusters of proteins are separated by dotted lines. The subfamily and the substrate specificity were marked in red numbers and blue annotations according to the CAZy database. Enzymes highlighted in green are structure-solved. AlyC3 is highlighted in red.
Figure 2.
Figure 2.
Enzymatic characterization of AlyC3. A, the effect of pH on the activity of AlyC3 toward sodium alginate. Experiments were conducted at 20 °C for 5 min in a 200-μl mixture containing 0.6 μg/ml enzyme and 2 mg/ml sodium alginate in 50 mm Britton–Robinson buffer ranging from pH 5 to 11. B, the effect of temperature on the activity of AlyC3 toward sodium alginate. A 200-μl reaction mixture containing 0.6 μg/ml enzyme and 2 mg/ml sodium alginate in 50 mm Tris-HCl (pH 8.0) was incubated at 20 °C for 5 min. C, the effect of temperature on the stability of AlyC3. AlyC3 was incubated at different temperatures for 0 to 60 min, and the residual activities were measured at 20 °C and pH 8.0. D, the substrate specificities of AlyC3 toward sodium alginate, PM, and PG.
Figure 3.
Figure 3.
Degradation products of AlyC3 toward different mannuronate oligosaccharides. Tri- to hexaoligosaccharides were used as the substrates, corresponding to A–D, respectively. The reaction was carried out at 20 °C for 10 min in a 200-μl mixture containing 0.7 μg/ml AlyC3 and 2 mg/ml substrate in 50 mm Tris-HCl (pH 8.0) containing 0.5 m NaCl. The resultant degradation products were analyzed by HPLC on a Superdex Peptide 10/300 GL column at a flow rate of 0.35 ml/min using 0.2 m ammonium hydrogen carbonate as the running buffer. Control group was performed with pre–heat-inactivated AlyC3. M, 2M, 3M, 4M, 5M, and 6M represent mannuronate monomer, dimer, trimer, tetramer, pentamer, and hexamer, respectively.
Figure 4.
Figure 4.
Analysis of the overall structure of AlyC3. A, the overall structure of the dimeric AlyC3. The bound succinic acid and glycerol molecules are shown as yellow and pink spheres, respectively. B, the overall structure of the monomeric AlyC3. The structure is depicted in rainbow colors from blue in the N-terminal region to red in the C-terminal region. The succinic acid and glycerol are shown as red and purple sticks, respectively. C, gel filtration analysis of the form of AlyC3 in solution using conalbumin (75 kDa) and carbonic anhydrase (29 kDa) as protein size standards. The molecular mass of dimeric AlyC3 is 6.1 kDa. D, the comparison of the interfaces of the dimeric AlyC3 with other dimeric alginate lyases. All three enzymes are shown as cartoon and surface views, respectively. E, comparison of loops 1 and 2 in PL7 structure-solved alginate lyases. All the proteins, except for the two loops, are colored in light gray. Loops of AlyP (PDB entry 1UAI), AlgAT5 (PDB entry 5ZQI), FlAlyA (PDB entry 5Y33), AlyA (PDB entry 4OZX), AlyQ (PDB entry 5XNR), PA1167 (PDB entry 1VAV), A1-IÍ (PDB entry 2CWS), AlyA5 (PDB entry 4BE3), AlyA1 (PDB entry 3ZPY), AlyB (PDB entry 5ZU5), and AlyC3 are colored in green, red, orange, light blue, purple, cyan, pink, wheat, yellow, deep teal, and blue, respectively.
Figure 5.
Figure 5.
Analysis of the adaptation of AlyC3 to the seawater salinity. A, the effect of salinity on AlyC3 activity. B, aggregation states of AlyC3 in different NaCl concentrations. Conalbumin (75 kDa) and carbonic anhydrase (29 kDa) from GE Healthcare were used as protein size standards to analyze the polymeric form of proteins. C, SDS-PAGE analysis of AlyC3 at different aggregation states. Lanes 1–4 correspond to peaks 1–4 in B, respectively. D, electrostatic surface view of the WT AlyC3 dimer.
Figure 6.
Figure 6.
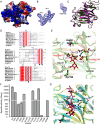
Analysis of the important amino acid residues in the active center of AlyC3. A, electrostatic surface view of H127A/Y244A–M2 monomer. The bound M2 and malonate molecules are shown as red and gray sticks, respectively. B, FoFc omit map of the M2 and malonate molecules in the H127A/Y244A–M2 complex. The simulated annealing FoFc omit map was generated using the Phenix program by omitting the M2 and malonate molecules. The resulting electron density map was contoured at 3σ. C, structural superposition alignment of WT AlyC3 and H127A/Y244A–M2. WT AlyC3 and H127A/Y244A–M2 are presented in green and purple, respectively. D, sequence alignment of PL7 alginate lyases. Black stars indicate the catalytic acid/base. Green circles indicate the neutralization residues. The figure was prepared using ESPript program. E, the residues interacting with M2 in H127A/Y244A–M2. WT AlyC3 and H127A/Y244A–M2 are in orange and green, respectively. M2 and malonate are shown as red and gray sticks, respectively. Side chains of His127, Tyr244, Arg78, and Gln125 in WT AlyC3 are depicted as orange sticks. Tyr190 and Arg82 in H127A/Y244A–M2 are shown as green sticks. Other residues are depicted as green lines. The hydrogen bonds are represented by dotted lines. F, the enzymatic activities of AlyC3 mutants. Experiments were conducted at 20 °C for 5 min in a 200-μl mixture containing enzymes at different concentrations and 2 mg/ml PM in 50 mm Tris-HCl (pH 8.0) containing 0.5 m NaCl. G, structural comparison of H127A/Y244A–M2 complex with the simulated model of the AlyC3-M4 complex. The AlyC3-M4 and H127A/Y244A–M2 are shown in cyan and yellow, respectively. The M2 (dimannuronate), malonate, and simulated M4 (tetramannuronate) are shown as red, gray, and pink sticks, respectively. The distances between the catalytic residues (His127 and Tyr44) to M2 and M4 are shown as black and blue dotted lines, respectively.
Figure 7.
Figure 7.
Schematic diagram of the proposed catalytic process of AlyC3. A, the substrate (take the tetramannuronate as an example) approaches the catalytic cavity. B, when the substrate enters the catalytic cavity, the positive charges of the groove and specific residues (black sticks) like Tyr44, Lys129, His141, Lys171, and Gln246 help the binding of the substrate. At this time, the tetramer is shown as a black dotted line, and the distances between the catalytic residues and substrate, which are shown as red dotted lines, are slightly far, affecting the catalytic efficiency. C, in the process of binding, residues Arg82 and Tyr190 help the accurate positioning of the substrate, and thus the catalytic residues are close to the substrate, ensuring the high catalytic efficiency. Meanwhile, the side chain of Arg78 migrates to assist with substrate positioning. At this time, the tetramer is shown as a black solid line, and the distances between the catalytic residues to the substrate are shown as red solid lines. The key residues His127, Tyr244, Arg78, and Gln125 mediate the catalytic reaction. Arg78 and Gln125 form interactions with the carboxyl group of the M + 1 and activate the Cα hydrogen of M + 1. His127 functions as the catalytic base to attack the Cα of M + 1, and Tyr244 functions as the catalytic acid to accept an electron. Electron transfer is presented with red arrows. D, the products are released after the degradation reaction.

Similar articles

Cited by

References

    1. Meillisa A., Woo H. C., and Chun B. S. (2015) Production of monosaccharides and bio-active compounds derived from marine polysaccharides using subcritical water hydrolysis. Food Chem. 171, 70–77 10.1016/j.foodchem.2014.08.097 - DOI - PubMed
    1. Smith S. V. (1981) Marine macrophytes as a global carbon sink. Science 211, 838–840 10.1126/science.211.4484.838 - DOI - PubMed
    1. Usov A. I., Bilan M. I., and Klochkova N. G. (1995) Polysaccharides of algae: 48. Polysaccharide composition of several calcareous red algae: isolation of alginate from Corallina pilulifera P. et R. (Rhodophyta, Corallinaceae). Bot. Mar. 38, 43–51 10.1515/botm.1995.38.1-6.43 - DOI
    1. Gorin P. A. J., and Spencer J. F. T. (1966) Exocellular alginic acid from Azotobacter vinelandii. Can. J. Chem. 44, 993–998 10.1139/v66-147 - DOI
    1. Linker A., and Jones R. S. (1966) A new polysaccharide resembling alginic acid isolated from Pseudomonads. J. Biol. Chem. 241, 3845–3851 - PubMed

Publication types

MeSH terms

Substances

LinkOut - more resources